

Abstract
Multiple sclerosis (MS) is an autoimmune disorder caused by chronic inflammatory reactions in the central nervous system. Currently, little is known about the changes of plasma proteomic profiles in Chinese patients with MS (CpwMS) and its relationship with the altered profiles of multi-omics such as metabolomics and gut microbiome, as well as potential molecular networks that underlie the etiology of MS. To uncover the characteristics of proteomics landscape and potential multi-omics interaction networks in CpwMS, Plasma samples were collected from 22 CpwMS and 22 healthy controls (HCs) and analyzed using a Tandem Mass Tag (TMT)-based quantitative proteomics approach. Our results showed that the plasma proteomics pattern was significantly different in CpwMS compared to HCs. A total of 90 differentially expressed proteins (DEPs), such as LAMP1 and FCG2A, were identified in CpwMS plasma comparing to HCs. Furthermore, we also observed extensive and significant correlations between the altered proteomic profiles and the changes of metabolome, gut microbiome, as well as altered immunoinflammatory responses in MS-affected patients. For instance, the level of LAMP1 and ERN1 were significantly and positively correlated with the concentrations of metabolite L-glutamic acid and pro-inflammatory factor IL-17 (Padj < 0.05). However, they were negatively correlated with the amounts of other metabolites such as L-tyrosine and sphingosine 1-phosphate, as well as the concentrations of IL-8 and MIP-1α. This study outlined the underlying multi-omics integrated mechanisms that might regulate peripheral immunoinflammatory responses and MS progression. These findings are potentially helpful for developing new assisting diagnostic biomarker and therapeutic strategies for MS.
Supplementary Information
The online version contains supplementary material available at 10.1186/s12883-024-03926-3.
Keywords: Proteomics, Differentially expressed protein, Immunoinflammatory response, Metabolic profile, Gut microbiome, Multi-omics interaction networks, Multiple sclerosis, Potential biomarker
Introduction
Multiple sclerosis (MS) is a common autoimmune disease in young adults that is caused by a chronic inflammation within the central nervous system (CNS) and the demyelination of nerve cell axons, leading to irreversible damages of nerve cells, gradual neurodegeneration, and substantial disability such as immune dysfunction, motor disability, and cognitive impairment [1–3]. MS has a higher incidence in European countries and the United States than in Asian countries. According to the Atlas of MS (www.atlasofms.org) compiled by the Multiple Sclerosis International Federation (MSIF), there are approximately 2.80 million individuals affected by MS currently, the global prevalence being nearly 35.9 per 100,000 people [4], and higher in women than in men [5]. The etiology of MS is highly complex, but it involves genetic susceptibility loci [6–8] and multiple environmental factors such as smoking, dietary structure, low levels of vitamin D, and infection with the Epstein-Barr virus [9–12].
Currently, little is known about the bona fide protein biomarkers in Chinese patients with MS (CpwMS), creating barriers to the accurate diagnosis and treatment of the disease. In the past decade, an increasing number of proteomic studies have been carried out to investigate possible pathways underlying MS pathobiology [13–26] and identify potentially reliable biomarkers [27–46]. Besides, multi-omics studies interactome analysis have been employed to define the pathological mechanisms of MS [47–53]. Given the blocking effect of blood-brain barrier (BBB) [54, 55] and the proximity of cerebrospinal fluid (CSF) to CNS lesions [56, 57], CSF is an ideal sample for the study of protein biomarkers discovery in MS. Previous research on CSF samples from MS patients [58–77] have identified a series of protein biomarkers such as oligoclonal bands and immunoglobulin G (IgG) as useful clinical diagnostic parameters of MS [73–75, 78]. However, because the CNS immunopathogenesis of MS originates and is persistently driven by the activation of peripheral immune inflammatory responses [79], it is very important to identify plasma-derived biomarkers with higher sensitivity and reproducibility that can allow rapid and accurate diagnosis and timely intervention in the early stages of MS.
Although massive proteomics and multi-omics studies in MS-affected Caucasian populations and in MS animal models have been performed, the landscape of peripheral proteomics and the potential plasma biomarkers in CpwMS and the underlying molecular networks between proteomics and multi-omics in the circulating system of CpwMS are largely unknown. In the current study, we seek to uncover potentially novel biomarkers by performing a comparative analysis of CpwMS and healthy controls (HCs) plasma samples through Tandem Mass Tag (TMT) labeling quantitative proteomics method. Also, we seek to explore the latent pathological pathways and molecular mechanisms that can potentially influence the etiology of MS.
Our results not only show that the plasma proteomic profiles in CpwMS differ significantly from that of HCs, identifying differentially expressed proteins related to MS; but it also highlights the underlying interactions between proteomics and multi-omics profiles in MS. These findings show possible integrated molecular networks that might possibly maintain the inflammatory response in the circulatory system and contribute to the migration of autoimmune inflammatory reactions from the peripheral system to the CNS. The results of this study may, therefore, be helpful in facilitating the accurate diagnosis and the development of new therapeutic strategies for MS generally and in CpwMS, in particular.
Methods and materials
Participants enrollment
The protocols of this study were reviewed and approved (Approval number 20171116-3) by the Ethics Committee of Lishui Second People’s Hospital (Zhejiang, China) before the enrollment of all subjects. All research was performed in accordance with the Declaration of Helsinki. A total of 22 Chinese patients with MS, of which 20 and 2 were RRMS and PPMS cases, respectively, were clinically diagnosed based on the 2005 McDonald criteria revised version [80]. 22 age- and gender-matched healthy subjects were also recruited (Table S1). All participants were fully informed and informed consent was obtained from each subject prior to enrollment. None of the participants had ever undergone treatment with immunomodulatory treatments, such as steroids, β-interferon, cladribine, S1P modulators, anti-CD20, teriflunomide, and dimethyl fumarate, in 18 months before the recruitment into the study. The exclusion criteria were: obese individuals with a body mass index (BMI) ≥ 30.0; being ≤ 20 years of age; patients with chronic diseases such as diabetes mellitus, hypertension, and hyperlipidemia; having an active bacterial, fungal, or virus infections; having another autoimmune illness.
Plasma biospecimen collection
3.0 mL of peripheral blood were collected from all patients with MS and healthy volunteers using EDTA-anticoagulant vacuum blood collection tubes. The blood samples were rocked gently to ensure proper mixing of the anticoagulant and the blood. Then, the blood samples were centrifuged at 3,500× g for 10 min at 4 °C. Subsequently, the supernatant of the plasma from each sample was transferred carefully into a new tube and frozen quickly in liquid nitrogen. All the plasma samples were stored immediately at -80 °C for subsequent analysis.
Quantitative proteomics analysis of plasma samples
Removal of highly abundant proteins
High-abundance proteins were removed using the Proteominer Protein Enrichment Kit (Bio-Rad, Hercules, California, USA) according to the manufacturer’s instructions. Briefly, the purification column was removed from the freezer and equilibrated to the room temperature (RT). Then, 10.0 µL of plasma samples from each subject were added into columns and mixed with the plasma with the matrix adequately, followed by incubation for 10 min at RT. Subsequently, the purification column was placed into a new 1.5 mL centrifuge tube and centrifuged at 1,000× g for 2 min. BCA assay was performed to evaluate the protein concentration. The plasma samples were stored at -20 °C for further analysis.
Trypsin enzymolysis of total proteins
The filter-aided sample preparation (FASP) method was employed to perform the enzymatic hydrolysis of the plasma total proteins [81]. Firstly, 200.0 µL of denaturation solution (contains 8.0 M guanidine hydrochloride, and 50.0 mM PBS) was added into 50.0 µg of each protein sample and mixed fully. Secondly, 10.0 µL of 1.0 M iodine acetamide was pipetted to each sample and mixed well, then the mixture was incubated in the dark for 30 min at 30 °C. The buffer was substituted with 100.0 mM concentration of triethyl ammonium bicarbonate solution by using a 10 KDa ultrafiltration tube. 100.0 mM triethyl ammonium bicarbonate solution was used to wash the filter element until the final volume of the solution was up to 200.0 µL. Thirdly, 1.0 µg trypsin was added into each sample and incubated at 37 °C overnight. The ultrafiltration tube was centrifuged at 12,000× g for 20 min at 4 °C to collect the enzymatic hydrolysis products. Finally, all the peptide samples were stored at -20 °C for further analysis.
Isotopic labeling (TMT labeling)
TMT 10-plex™ Label Reagent (ThermoFisher Scientific, USA) was used to label the plasma-derived peptides according to the manufacturer’s instructions. Briefly, the reagent for TMT labeling was taken from the freezer and brought to the RT. Then, 42.0 µL of anhydrous acetonitrile was added into TMT reagent in each tube, vortexed intermittently for 5 min, and centrifuged quickly. Dry peptides were dissolved in 200.0 µL of ddH2O by shaking vigorously for 10 min. Subsequently, the products of enzymatic hydrolysis were pipetted into a new centrifuge tube, followed by adding 20.0 µL TMT labeling reagent, vortexed, centrifuged quickly, and incubated at RT for 1 h. Then, 4.0 µL of 5.0% hydroxylamine was added into the reaction mixtures, vortexed, centrifuged quickly, and incubated at RT for 15 min to terminate the labeling reaction. All the labeled samples were mixed completely by vortexing thoroughly, rapid centrifugation, and all the sample mixtures were dried using centrifugal concentrator before freezing at -80 °C. The mixtures of 44 equally mixed samples were labeled with TMT10-131 and used as quality control (QC) sample.
Fractionation of liquid chromatography
Peptides fractionation assay was performed using the Ultra-Performance Liquid Chromatography (UPLC) 3000 system (Dionex, CA, USA) combined with a C18 column of XBridge™ BEH300 (Waters Co. Ltd., MA, USA). 0.1% formic acid solution was used as mobile phase A, while 80.0% acetonitrile containing 0.1% formic acid was used as mobile phase B. All peptides were fractionated through the following gradient of liquid phase: 2.0 to 6.0% phase B for 3 min, 6.0 to 20.0% phase B for 95 min, 20.0 to 32.0% phase B for 107 min, 32.0 to 100.0% phase B for 108 min, 100.0% phase B for 120 min. A total of 48 fragments were collected, dried, and resuspended with 0.1% formic acid.
Detection of mass spectrometry
All labeled peptides were separated by using the Q Exactive mass spectrometry (ThermoFisher Scientific, USA) coupled with the Easy nLC-1000 system, ESI + ion mode and data-dependent acquisition (DDA) mode were used adopted. Data was acquired from the 20 most abundant precursor ions (top20) in each full scan, the detailed setting parameters were as follows: MS1 scan range, 300 ~ 1500 m/z; Higher Energy Collision Dissociation (HCD) fragmentation mode; normalized energy, 30.0%; capillary temperature, 275 °C; spray voltage, 1.80 kV; secondary ion resolution, 3,500 (AGC 2.2e4); Full scan time, 50 ms; and maximum IT, 45 ms; and dynamic exclusion, 30 s.
Data processing
The mass spectrometry proteomics data have been deposited to the ProteomeXchange Consortium via the PRIDE [82] partner repository with the dataset identifier PXD040101 and 10.6019/PXD040101. Proteomic raw data was analyzed using Peaks Studio X software to generate the intensity matrix of peptides/proteins. The setting for the parameters was as follows: mass tolerance of primary ion was 10 ppm, mass tolerance of secondary spectrum diagram was 0.02 u, constant modification was carbamidomethyl (C), variable modification was deamidation (NQ) and oxidation (M). Peptides with false discovery rate (FDR) ≤ 1.0% and proteins with − 10lgP ≥ 40.0 were identified.
Identification of differentially expressed proteins
The matrix profiles acquired from the data processing were used for analyzing the differentially expressed proteins (DEPs). Firstly, all proteins with an intensity of 0 in more than two-thirds of the samples were removed. Secondly, the batch effect was adjusted using ComBat function in R package sva v3.42.0, which was followed by the identification of statistically and differentially expressed proteins using limma v3.50.1 in R package [83], with parameters of fold change (CpwMS/controls, FC) ≥ 2.0 or ≤ 0.5 [i.e., Log2(FC) > 1.0 or < -1.0] and P value < 0.05. The maximum and minimum of Log2(FC) were set to 10.0 and − 10.0, respectively. Benjamini and Hochberg’s (BH) procedure was used to correct t-test and obtained adjusted P (Padj) values.
Bioinformatics analysis
The unsupervised analysis such as principal component analysis (PCA), as well as supervised analysis, including partial least squares-discriminant analysis (PLS-DA) and orthogonal partial least squares-discriminant analysis (OPLS-DA), were performed by using SMICA v14.1 software. The volcano and Box plot were plotted by using ggplot2 v3.3.4 in R package. Heatmap was plotted by using Pheatmap v1.0.12 in R package [84]. Gene Ontology (GO) and Kyoto Encyclopedia of Genes and Genomes (KEGG) enrichment analysis were conducted by using clusterProfiler v4.2.2 and DOSE packages in R software [85–88]. Over-Representation Analysis (ORA) was performed using WebGestalt to provide deeper insights into the differential contributions of these up- and down-regulated genes to the enriched pathways. Protein-protein interaction (PPI) analysis was carried out by using online tool STRING v11.5 [89]. Enrichment analysis of tissue specific expression was performed with the online tool TissueEnrich (https://tissueenrich.gdcb.iastate.edu/) [90]. Unsupervised ML analysis including K-means or hierarchical clustering was performed to identify the set of biomarkers, including differentially expressed proteins, cytokines, and metabolites, that are capable of distinguishing MS subjects from healthy controls. Receiver operating characteristic (ROC) figures were plotted using pROC v1.18.0 in R package [91].
Correlation analysis between proteomics and multi-omics data
The overall changes of plasma metabolic profiles in MS-affected patients and healthy controls were conducted using global untargeted metabolomics approach, with detailed experimental procedures carried out as described in a previous study [92]. The alterations of fecal microbiota in all subjects were analyzed using 16 S rRNA sequencing, following a detailed protocol as described in a previous study [93]. Besides, the concentrations of cytokines and chemokines, such as tumor necrosis factor-α (TNF-α) and interleukin-17 (IL-17), were detected using the magnetic beads immunoassay kit (Bio-Rad, CA, USA), as described in a previous study [92]. First, the methods of Shapiro-Wilk statistic, KS statistic, and Dagostino statistic, were used to assess the normality of variables of proteomics, metabolome, gut microbiome, and inflammatory factors. The variables were considered as normally distributed when P value > 0.05. Second, the correlation analysis between the data of proteomics and metabolome, microbiome, and cytokines/chemokines was carried out using psych v2.2.3 in R package. Pearson correlation coefficient was used to determine the correlation degree between the levels of DEPs and metabolites, microbial species, and the concentrations of cytokines/chemokines.
Statistical analyses
Independent t-tests, Mann-Whitney U-tests, and White’s nonparametric t-tests were adopted for analyzing continuous variables. P values correction was conducted by using BH method. The categorical variables between groups were analyzed by using Pearson chi-square test. Graphs were prepared using GraphPad Prism (San Diego, CA, USA). Statistical analysis was performed using SPSS V19.0 (Chicago, IL, USA) and two-sided statistical significance was tested, with only a P or Padj value < 0.05 considered as statistically significant.
Results
Identification of differentially expressed proteins in MS-affected patients
To further investigate the characteristics of proteomic profiles in peripheral blood from Chinese patients with MS (CpwMS), and potential protein biomarkers of MS, we performed a LC-MS/MS-based quantitative proteomic analysis on the plasma samples from 22 CpwMS and 22 age- and gender-matched healthy controls (HCs) (Table S1). The results of supervised analysis, including PLS-DA and OPLS-DA, and unsupervised analysis of PCA revealed all samples of CpwMS were properly separated from HCs (Fig. 1A-C), suggesting that the proteomic profile was altered significantly in CpwMS. A total of 90 significantly and differentially expressed proteins (DEPs) were identified in CpwMS compared to HCs, of which 29 and 61 proteins were significantly up- and down-regulated (P < 0.05), respectively (Fig. 2A and B, Table S2).
Fig. 1.

PCA, PLS-DA, and OPLS-DA models for separating MS-affected patients and healthy controls. (A) PCA plot. (B) PLS-DA plot. The model interpretability of X and Y variable datasets was R2X = 0.569 and R2Y = 0.994, respectively, model predictability Q2 = 0.918.(C) OPLS-DA plot. The model interpretability of X and Y variable datasets was R2X = 0.364 and R2Y = 0.874, respectively, model predictability Q2 = 0.823
Fig. 2.

Identification of 90 differentially expressed proteins and its overlaps shared with known MS-related DEGs. (A) Volcano plot of all DEPs. P value < 0.05 and fold change (MS/controls) > 2.0 or < 0.5. The maximum and minimum of Log2(FC) were 10.000 and − 10.000, respectively. The maximum of -Log10(P value) was set at 10.000. (B) Heatmap plot of all DEPs. Case group: MS 01–22, control group: Con 01–22. The red and green denote up- and down-regulation, respectively. (C-F) Overlapping genes/proteins shared by our DEPs and MS-related DEGs reported in different studies. The gene shown in bold represents that the gene has been identified as signature associated with MS in at least three separate studies
To determine how many DEPs were overlapped by MS-related differentially expressed genes (DEGs) that reported by previous studies, we have reviewed relevant gene expression studies [94–100] and compared our DEPs with the DEGs reported in these studies. The results showed that multiple overlaps were shared by our DEPs and MS-related DEGs reported in different studies (Table 1). For example, a total of 26 overlapping proteins/genes, including ZNF607, SYNE1, KNTC1, HPSE, IQEC1, EGLN, NCOA4, ERN1, LAPM1, MUC18, AP5S1, GAPD1, TSP2, CE152, GLYL2, ITPR2, MIPT3, TIAM1, PVR, CNTRL, NMD3, CK5P2, HV169, HV372, KVD28, and KV320 (Fig. 2C), were shared by our DEPs and DEGs identified in monocytes from MS patients that reported by Porozhan, Y., et al. [94]. Among the 26 overlapping proteins, the expression levels of 12 proteins including HPSE, ERN1, LAMP1, NCOA4, GLYL2, HV372, KVD28, AP5S1, GAPD1, CE152, KV320, and MIPT3 showed consistent fold change (i.e., up- or down-regulated in MS compared to control samples) between our study and the transcriptome study that performed by Porozhan, Y., et al. [94]. Moreover, a total of 11 overlapping proteins out of our DEPs, including SYNE1, KNTC1, IQEC1, EGLN, GWL, FCGR3A, SSFA2, CE152, FLNA, GRDN, and CK5P2, were also found in CD4+ T cells of relapsing-remitting MS patients that was reported by Salehi, Z., et al. [95]. (Fig. 2D). Besides, the expression levels of EGLN, IQEC1, FLNA, FCGR3A, CK5P2, SSFA2, and GRDN showed consistent fold change between the two independent studies. Furthermore, we also observed that totals of 7 overlaps including HBA, NCOA4, KIT, FCGR2A, MA2A1, FCGR2C, and CATA were shared by our DEPs and MS-related DEGs reported by Martin-Gutierrez, L., et al. [96]. (Fig. 2E), and that a total of 7 overlaps including HPSE, HBA, TRFL, IGKC, KVD28, KV228, and KV401 were also shared by our DEPs and those MS-relevant DEGs identified by Shang, Z., et al. [97]. (Fig. 2F). In addition, in one recent study, Yeh, W.Z., et al. [98] revealed MS-related DEGs in various immune cell subsets, such as CD4+ and CD8+ T cells, B cells, and monocytes. We also observed that 7 DEGs in CD8+ T cells (including SMC3, SYNE1, NID1, TARSH, IQEC1, NMD3, and GRDN), 4 DEGs in CD4+ T cells (ZNF607, CATA, NID1, and CAD13), 3 DEGs in B cells (RNAS4, GAPD1, and B3GT5), as well as 1 DEG in monocytes (i.e., ZNF607), were also identified in the current study. Additionally, our DEPs also shared 2 (i.e., ZNF607 and MARCO) and 1 (i.e., TRFL) overlapping proteins with those MS-associated DEGs identified by Lindsey, J.W [99]. and Malhotra, S., et al. [100], respectively. Taken together, several genes such as ZNF607, SYNE1, KNTC1, and HPSE have been repeatedly identified in different studies, suggesting that these genes may be involved in the onset and progression of MS.
Table 1.
Overlapping molecules shared by our DEPs and differentially expressed genes reported from different studies
| Study description | Number of overlaps | Overlapping genes | References |
|---|---|---|---|
| RNA Sequencing analysis of monocytes from patients with MS compared to controls patients | 26 | SYNE1, MUC18, IQEC1, ZNF607, ERN1, KNTC1, AP5S1, EGLN, GAPD1, TSP2, CE152, GLYL2, HPSE, LAPM1, ITPR2, MIPT3, TIAM1, PVR, CNTRL, NMD3, NCOA4, CK5P2, HV169, HV372, KVD28, KV320 | [94] |
| RNA Sequencing of CD4+ T cells in RRMS patients at relapse compared to healthy controls | 11 | KNTC1, GWL, FCGR3A, EGLN, SSFA2, IQEC1, SYNE1, CE152, FLNA, GRDN, CK5P2 | [95] |
| RNA Sequencing of CD4+ T cells isolated from patients with RRMS compared to healthy controls | 7 | KIT, FCGR2A, CATA, MA2A1, FCGR2C, NCOA4, HBA | [96] |
| ArrayExpress database-sourced gene expression analysis of peripheral blood mononuclear cells from patients with RRMS compared to healthy controls | 7 | IGKC, TRFL, HPSE, HBA, KVD28, KV228, KV401 | [97] |
| Microarray-based detection of mRNA expression in paired samples from MS patients during clinical relapse and while stable | 2 | ZNF607, MARCO | [99] |
| RNA sequencing of peripheral blood mononuclear cells from untreated patients with MS compared to healthy controls | 1 | TRFL | [100] |
| RNA sequencing of immune cell subsets (CD4+, CD8+ T cells, B cells, monocytes) from untreated MS cases and healthy controls | 7 (CD8+ T cells) | SMC3, SYNE1, NID1, TARSH, IQEC1, NMD3, GRDN | [98] |
| 4 (CD4+ T cells) | ZNF607, CATA, NID1, CAD13 | ||
| 3 (B cells) | RNAS4, GAPD1, B3GT5 | ||
| 1 (monocytes) | ZNF607 |
MS, multiple sclerosis; RRMS, relapsing-remitting multiple. The gene shown in bold indicates that the gene (protein) has been identified as signature associated with MS in at least three separate studies
Among the 90 DEPs, the expression levels of ITA8 [Log2(FC) = 10.000, Padj = 3.300e-08], S2A4R [Log2(FC) = 10.000, Padj = 1.300e-07], and VNN1 [Log2(FC) = 10.000, Padj = 2.170e-07] were significantly increased in the plasma of CpwMS compared with those of HCs, while the circulating levels of KVD11 [Log2(FC) = -2.214, Padj = 2.800e-08], KV311 [Log2(FC) = -2.214, Padj = 2.800e-08], HPSE [Log2(FC) = -10.000, Padj = 3.300e-08], TRFL [Log2(FC) = -10.000, Padj = 7.870e-08], PF4V [Log2(FC) = -2.324, Padj = 8.140e-08], MUCB [Log2(FC) = -2.855, Padj = 1.930e-07], and LTBP1 [Log2(FC) = -3.427, Padj = 2.980e-07] was largely decreased in CpwMS comparing to HCs (Fig. 3). Moreover, the levels of PROF1 [Log2(FC) = -10.000, Padj = 3.560e-07], K2C6A [Log2(FC) = -4.181, Padj = 6.410e-07], MARCO [Log2(FC) = -10.000, Padj = 9.770e-07], FCG3A [Log2(FC) = -1.7307, Padj = 5.560e-05], FLNA [Log2(FC) = -10.000, Padj = 3.910e-04], MUC18 [Log2(FC) = -1.7678, Padj = 0.0048], and FCG2A [Log2(FC) = -1.866, Padj = 0.0111] was significantly decreased in the plasma of CpwMS compared with that of HCs (Fig. S1), whereas the circulatory levels of LAMP1 [Log2(FC) = 10.000, Padj = 1.0003-06], CNTRL [Log2(FC) = 10.000, Padj = 1.860e-06], and ERN1 [Log2(FC) = 2.5437, Padj = 0.0041] was markedly increased in CpwMS in respect with HCs (Fig. S1).
Fig. 3.

The most significant differentially expressed proteins in MS plasma. The levels of 10 top-ranking DEPs, including KVD11, KV311, ITA8, HPSE, TRFL, PF4V, S2A4R, MUCB, VNN1, and LTBP1 in the plasma samples of 22 MS-affected patients and 22 healthy controls. T-test was used to compare samples from the two groups. The Benjamini-Hochberg approach was used to correct P value and obtain adjusted P (Padj) value. *Padj < 0.05, **Padj < 0.01, ***Padj < 0.001
To identify the potential molecules that are capable of distinguishing CpwMS and HCs, an unsupervised ML analysis was performed using differentially expressed proteins, cytokines and metabolites [92]. The results of hierarchical clustering and K-means analysis suggested that all of the 90 DEPs can effectively separate the samples of the CpwMS group from that of HCs group (Figs. S2A and B). Specifically, several DEPs are capable of distinguishing CpwMS and HCs with high potency (AUC > 0.9000), for example, K2C6A (AUC = 0.9913, specificity = 95.45%, sensitivity = 95.24%), TITIN (AUC = 0.9697, specificity = 100.00%, sensitivity = 85.71%), KVD11 (AUC = 0.9621, specificity = 100.00%, sensitivity = 90.48%), PON3 (AUC = 0.9351, specificity = 90.91%, sensitivity = 90.48%), MUCB (AUC = 0.9275, specificity = 81.82%, sensitivity = 100.00%), and GWL (AUC = 0.9102, specificity = 86.36%, sensitivity = 85.71%) (Fig. S3A-F). Moreover, we also observed that several combinations of differentially expressed proteins and metabolites had high potency in separating CpwMS samples from HCs (AUC ≥ 0.9000), such as L-glutamic acid and RNAS4 (AUC = 0.9091, specificity = 87.50%, sensitivity = 81.82%), L-tryptophan and GLYL1 (AUC = 0.9318, specificity = 87.50%, sensitivity = 90.91%), Sphinganine 1-phosphate and GLYL2 (AUC = 0.9222, specificity = 88.89%, sensitivity = 90.00%), L-phenylalanine and TIAM1 (AUC = 0.9556, specificity = 90.00%, sensitivity = 88.89%), L-phenylalanine and FCG3A (AUC = 0.9444, specificity = 90.00%, sensitivity = 88.89%), Isocitric acid and ITPR2 (AUC = 0.9000, specificity = 80.00%, sensitivity = 88.89%), Nicotinuric acid and FCG2A (AUC = 0.9000, specificity = 90.00%, sensitivity = 88.89%), Phytosphingosine and EGLN (AUC = 0.9444, specificity = 90.00%, sensitivity = 88.89%), as well as N-acetyl-L-aspartic acid and GLYL2 (AUC = 0.9432, specificity = 90.91%, sensitivity = 87.50%) (Fig. 4A-I), suggesting that these molecules may be used as potential biomarkers related to MS. Furthermore, several combinations of differentially expressed cytokines, metabolites, or proteins also had high potency (AUC > 0.9000) in distinguishing CpwMS from HCs, for instance, IL-7 and Phytosphingosine (AUC = 0.9545, specificity = 90.91%, sensitivity = 87.50%), IL-9 and Uridine (AUC = 0.9167, specificity = 91.67%, sensitivity = 85.71%), IL-12 and Isocitric acid (AUC = 0.9222, specificity = 90.91%, sensitivity = 87.50%), IL-13 and FCG3A (AUC = 0.9206, specificity = 90.91%, sensitivity = 87.50%), MIP-1α and L-valine (AUC = 0.9444, specificity = 90.00%, sensitivity = 88.89%), MIP-1α and Skatole (AUC = 0.9318, specificity = 87.50%, sensitivity = 90.91%), TNF-α and RNAS4 (AUC = 0.9333, specificity = 88.89%, sensitivity = 90.00%), TNF-α and Dehydroepiandrosterone (AUC = 0.9405, specificity = 91.67%, sensitivity = 85.71%), as well as TNF-α and Pseudouridine (AUC = 0.9091, specificity = 87.50%, sensitivity = 90.91%) (Fig. S4A-I). Taken together, these results indicated that the above molecules may be used as potential biomarkers associated with MS.
Fig. 4.

Unsupervised ML analysis of potential molecules for distinguishing MS samples from healthy controls. The area under curve (AUC), specificity, and sensitivity value of various combination of differentially expressed proteins and metabolites, including L-Glutamic acid and RNAS4 (A), L-Tryptophan and GLYL1 (B), Sphinganine 1-phosphate and GLYL2 (C), L-Phenylalanine and TIAM1 (D), L-Phenylalanine and FCG3A (E), Isocitric acid and ITPR2 (F), Nicotinuric acid and FCG2A (G), Phytosphingosine and EGLN (H), and N-acetyl-L-aspartic acid and GLYL2 (I), in distinguishing MS patients and healthy controls
Functional and pathway enrichment analysis of differentially expressed proteins
To further investigate the biological functions and gain insights into the pathways used by the DEPs, we carried out GO and KEGG pathway enrichment analysis, as well as PPI and tissue expression enrichment analysis. GO enrichment analysis results showed that the DEPs were mainly involved in the biological processes of immune-inflammatory responses, such as the production of the molecular mediator of the immune response, defense response to bacteria, antimicrobial humoral response, immunoglobulin production, phagocytosis, and humoral immune response (Fig. 5A). They were primarily localized in the immunoglobulin complex blood microparticle, endocytic vesicle lumen, and mitotic spindle pole (Fig. 5B). The molecular function of the DEPs was mainly enzymatic and binding activity of peroxidase, oxidoreductase, and endoribonuclease activity, and binding to IgG, haptoglobin, the immunoglobulin receptor, and antigens (Fig. 5C). Moreover, KEGG pathway enrichment analyses results showed that the up-regulated proteins mainly participated in Ras signaling, Rap1 signaling, phosphatidylinositol signaling, GnRH signaling, and so on (Fig. 5D), and that the down-regulated genes are primarily phagosome, systemic lupus erythematosus, Fc gamma R-mediated phagocytosis, glycosaminoglycan degradation, and so on (Fig. 5E). Furthermore, the results of ORA analyses showed that the top five ranked biological processes of up-regulated genes were biological regulation, response to stimulus, cell communication, metabolic process, and multicellular organismal process (Fig. S5A). The top five ranked cellular components of up-regulated genes were endomembrane system, membrane, vesicle, protein-containing complex, and nucleus (Fig. S5B). The top five ranked enriched molecular functions of up-regulated genes were protein binding, ion binding, transferase activity, nucleic acid binding, and hydrolase activity (Fig. S5C). In addition, the top five ranked biological processes enriched by down-regulated genes were response to stimulus, biological regulation, multicellular organismal process, metabolic process, and developmental process (Fig. S5D). The top five ranked cellular components enriched by down-regulated genes were membrane, extracellular space, vesicle, nucleus, and membrane-enclosed lumen (Fig. S5E). And, the top five ranked molecular functions enriched by down-regulated genes were protein binding, ion binding, nucleic acid binding, hydrolase activity, and molecular transducer activity (Fig. S5F).
Fig. 5.

Functional enrichment analysis of all differentially expressed proteins. (A) Dot plot of significantly enriched biological processes of all DEPs. (B) The most top-ranking cellular compartments among all DEPs. (C) The bar graph of enriched molecular functions of all DEPs. (D) and (E) KEGG pathway enrichment analysis of the up-regulated and down-regulated DEPs, respectively
In addition, the results of PPI analysis indicated that several MS-related proteins, including FLNA, LAMP1, ERN1, FCG2A, and FCG3A, directly interacted with each other (Fig. S6A). Particularly, FLNA functioned as the key node that links LAMP1, ERN1, and TITIN (Fig. S6A). Moreover, the tissue-specific expression enrichment results showed that the DEPs exhibited observable expression fold change in various tissues, such as the gallbladder, breast, liver, bone marrow, spleen, and cerebral cortex (Fig. S6B); though the expression enrichment of certain DEPs was not significant in the spleen and cerebral cortex (P > 0.05) (Fig. S6C).
The potential interaction between proteomic and metabolic profiles in MS
To further investigate the correlation between the altered expression level of DEPs and the abundant alterations of differential metabolites in the patients with MS, proteomics and metabolome data were co-analyzed using Pearson’s correlation analysis. Firstly, we assessed whether the variables of proteomics and metabolome were normally distributed using multiple statistical tests, such as Shapiro-Wilk statistic, KS statistic, and Dagostino statistic. The results of these tests indicated that the variables of proteomics and metabolome were normally distributed (P > 0.05) (Figs. S7 and S8), allowing us to proceed with Pearson’s correlation analysis. Previously, a total of 42 differentially abundant metabolites (DAMs) were identified in a LC-MS/MS study, of which 12 and 30 differential metabolites’ levels were significantly up- and down-regulated [92], respectively. In the present study, we found that all the DEPs and DAMs showed extensive interaction and significant correlation in patients with MS (Fig. 6). For instance, up-regulated proteins like LAMP1 and ERN1 were significantly and positively correlated with abundantly increased metabolites, such as L-glutamic acid, arachidonic acid, β-alanyl-L-arginine, O-phosphoethanolamine, and palmitic acid (Padj < 0.05) (Fig. 6), whereas LAMP1 and ERN1 were significantly and negatively correlated with abundantly decreased metabolites such as L-tyrosine, 17a-estradiol, L-isoleucine, sphingosine 1-phosphate, and sphinganine 1-phosphate (Padj < 0.05) (Fig. 6). Moreover, down-regulated proteins like FLNA and HPSE showed significant and negative correlation (Padj < 0.05) with abundantly increased metabolites, such as L-glutamic acid, arachidonic acid, O-phosphoethanolamine, palmitic acid, methyl jasmonate, sorbitol, and spermidine (Fig. 6). However, most of the DEPs with decreased levels such as FLNA and HPSE, exhibited significant and positive correlation with abundantly decreased metabolites, including L-tyrosine, L-leucine, L-isoleucine, sphingosine 1-phosphate, and sphinganine 1-phosphate (Padj < 0.05) (Fig. 6).
Fig. 6.
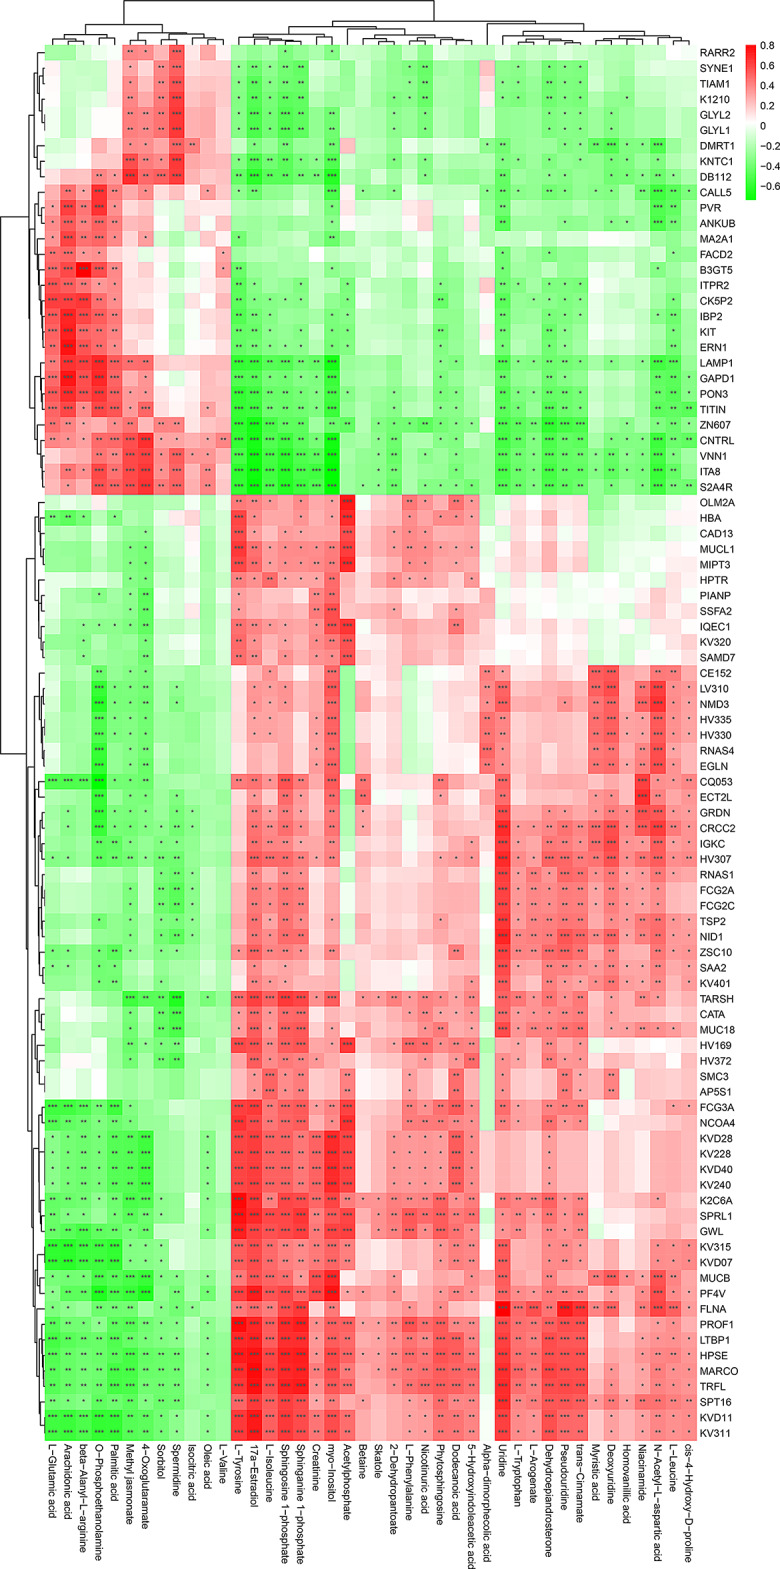
Significant correlation between DEPs and abundantly differential metabolites in MS-affected patients. The heatmap was plotted by using Pearson’s correlation analysis. The correlation coefficient was visualized by red and green, which denote positive and negative correlations, respectively. Asterisks represent significant correlations. The Benjamini-Hochberg method was used to correct P value. *Padj < 0.05, **Padj < 0.01, ***Padj < 0.001
Moreover, we also observed significant correlations between the altered levels of certain DEPs and DAMs. For example, the levels of LAMP1 were positively correlated with the levels of L-glutamic acid (r = 0.4358; Padj = 3.489e-03), while they were negatively correlated with the levels of L-tyrosine (r = -0.5738; Padj = 5.746e-05), sphingosine 1-phosphate (r = -0.4871; Padj = 9.235e-04), sphinganine 1-phosphate (r = -0.4067; Padj = 6.801e-03), and myo-inositol (r = -0.6640; Padj = 1.211e-06) (Fig. 7A). Also, ERN1 and L-glutamic acid (r = 0.4814; Padj = 1.082e-03) showed significantly positive correlation, while ERN1 and L-tyrosine (r = -0.4341; Padj = 3.634e-03), sphingosine 1-phosphate (r = -0.3032; Padj = 4.814e-02), sphinganine 1-phosphate (r = -0.3092; Padj = 4.363e-02), and myo-inositol (r = -0.3788; Padj = 1.226e-02), showed obviously negative correlation (Fig. 7B). Nevertheless, the concentration of FLNA was negatively correlated with the levels of L-glutamic acid (r = -0.3551; Padj = 1.945e-02), whereas it was positively correlated with the levels of L-tyrosine (r = 0.4406; Padj = 3.108e-03), sphingosine 1-phosphate (r = 0.5736; Padj = 5.787e-05), sphinganine 1-phosphate (r = 0.6281; Padj = 6.517e-06), and myo-inositol (r = 0.4350; Padj = 3.552e-03) (Fig. 7C). Additionally, the level of FCG2A was negatively correlated with the levels of methyl jasmonate (r = -0.3567; Padj = 1.887e-02), however, it was positively correlated with the concentrations of 17a-estradiol (r = 0.4364; Padj = 3.437e-03), L-isoleucine (r = 0.3788; Padj = 1.225e-02), sphingosine 1-phosphate (r = 0.4505; Padj = 2.437e-03), and sphinganine 1-phosphate (r = 0.4264; Padj = 4.358e-03) (Fig. 7D). These results suggest that the altered proteomics profiles may be directly correlated with and be interacted with altered metabolic networks in the plasma of patients with MS. Such altered profiles may also make synergistic contributions to maintaining the inflammatory state in the peripheral system of MS-affected patients.
Fig. 7.

Levels of LAMP1, ERN1, FLNA, and FCG2A significantly correlated with the abundances of differential metabolites. Correlations between the level of LAMP1 (A), ERN1 (B), FLNA (C) and the levels of L-glutamic acid, L-tyrosine, sphingosine 1-phosphate, sphinganine 1-phosphate, and myo-inositol. (D) Correlation between the levels of FCG2A and the levels of methyl jasmonate, 17a-estradiol, L-isoleucine, sphingosine 1-phosphate, and sphinganine 1-phosphate. Pearson’s correlation (r) and probability (p) were used to evaluate the statistical importance. 95% confidence interval (CI) was indicated by the gray area surrounding blue straight line
The potential networks of proteomic-immune crosstalk in MS
To investigate whether the altered profiles of plasma proteomics were associated with changes in immuno-inflammatory responses in the peripheral system of MS-affected patients, we examined the correlations between the levels of all the DEPs and the concentrations of representative cytokines and chemokines by using Pearson’s correlation analysis. Multiple statistical analyses showed that the variables of cytokines and chemokines were normally distributed (P > 0.05) (Fig. S9), allowing us to proceed with Pearson’s correlation analysis. A recent study indicated that the concentrations of pro-inflammatory mediators like TNF-α and IL-17, and those of anti-inflammatory factors such as IL-7 and IL-8, were significantly increased and decreased in patients with MS, respectively, compared with those of healthy controls [92]. As expected, we found extensive associations between the levels of DEPs with the circulating levels of immune-inflammatory mediators (Fig. 8). Particularly, the concentrations of TNF-α and IL-17 were significantly and positively correlated with the levels of up-regulated proteins, such as ITA8, VNN1, S2A4R, ZNF607, CNTRL, and DB112 (Padj < 0.05), however, they were markedly and negatively correlated with decreased levels of proteins, including PROF1, TRFL, LTBP1, MARCO, HPSE, KVD11, KV311, and FCG2C (Padj < 0.05) (Fig. 8). In contrast, abundantly reduced chemokines such as IL-7 and IL-8 were significantly and positively correlated with altered levels of DEPs such as MUC18, MUCB, and FCG3A (Padj < 0.05), while they were negatively correlated with altered levels of DEPs including ZNF607, VNN1, and ITA8 (Padj < 0.05) (Fig. 8).
Fig. 8.
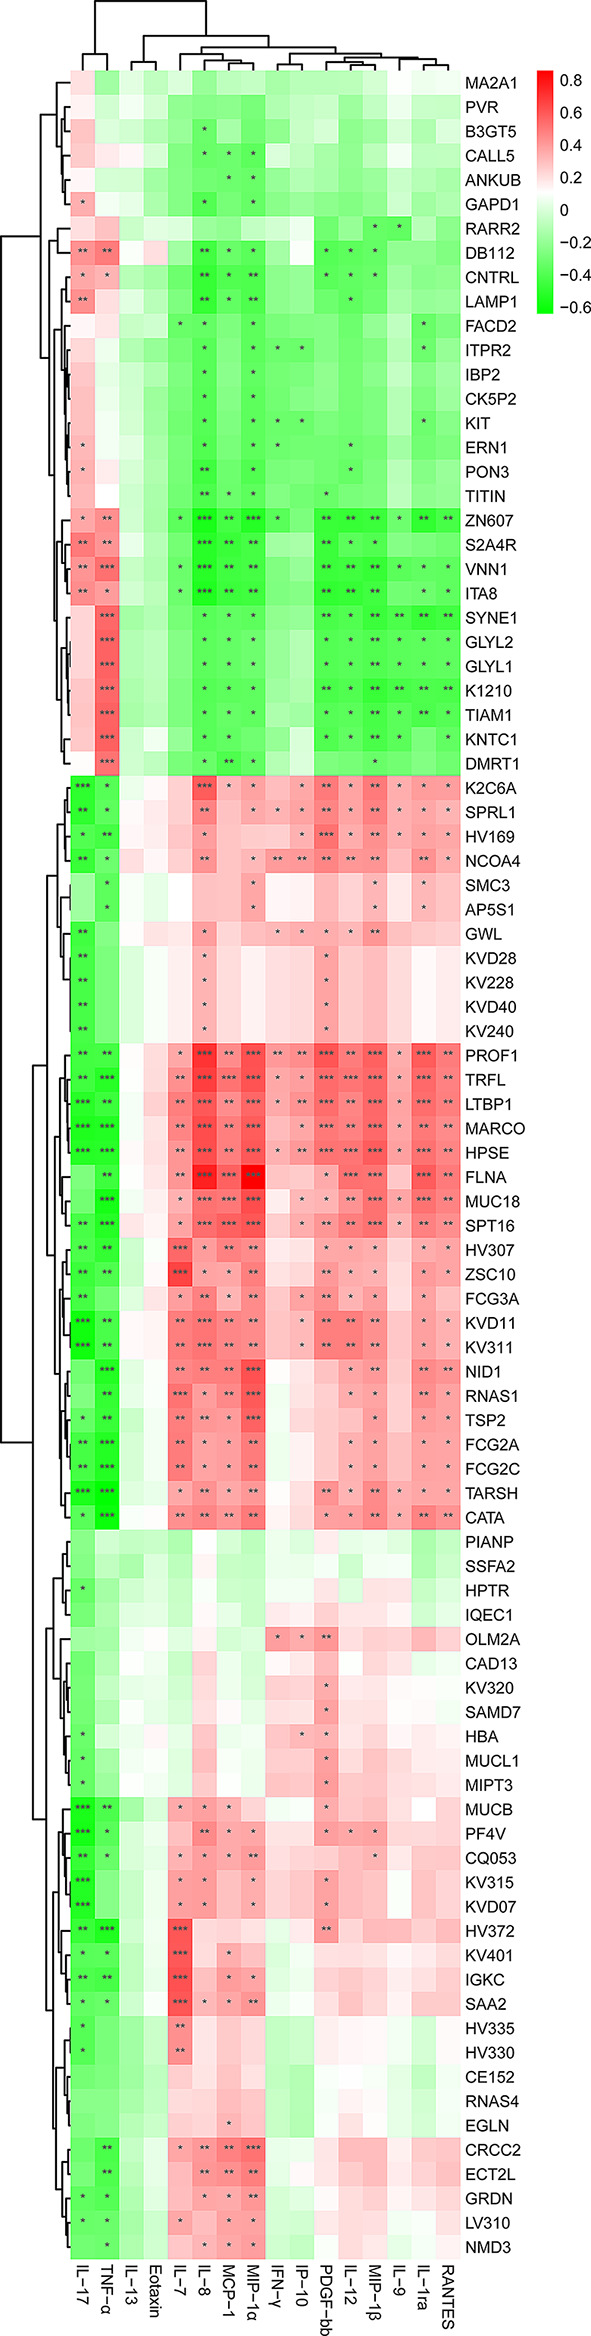
Significant correlation between DEPs and differentially expressed cytokines and chemokines in MS-affected patients. The heatmap was plotted by using Pearson’s correlation analysis. The correlation coefficient was visualized by red and green, which denoting positive and negative correlations, respectively. Asterisks represent significant correlations. The Benjamini-Hochberg method was used to correct P value. *Padj < 0.05, **Padj < 0.01, ***Padj < 0.001
We also observed strong and significant correlations between certain DEPs and the concentrations of inflammation-regulating mediators. For instance, the level of LAMP1 was significantly and positively correlated with abundantly elevated IL-17 (r = 0.4292; Padj = 5.714e-03), while it was negatively associated with down-regulated anti-inflammatory factors, such as IL-8 (r = -0.4773; Padj = 1.844e-03), MCP-1 (r = -0.3497; Padj = 2.695e-02), MIP-1α (r = -0.4061; Padj = 9.317e-03), and IL-12 (r = -0.3585; Padj = 2.313e-02) (Fig. 9A). The level of ERN1 was significantly and positively correlated with increased level of IL-17 (r = 0.3145; Padj = 4.812e-02), whereas it was markedly and negatively associated with abundantly decreased chemokines, such as IL-8 (r = -0.3953; Padj = 1.157e-02), MIP-1α (r = -0.3604; Padj = 2.234e-02), IFN-γ (r = -0.3152; Padj = 4.756e-02), and IL-12 (r = -0.3167; Padj = 4.648e-02) (Fig. 9B). Conversely, the level of FLNA was significantly and negatively correlated with changes in TNF-α level (r = -0.4581; Padj = 2.954e-03), however, it was distinctly and positively correlated with altered concentrations of IL-7 (r = 0.4167; Padj = 7.482e-03), IL-8 (r = 0.7588; Padj = 1.400e-08), IL-12 (r = 0.5284; Padj = 4.572e-04), and MIP-1β (r = 0.5153; Padj = 6.667e-04) (Fig. 9C). Also, the level of FCG2A was significantly and negatively correlated with altered concentrations of pro-inflammatory factors IL-17 (r = -0.4316; Padj = 5.419e-03) and TNF-α (r = -0.5302; Padj = 4.333e-04), though, it was positively associated with altered levels of IL-7 (r = 0.4893; Padj = 1.354e-03), IL-8 (r = 0.3773; Padj = 1.640e-02), and MIP-1α (r = 0.4896; Padj = 1.344e-03) (Fig. 9D). These results suggest that a potential immunoproteomic network may be contributing to the immune and inflammatory responses that occur in the peripheral system of MS-affected patients.
Fig. 9.

Levels of LAMP1, ERN1, FLNA, and FCG2A significantly correlated with pro- and anti-inflammatory factors concentrations. (A) Correlations between the level of LAMP1 and the concentrations of IL-17, IL-8, MCP-1, MIP-1α, and IL-12. (B) Correlations between the levels of ERN1 and the levels of IL-17, IL-8, MIP-1α, IFN-γ, and IL-12. (C) Associations between the content of FLNA and the amounts of TNF-α, IL-7, IL-8, IL-12, and MIP-1β. (D) Interactions between the amount of FCG2A and the levels of IL-17, TNF-α, IL-7, IL-8, and MIP-1α. Pearson’s correlation (r) and probability (p) were used for evaluating the statistical importance. 95% confidence interval (CI) was suggested by the gray area surrounding blue straight line
The correlation of proteomic profile with gut microbiome in MS
To explore the underlying relationship between the altered proteomic profile and the overall alterations of the gut microbiome in MS patients, Pearson’s correlation analysis was performed. Multiple statistical analyses showed that the variables of gut microbiome were normally distributed (P > 0.05) (Fig. S10), allowing us to proceed with Pearson’s correlation analysis. A previous study suggested that the levels of multiple microbes such as Roseburia and Gemella, were significantly decreased in MS-affected patients compared with that of healthy controls [93]. In the current study, we found that changes in the proteomic profile extensively interacted with the gut microbiome in MS-affected patients (Fig. 10). For example, up-regulated proteins such as ITA8 and CNTRL were negatively correlated with the levels of Roseburia (Padj < 0.05), and positively associated with the levels of Collinsella (Fig. 10). The altered levels of S2A4R and VNN1 were also significantly and negatively correlated with the levels of Roseburia and Sphingomonadales (Padj < 0.05), whereas they were significantly and positively correlated with the levels of Lactobacillus and Salivarius (Padj < 0.05) (Fig. 10).
Fig. 10.
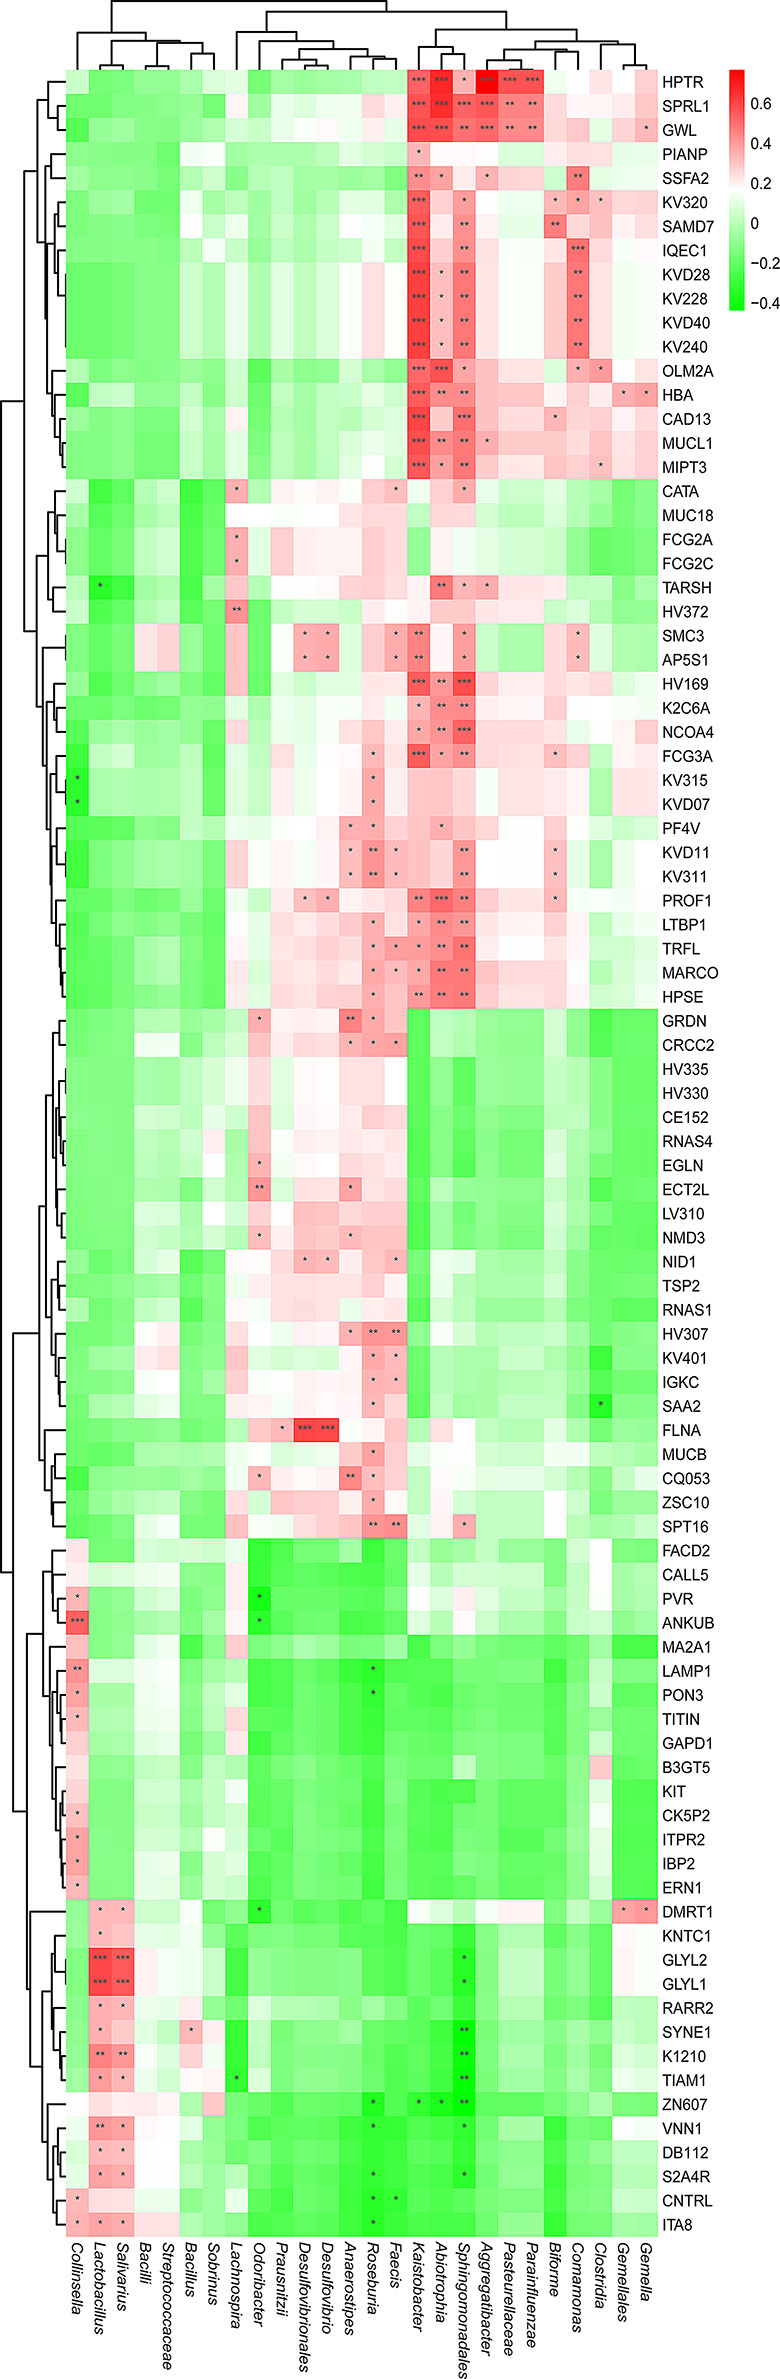
Significant correlation between DEPs and abundantly differential gut microbial species in MS-affected patients. The heatmap was plotted by using Pearson’s correlation analysis. The correlation coefficient was visualized by red and green, denoting positive and negative correlations, respectively. Asterisks represent significant correlations. The Benjamini-Hochberg method was used to correct P value. *Padj < 0.05, **Padj < 0.01, ***Padj < 0.001
We also observed significant correlations between certain DEPs and significantly altered microbes. For instance, the levels of MUCL1 were significantly and positively correlated with the levels of Kaistobacter (r = 0. 5805; Padj = 8.613e-05), Abiotrophia (r = 0. 4374; Padj = 4.766e-03), Sphingomonadales (r = 0. 4807; Padj = 1.693e-03), and Aggregatibacter (r = 0. 3542; Padj = 2.494e-02), as well as the level of FCG2A and Lachnospira (r = 0. 3497; Padj = 2.698e-02) (Fig. S11A). Similarly, a significant and positive correlation was observed between the altered level of FCG3A and the levels of Roseburia (r = 0. 3270; Padj = 3.943e-02), Kaistobacter (r = 0. 5428; Padj = 2.958e-04), Abiotrophia (r = 0. 3821; Padj = 1.498e-02), Sphingomonadales (r = 0. 4256; Padj = 6.177e-03), and Biforme (r = 0. 3169; Padj = 4.634e-02) (Fig. S11B), though a previous study suggested that changes in Kaistobacter, Abiotrophia, Sphingomonadales, Aggregatibacter, and Lachnospira levels were not obvious [93]. In addition, the level of SAA2 was significantly and positively correlated with the level of Roseburia (r = 0. 3299; Padj = 3.761e-02), while it was negatively correlated with the level of Clostridia (r = -0. 3379; Padj = 3.295e-02) (Fig. S11C). Also, the level of FLNA was positively and significantly correlated with the levels of Prausnitzii (r = 0. 3264; Padj = 3.984e-02), Desulfovibrionales (r = 0. 5993; Padj = 4.382e-05), and Desulfovibrio (r = 0. 5943; Padj = 5.267e-05) (Fig. S11C), Unlike SAA2, the level of LAMP1 was positively and negatively correlated with the levels of Collinsella (r = 0. 4218; Padj = 6.706e-03) and Roseburia (r = -0. 3306; Padj = 3.718e-02), respectively, whereas the level of ERN1 and HBA were also positively and significantly correlated with the levels of Collinsella (r = 0. 3287; Padj = 3.834e-02), Kaistobacter (r = 0.5501; Padj = 2.358e-04) and Abiotrophia (r = 0.4360; Padj = 4.922e-03), respectively (Fig. S11D). Interestingly, we also observed tight associations between metabolic profile and the gut microbiome in MS (Fig. S12). For example, highly decreased levels of Roseburia were significantly and positively correlated with the concentrations of L-isoleucine, myo-inositol, 17a-estradiol, and homovanillic acid (Padj < 0.05), while they negatively correlated with the levels of spermidine and O-phosphoethanolamine (Fig. S12). In contrast to Roseburia, Gemella and Gemellales showed significantly positive correlations with the levels of isocitric acid (Padj < 0.001), and significantly negative correlations with the levels of arachidonic acid (Padj < 0.05) (Fig. S12). A strong and positive interaction was also observed between Kaistobacter, Comamonas, and dodecanoic acid, acetylphosphate (Padj < 0.001), as well as sphingomonadales and acetylphosphate, nicotinuric acid (Padj < 0.001) (Fig. S12). These results suggest the underlying molecular networks between the plasma proteomics, metabolic and gut microbial profiles in MS-affected Chinese patients, which might promote gut microbe-mediated immuno-inflammatory responses in the peripheral system, thereby maintaining the etiopathology and course of MS.
Discussion
Increasing evidence indicates that the landscape of plasma and CSF proteomics change significantly in MS-affected patients compared to healthy controls, and that there are some potential biomarkers that may be diagnostic for MS [16, 29, 32, 34, 37, 42, 46, 59, 62, 68, 101]. However, except for the oligoclonal bands and immunoglobulin G, no reliable biomarker for MS has been uncovered and clinically applied due to its complex pathology and various ethnic backgrounds, particularly in MS-affected Chinese populations. Therefore, it is very urgent to search for more reliable biomarkers for the early diagnosis of Chinese patients with MS (CpwMS). Besides, proteomic methodology has been used to evaluate the therapeutic effects of MS drugs [102, 103]. Given the pathophysiological complexities and diverse risk factors, the proteomics method has been combined with multi-omics analysis to investigate the potential mechanisms of MS pathogenesis [47–53].
In this study, we applied TMT labeling quantitative UPLC-MS/MS approach to uncover the global changes of plasma proteomics profile in MS-affected Chinese patients, and identify several potentially novel biomarkers for the diagnosis of MS. Through a standardized analysis process, a total of 90 DEPs, including 29 up-regulated and 61 down-regulated DEPs, were identified in MS patients compared with healthy controls, such as significantly decreased HPSE and increased S2A4R (Fig. 3). Gene ontology and KEGG pathway enrichment analysis suggested that the DEPs were primarily involved in the biological processes of molecular mediator production of immune response, immunoglobulin production, antimicrobial humoral response, and humoral immune response (Fig. 5A), suggesting a potential role of these DEPs in the etiology of MS. Moreover, some candidate biomarkers for MS diagnosis were also identified (Fig. 4), which may have future clinical applications.
Furthermore, the latent relationships between the altered profiles of the plasma proteomics and those of other multi-omics were also explored. We found the underlying molecular networks consisting of proteomics, metabolome, and gut microbiome that are likely influencing the immunoinflammatory responses and etiopathogenesis of MS. High levels of the representative protein LAMP1 levels not only significantly interacted with the amount of various MS-related metabolites, such as L-glutamic acid, L-tyrosine, and sphingosine 1-phosphate (Padj < 0.05) (Fig. 7A), but also strongly correlated with multiple immunoinflammatory mediators, including IL-17, IL-8, and MIP-1α (Fig. 9A). LAMP1 was also positively and negatively correlated with the high levels of Collinsella and Roseburia, respectively (Fig. S4D). In addition, the altered levels of protein FCG2A was significantly correlated with the decreased levels of L-isoleucine, sphingosine 1-phosphate, and sphinganine 1-phosphate (Padj < 0.05) (Fig. 7D), as well as levels of multiple pro-inflammatory and anti-inflammatory factors, such as IL-17, TNF-α, IL-7, IL-8, and MIP-1α (Padj < 0.05) (Fig. 9D). Interestingly, FCG3A tightly interacted with the levels of various microbial species, including Roseburia, Kaistobacter, Abiotrophia, Sphingomonadales, and Biforme (Fig. S4B). Taken together, these results highlight the presence of multi-dimensional regulatory frameworks in MS physiopathology, and imply a potential role of LAMP1 and FCG2A/FCG3A proteins as MS-specific biomarkers.
Previous studies have suggested that the humoral immune response is tightly associated with MS pathology [104–108]. Interestingly, our study also identified humoral immune response and antimicrobial humoral response among the top-ranking enriched biological processes (Fig. 5A), where LTF and PF4V proteins might play a potential role in the pathophysiology of MS. Besides, PPI analysis results showed strong and compact interactions between several well-known MS-associated proteins, including FLNA, LAMP1, FCG2A, FCG3A, and ERN1 (Fig. S3A), implying underlying connections between autophagy, Fc gamma receptors-mediated immune responses, and unfolded protein response (UPR) in the endoplasmic reticulum, as well as potentially pathological cues, in the physiopathology of MS. Particularly, a recent study reported that IRE1α (ERN1)-XBP1 signaling was activated in MS astrocytes, and the activation of IRE1α-XBP1 signaling enhanced CNS inflammation in experimental autoimmune encephalomyelitis (EAE) model [109]. The up-regulated circulating levels of ERN1 were likely involved in the aggravation of immunoinflammatory responses and MS progression.
An increasing number of studies have demonstrated that heparanase (HPSE) plays a potential role in the pathology of MS [110–114], in addition to its well-known role in tumor metastasis [115–117], leukocyte infiltration [114, 118, 119], and inflammation [120–123]. A previous study indicated a high expression level of HPSE in CD4 + T cells infiltrating the CNS in the model of EAE [114]. Also, the overexpression of HPSE was observed in active neurogliocytes such as microglia and astrocytes [124–126]. In the present study, we observed a drastic reduction of HPSE level in the plasma of CpwMS compared to that of HCs (Fig. 3). Interestingly, HPSE was significantly and positively correlated with multiple MS-relevant metabolites, includes L-tyrosine, sphingosine 1-phosphate, sphinganine 1-phosphate, and L-tryptophan (Padj < 0.05) (Fig. 6). Besides, HPSE was negatively correlated with pro-inflammatory mediators like IL-17 and TNF-α, and positively interacted with anti-inflammatory factors such as IL-7 and IL-8 (Fig. 8). We also observed significant correlations of HPSE with various microbial species, including Roseburia, Kaistobacter, Abiotrophia, and Sphingomonadales (Padj < 0.05) (Fig. 10). These results suggest that HPSE might play an essential role in promoting the development of immunoinflammatory responses in the peripheral system, even facilitating the migration of lymphocytes across the BBB and leukocyte trafficking into the CNS, which accelerate the onset and progression of MS and maintain the course of the disease.
The present study has some limitations. First, the sample sizes of the MS-affected patients and healthy controls were small, which might give results that are not representative enough, without further validation assays. Second, the validation of the independent cohort was absent from the current study, hence, it is essential to validate representative candidate biomarkers in the next study to confirm the reliable biomarkers for CpwMS. Third, the study identified only potential molecular networks between proteomics and multi-omics profiles, without providing detailed mechanisms of the crosstalk between specific proteins with particular metabolites, microbes, as well as immune-inflammatory mediators. Therefore, functional studies in vitro and in animal models of MS are needed to demonstrate the relevance of certain proteins and metabolite molecules as diagnostic markers of MS, as well as to establish a reliable relationship between protein- and metabolite-based signature and the immuno-inflammatory response. Such studies will provide more insights into the fundamental basis of multi-omics integrated networks involvement in the pathogenesis of MS.
Conclusions
This study highlights some of the overall changes in the proteomic profiles in the peripheral system of Chinese MS patients, while identifying candidate plasma protein-based signatures for MS. Several potentially pathological molecular networks between proteomics and multi-omics profiles were also outlined in the circulatory system of MS patients. These have the potential to jointly boost pro-inflammatory responses and promote inflammation trafficking into the CNS. These findings offer promising clues for the clinical diagnosis of MS and potential therapeutic directions.
Electronic supplementary material
Below is the link to the electronic supplementary material.
Acknowledgements
We thank all participants, including patients with multiple sclerosis and healthy controls, for their involvement in this study. We also sincerely thanks Dr. Qian-zhen Yang (Bio-X Institutes, Shanghai Jiao Tong University) for his kindly help in processing and analyzing proteomics raw data.
Abbreviations
- BBB
Blood-brain barrier
- BH
Benjamini and Hochberg’s procedure
- BMI
Body mass index
- CNS
Central nervous system
- CNTRL
Centriolin
- CpwMS
Chinese patients with MS
- CSF
Cerebrospinal fluid
- DAMs
Differentially abundant metabolites
- DDA
Data-dependent acquisition
- DEPs
Differentially expressed proteins
- EAE
Experimental autoimmune encephalomyelitis
- ERN1
Endoplasmic reticulum to nucleus signaling 1, also known as IRE1α
- FASP
Filter-aided sample preparation
- FCG2A
Fc gamma receptor IIa, also known as FCGR2A, and CD32
- FCG2C
Fc gamma receptor IIc, also known as FCGR2C, and CD32C
- FCG3A
Fc gamma receptor IIIa, also known as FCGR3A, and CD16
- FLNA
Filamin A
- GO
Gene ontology
- HCs
Healthy controls
- HPSE
Heparanase
- IFN-γ
Interferon gamma-γ
- IgG
Immunoglobulin G
- IL-17
Interleukin-17
- IL-1ra
IL-1 receptor antagonist protein
- IP-10
Interferon gamma-inducible protein-10
- MARCO
Macrophage receptor with collagenous structure
- MCP-1
Monocyte chemotactic protein-1
- MIP-1α
Macrophage inflammatory protein-1α
- MIP-1β
Macrophage inflammatory protein-1β
- MSIF
Multiple sclerosis international federation
- KEGG
Kyoto encyclopedia of genes and genomes
- LAMP1
Lysosomal associated membrane protein 1
- LTBP1
Latent transforming growth factor beta binding protein 1
- MS
Multiple sclerosis
- OPLS-DA
Orthogonal partial least squares-discriminant analysis
- PCA
Principal component analysis
- PDGF-bb
Platelet-derived growth factor beta polypeptide b
- PLS-DA
Partial least squares-discriminant analysis
- PPI
Protein-protein interaction
- PPMS
Primary progressive multiple sclerosis
- PROF1
Profilin 1
- RANTES
Regulated upon activation normal T-cell expressed and secreted
- RRMS
Relapsing-remitting multiple sclerosis
- S2A4R
Solute carrier family 2 member 4 regulator
- TMT
Tandem mass tag
- TNF-α
Tumor necrosis factor-α
- UPLC
Ultra-performance liquid chromatography
- UPR
Unfolded protein response
- VNN1
Vanin 1, also known as HDLCQ8
Author contributions
F. Y.: conceptualization, validation, formal analysis, investigation, data curation, writing-original draft, visualization, project administration, and funding acquisition. L.Y. Z.: methodology, software, formal analysis, investigation, resources, writing-review & editing, and funding acquisition. W.Q. Y.: methodology, software, validation, formal analysis, investigation, and data curation. S.C.: methodology, software, formal analysis, data curation, and visualization. Z.X. L.: methodology, software, investigation, and resources. B.Y. S. and L.P. W.: methodology, software, and validation. L.J. Z.: methodology, software, and resources. L.M. Y. and G.Y. C.: conceptualization, investigation, data curation, writing-review & editing, supervision, and project administration. All authors contributed to the article, and all authors reviewed and approved the final manuscript.
Funding
This study was funded by grants from the Basic Research Program of Guizhou Province (grant no. QianKeHe Basics-ZK [2023] General 583), the S&T Major Project of Lishui City (grant no. 2017ZDYF15), and the Project of Development Center for Medical Science & Technology, National Health Commission of the PRC (grant no. WKZX2022JG0105). The funding body has no role in designing the study, sampling, and interpretation of data and in writing the manuscript.
Data availability
The mass spectrometry proteomics data have been deposited to the ProteomeXchange Consortium via the PRIDE partner repository with the dataset identifier of accession number PXD040101 and DOI 10.6019/PXD040101. Further inquiries can be directed to the corresponding authors.
Declarations
Ethic approval and consent to participate
The studies involving human participants were reviewed and approved by the Ethics Committee of Lishui Second People’s Hospital (Approval number 20171116-3). All research was performed in accordance with the Declaration of Helsinki. All participants provided their written informed consent to participate in this study.
Consent for publication
Not applicable.
Competing interests
The authors declare no competing interests.
Footnotes
Publisher’s note
Springer Nature remains neutral with regard to jurisdictional claims in published maps and institutional affiliations.
Fan Yang, Long-You Zhao and Wen-Qi Yang contributed equally to this work.
Contributor Information
Fan Yang, Email: yangfan@sibs.ac.cn.
Li-Mei Yu, Email: ylm720@sina.com.
Guang-Yong Cai, Email: cgy0725@163.com.
References
- 1.Reich DS, Lucchinetti CF, Calabresi PA. Multiple Scler N Engl J Med. 2018;378(2):169–80. [DOI] [PMC free article] [PubMed] [Google Scholar]
- 2.Yong H, Chartier G, Quandt J. Modulating inflammation and neuroprotection in multiple sclerosis. J Neurosci Res. 2018;96(6):927–50. [DOI] [PubMed] [Google Scholar]
- 3.Sospedra M, Martin R. Immunology of multiple sclerosis. Annu Rev Immunol. 2005;23:683–747. [DOI] [PubMed] [Google Scholar]
- 4.Walton C, et al. Rising prevalence of multiple sclerosis worldwide: insights from the Atlas of MS, third edition. Mult Scler. 2020;26(14):1816–21. [DOI] [PMC free article] [PubMed] [Google Scholar]
- 5.das Neves SP, et al. Altered astrocytic function in experimental neuroinflammation and multiple sclerosis. Glia. 2021;69(6):1341–68. [DOI] [PubMed] [Google Scholar]
- 6.International Multiple Sclerosis Genetics. C., Multiple sclerosis genomic map implicates peripheral immune cells and microglia in susceptibility. Science, 2019. 365(6460). [DOI] [PMC free article] [PubMed]
- 7.Genetics IMS. Genetic risk and a primary role for cell-mediated immune mechanisms in multiple sclerosis. Nature. 2011;476(7359):214–9. [DOI] [PMC free article] [PubMed] [Google Scholar]
- 8.Genetics IMS. Risk alleles for multiple sclerosis identified by a genomewide study. N Engl J Med. 2007;357(9):851–62. [DOI] [PubMed] [Google Scholar]
- 9.Ramanujam R, et al. Effect of Smoking Cessation on multiple sclerosis prognosis. JAMA Neurol. 2015;72(10):1117–23. [DOI] [PubMed] [Google Scholar]
- 10.Ascherio A, et al. Vitamin D as an early predictor of multiple sclerosis activity and progression. JAMA Neurol. 2014;71(3):306–14. [DOI] [PMC free article] [PubMed] [Google Scholar]
- 11.Olsson T, Barcellos LF, Alfredsson L. Interactions between genetic, lifestyle and environmental risk factors for multiple sclerosis. Nat Rev Neurol. 2017;13(1):25–36. [DOI] [PubMed] [Google Scholar]
- 12.Marrie RA. Environmental risk factors in multiple sclerosis aetiology. Lancet Neurol. 2004;3(12):709–18. [DOI] [PubMed] [Google Scholar]
- 13.Kaufmann M, et al. Identification of early neurodegenerative pathways in progressive multiple sclerosis. Nat Neurosci. 2022;25(7):944–55. [DOI] [PubMed] [Google Scholar]
- 14.Sen MK et al. Proteomics of multiple sclerosis: inherent issues in defining the pathoetiology and identifying (early) biomarkers. Int J Mol Sci, 2021. 22(14). [DOI] [PMC free article] [PubMed]
- 15.De Masi R, et al. The clinical potential of blood-proteomics in multiple sclerosis. BMC Neurol. 2013;13:45. [DOI] [PMC free article] [PubMed] [Google Scholar]
- 16.Cappelletti C, et al. Quantitative proteomics reveals protein dysregulation during T cell activation in multiple sclerosis patients compared to healthy controls. Clin Proteom. 2022;19(1):23. [DOI] [PMC free article] [PubMed] [Google Scholar]
- 17.Avsar T, et al. CSF proteomics identifies Specific and Shared pathways for multiple sclerosis clinical subtypes. PLoS ONE. 2015;10(5):e0122045. [DOI] [PMC free article] [PubMed] [Google Scholar]
- 18.Singh V, Tripathi A, Dutta R. Proteomic approaches to Decipher mechanisms underlying pathogenesis in multiple sclerosis patients. Proteomics. 2019;19(16):e1800335. [DOI] [PMC free article] [PubMed] [Google Scholar]
- 19.Fiorini A, et al. Involvement of oxidative stress in occurrence of relapses in multiple sclerosis: the spectrum of oxidatively modified serum proteins detected by proteomics and redox proteomics analysis. PLoS ONE. 2013;8(6):e65184. [DOI] [PMC free article] [PubMed] [Google Scholar]
- 20.Mosleth EF, et al. Cerebrospinal fluid proteome shows disrupted neuronal development in multiple sclerosis. Sci Rep. 2021;11(1):4087. [DOI] [PMC free article] [PubMed] [Google Scholar]
- 21.Elkabes S, Li H. Proteomic strategies in multiple sclerosis and its animal models. Proteom Clin Appl. 2007;1(11):1393–405. [DOI] [PMC free article] [PubMed] [Google Scholar]
- 22.Satoh JI, Tabunoki H, Yamamura T. Molecular network of the comprehensive multiple sclerosis brain-lesion proteome. Mult Scler. 2009;15(5):531–41. [DOI] [PubMed] [Google Scholar]
- 23.Rai NK, et al. Comparative proteomic profiling identifies reciprocal expression of mitochondrial proteins between White and Gray Matter lesions from multiple sclerosis brains. Front Neurol. 2021;12:779003. [DOI] [PMC free article] [PubMed] [Google Scholar]
- 24.Wallin MT, et al. Serum proteomic analysis of a pre-symptomatic multiple sclerosis cohort. Eur J Neurol. 2015;22(3):591–9. [DOI] [PubMed] [Google Scholar]
- 25.Han MH, et al. Proteomic analysis of active multiple sclerosis lesions reveals therapeutic targets. Nature. 2008;451(7182):1076–81. [DOI] [PubMed] [Google Scholar]
- 26.Magliozzi R, et al. Iron homeostasis, complement, and coagulation cascade as CSF signature of cortical lesions in early multiple sclerosis. Ann Clin Transl Neurol. 2019;6(11):2150–63. [DOI] [PMC free article] [PubMed] [Google Scholar]
- 27.Lourenco AS, et al. Proteomics-based technologies in the discovery of biomarkers for multiple sclerosis in the cerebrospinal fluid. Curr Mol Med. 2011;11(4):326–49. [DOI] [PubMed] [Google Scholar]
- 28.Singh V, et al. Proteomics technologies for biomarker discovery in multiple sclerosis. J Neuroimmunol. 2012;248(1–2):40–7. [DOI] [PubMed] [Google Scholar]
- 29.Kroksveen AC, et al. Cerebrospinal fluid proteomics in multiple sclerosis. Biochim Biophys Acta. 2015;1854(7):746–56. [DOI] [PubMed] [Google Scholar]
- 30.Huang J, et al. Inflammation-related plasma and CSF biomarkers for multiple sclerosis. Proc Natl Acad Sci U S A. 2020;117(23):12952–60. [DOI] [PMC free article] [PubMed] [Google Scholar]
- 31.Dagley LF, Emili A, Purcell AW. Application of quantitative proteomics technologies to the biomarker discovery pipeline for multiple sclerosis. Proteom Clin Appl. 2013;7(1–2):91–108. [DOI] [PubMed] [Google Scholar]
- 32.Tremlett H, et al. Serum proteomics in multiple sclerosis disease progression. J Proteom. 2015;118:2–11. [DOI] [PubMed] [Google Scholar]
- 33.Malekzadeh A, et al. Plasma proteome in multiple sclerosis disease progression. Ann Clin Transl Neurol. 2019;6(9):1582–94. [DOI] [PMC free article] [PubMed] [Google Scholar]
- 34.Fitzner B, Hecker M, Zettl UK. Molecular biomarkers in cerebrospinal fluid of multiple sclerosis patients. Autoimmun Rev. 2015;14(10):903–13. [DOI] [PubMed] [Google Scholar]
- 35.Stoop MP, et al. Proteomics comparison of cerebrospinal fluid of relapsing remitting and primary progressive multiple sclerosis. PLoS ONE. 2010;5(8):e12442. [DOI] [PMC free article] [PubMed] [Google Scholar]
- 36.Chase Huizar C, Raphael I, Forsthuber TG. Genomic, proteomic, and systems biology approaches in biomarker discovery for multiple sclerosis. Cell Immunol. 2020;358:104219. [DOI] [PMC free article] [PubMed] [Google Scholar]
- 37.Bedri SK, et al. Plasma protein profiling reveals candidate biomarkers for multiple sclerosis treatment. PLoS ONE. 2019;14(5):e0217208. [DOI] [PMC free article] [PubMed] [Google Scholar]
- 38.Salazar IL, et al. Posttranslational modifications of proteins are key features in the identification of CSF biomarkers of multiple sclerosis. J Neuroinflammation. 2022;19(1):44. [DOI] [PMC free article] [PubMed] [Google Scholar]
- 39.O’Connor KC, et al. Comprehensive phenotyping in multiple sclerosis: discovery based proteomics and the current understanding of putative biomarkers. Dis Markers. 2006;22(4):213–25. [DOI] [PMC free article] [PubMed] [Google Scholar]
- 40.Harris VK, Sadiq SA. Disease biomarkers in multiple sclerosis: potential for use in therapeutic decision making. Mol Diagn Ther. 2009;13(4):225–44. [DOI] [PubMed] [Google Scholar]
- 41.Amin B, et al. New poteintial serum biomarkers in multiple sclerosis identified by proteomic strategies. Curr Med Chem. 2014;21(13):1544–56. [DOI] [PubMed] [Google Scholar]
- 42.Liguori M, et al. Proteomic profiling in multiple sclerosis clinical courses reveals potential biomarkers of neurodegeneration. PLoS ONE. 2014;9(8):e103984. [DOI] [PMC free article] [PubMed] [Google Scholar]
- 43.Komori M, et al. Proteomic pattern analysis discriminates among multiple sclerosis-related disorders. Ann Neurol. 2012;71(5):614–23. [DOI] [PubMed] [Google Scholar]
- 44.Bystrom S, et al. Affinity proteomic profiling of plasma, cerebrospinal fluid, and brain tissue within multiple sclerosis. J Proteome Res. 2014;13(11):4607–19. [DOI] [PubMed] [Google Scholar]
- 45.Sakurai T, et al. Identification of antibodies as biological markers in serum from multiple sclerosis patients by immunoproteomic approach. J Neuroimmunol. 2011;233(1–2):175–80. [DOI] [PubMed] [Google Scholar]
- 46.Colomba P, et al. Identification of biomarkers in cerebrospinal fluid and serum of multiple sclerosis patients by immunoproteomics approach. Int J Mol Sci. 2014;15(12):23269–82. [DOI] [PMC free article] [PubMed] [Google Scholar]
- 47.Probert F, et al. Integrative biochemical, proteomics and metabolomics cerebrospinal fluid biomarkers predict clinical conversion to multiple sclerosis. Brain Commun. 2021;3(2):fcab084. [DOI] [PMC free article] [PubMed] [Google Scholar]
- 48.Miedema A, et al. High-resolution transcriptomic and proteomic profiling of heterogeneity of brain-derived Microglia in multiple sclerosis. Front Mol Neurosci. 2020;13:583811. [DOI] [PMC free article] [PubMed] [Google Scholar]
- 49.Kotelnikova E, et al. MAPK pathway and B cells overactivation in multiple sclerosis revealed by phosphoproteomics and genomic analysis. Proc Natl Acad Sci U S A. 2019;116(19):9671–6. [DOI] [PMC free article] [PubMed] [Google Scholar]
- 50.Cicalini I et al. Integrated Lipidomics and Metabolomics Analysis of Tears in multiple sclerosis: an insight into diagnostic potential of Lacrimal Fluid. Int J Mol Sci, 2019. 20(6). [DOI] [PMC free article] [PubMed]
- 51.Qendro V et al. Integrative proteomics, genomics, and translational immunology approaches reveal mutated forms of Proteolipid Protein 1 (PLP1) and mutant-specific immune response in multiple sclerosis. Proteomics, 2017. 17(6). [DOI] [PubMed]
- 52.Del Boccio P, et al. Integration of metabolomics and proteomics in multiple sclerosis: from biomarkers discovery to personalized medicine. Proteom Clin Appl. 2016;10(4):470–84. [DOI] [PubMed] [Google Scholar]
- 53.Villoslada P, Baranzini S. Data integration and systems biology approaches for biomarker discovery: challenges and opportunities for multiple sclerosis. J Neuroimmunol. 2012;248(1–2):58–65. [DOI] [PubMed] [Google Scholar]
- 54.Abbott NJ, et al. Structure and function of the blood-brain barrier. Neurobiol Dis. 2010;37(1):13–25. [DOI] [PubMed] [Google Scholar]
- 55.Campos-Bedolla P, et al. Role of the blood-brain barrier in the nutrition of the central nervous system. Arch Med Res. 2014;45(8):610–38. [DOI] [PubMed] [Google Scholar]
- 56.Correale J, Fiol M. Chitinase effects on immune cell response in neuromyelitis optica and multiple sclerosis. Mult Scler. 2011;17(5):521–31. [DOI] [PubMed] [Google Scholar]
- 57.Lycke J, Zetterberg H. The role of blood and CSF biomarkers in the evaluation of new treatments against multiple sclerosis. Expert Rev Clin Immunol. 2017;13(12):1143–53. [DOI] [PubMed] [Google Scholar]
- 58.Ottervald J, et al. Multiple sclerosis: identification and clinical evaluation of novel CSF biomarkers. J Proteom. 2010;73(6):1117–32. [DOI] [PubMed] [Google Scholar]
- 59.Kroksveen AC, et al. Quantitative proteomics suggests decrease in the secretogranin-1 cerebrospinal fluid levels during the disease course of multiple sclerosis. Proteomics. 2015;15(19):3361–9. [DOI] [PubMed] [Google Scholar]
- 60.Stoop MP, et al. Multiple sclerosis-related proteins identified in cerebrospinal fluid by advanced mass spectrometry. Proteomics. 2008;8(8):1576–85. [DOI] [PubMed] [Google Scholar]
- 61.Comabella M et al. CSF chitinase 3-Like 2 is Associated with Long-Term disability progression in patients with Progressive multiple sclerosis. Neurol Neuroimmunol Neuroinflamm, 2021. 8(6). [DOI] [PMC free article] [PubMed]
- 62.Liu H, et al. Label-free quantitative proteomic analysis of Cerebrospinal Fluid and serum in patients with relapse-remitting multiple sclerosis. Front Genet. 2022;13:892491. [DOI] [PMC free article] [PubMed] [Google Scholar]
- 63.Dumont D, et al. Proteomic analysis of cerebrospinal fluid from multiple sclerosis patients. Proteomics. 2004;4(7):2117–24. [DOI] [PubMed] [Google Scholar]
- 64.Kroksveen AC, Guldbrandsen A, Vedeler C, Myhr KM, Opsahl JA, Berven FS. Cerebrospinal fluid proteome comparison between multiple sclerosis patients and controls. Acta Neurol Scand Suppl. 2012;126(Suppl. 195):90–6. [DOI] [PubMed]
- 65.Lehmensiek V, et al. Cerebrospinal fluid proteome profile in multiple sclerosis. Mult Scler. 2007;13(7):840–9. [DOI] [PubMed] [Google Scholar]
- 66.Stoop MP, et al. Decreased neuro-axonal proteins in CSF at First Attack of suspected multiple sclerosis. Proteom Clin Appl. 2017;11:11–2. [DOI] [PubMed] [Google Scholar]
- 67.Hammack BN, et al. Proteomic analysis of multiple sclerosis cerebrospinal fluid. Mult Scler. 2004;10(3):245–60. [DOI] [PubMed] [Google Scholar]
- 68.Jankovska E, et al. Quantitative proteomic analysis of cerebrospinal fluid of women newly diagnosed with multiple sclerosis. Int J Neurosci. 2022;132(7):724–34. [DOI] [PubMed] [Google Scholar]
- 69.Chiasserini D, et al. CSF proteome analysis in multiple sclerosis patients by two-dimensional electrophoresis. Eur J Neurol. 2008;15(9):998–1001. [DOI] [PubMed] [Google Scholar]
- 70.Hinsinger G, et al. Chitinase 3-like proteins as diagnostic and prognostic biomarkers of multiple sclerosis. Mult Scler. 2015;21(10):1251–61. [DOI] [PubMed] [Google Scholar]
- 71.Harris VK, et al. Bri2-23 is a potential cerebrospinal fluid biomarker in multiple sclerosis. Neurobiol Dis. 2010;40(1):331–9. [DOI] [PubMed] [Google Scholar]
- 72.Kroksveen AC, et al. Discovery and initial verification of differentially abundant proteins between multiple sclerosis patients and controls using iTRAQ and SID-SRM. J Proteom. 2013;78:312–25. [DOI] [PubMed] [Google Scholar]
- 73.Awad A, et al. Analyses of cerebrospinal fluid in the diagnosis and monitoring of multiple sclerosis. J Neuroimmunol. 2010;219(1–2):1–7. [DOI] [PubMed] [Google Scholar]
- 74.Khademi M, et al. Intense inflammation and nerve damage in early multiple sclerosis subsides at older age: a reflection by cerebrospinal fluid biomarkers. PLoS ONE. 2013;8(5):e63172. [DOI] [PMC free article] [PubMed] [Google Scholar]
- 75.Stangel M, et al. The utility of cerebrospinal fluid analysis in patients with multiple sclerosis. Nat Rev Neurol. 2013;9(5):267–76. [DOI] [PubMed] [Google Scholar]
- 76.Noben JP, et al. Lumbar cerebrospinal fluid proteome in multiple sclerosis: characterization by ultrafiltration, liquid chromatography, and mass spectrometry. J Proteome Res. 2006;5(7):1647–57. [DOI] [PubMed] [Google Scholar]
- 77.Liu S, et al. Quantitative proteomic analysis of the cerebrospinal fluid of patients with multiple sclerosis. J Cell Mol Med. 2009;13(8A):1586–603. [DOI] [PMC free article] [PubMed] [Google Scholar]
- 78.Meinl E, Krumbholz M, Hohlfeld R. B lineage cells in the inflammatory central nervous system environment: migration, maintenance, local antibody production, and therapeutic modulation. Ann Neurol. 2006;59(6):880–92. [DOI] [PubMed] [Google Scholar]
- 79.Filippi M, et al. Multiple sclerosis. Nat Rev Dis Primers. 2018;4(1):43. [DOI] [PubMed] [Google Scholar]
- 80.Polman CH, et al. Diagnostic criteria for multiple sclerosis: 2005 revisions to the McDonald Criteria. Ann Neurol. 2005;58(6):840–6. [DOI] [PubMed] [Google Scholar]
- 81.Ludwig KR, Schroll MM, Hummon AB. Comparison of In-Solution, FASP, and S-Trap based digestion methods for Bottom-Up proteomic studies. J Proteome Res. 2018;17(7):2480–90. [DOI] [PMC free article] [PubMed] [Google Scholar]
- 82.Perez-Riverol Y, et al. The PRIDE database resources in 2022: a hub for mass spectrometry-based proteomics evidences. Nucleic Acids Res. 2022;50(D1):D543–52. [DOI] [PMC free article] [PubMed] [Google Scholar]
- 83.Ritchie ME, et al. Limma powers differential expression analyses for RNA-sequencing and microarray studies. Nucleic Acids Res. 2015;43(7):e47. [DOI] [PMC free article] [PubMed] [Google Scholar]
- 84.Gatto L, et al. Visualization of proteomics data using R and bioconductor. Proteomics. 2015;15(8):1375–89. [DOI] [PMC free article] [PubMed] [Google Scholar]
- 85.Wu T, et al. clusterProfiler 4.0: a universal enrichment tool for interpreting omics data. Innov (Camb). 2021;2(3):100141. [DOI] [PMC free article] [PubMed] [Google Scholar]
- 86.Kanehisa M, et al. KEGG: new perspectives on genomes, pathways, diseases and drugs. Nucleic Acids Res. 2017;45(D1):D353–61. [DOI] [PMC free article] [PubMed] [Google Scholar]
- 87.Yu G, et al. clusterProfiler: an R package for comparing biological themes among gene clusters. OMICS. 2012;16(5):284–7. [DOI] [PMC free article] [PubMed] [Google Scholar]
- 88.Yu G, et al. DOSE: an R/Bioconductor package for disease ontology semantic and enrichment analysis. Bioinformatics. 2015;31(4):608–9. [DOI] [PubMed] [Google Scholar]
- 89.Szklarczyk D, et al. STRING v11: protein-protein association networks with increased coverage, supporting functional discovery in genome-wide experimental datasets. Nucleic Acids Res. 2019;47(D1):D607–13. [DOI] [PMC free article] [PubMed] [Google Scholar]
- 90.Jain A, Tuteja G. TissueEnrich: tissue-specific gene enrichment analysis. Bioinformatics. 2019;35(11):1966–7. [DOI] [PMC free article] [PubMed] [Google Scholar]
- 91.Robin X, et al. pROC: an open-source package for R and S + to analyze and compare ROC curves. BMC Bioinformatics. 2011;12:77. [DOI] [PMC free article] [PubMed] [Google Scholar]
- 92.Yang F, et al. Altered plasma metabolic profiles in Chinese patients with multiple sclerosis. Front Immunol. 2021;12:792711. [DOI] [PMC free article] [PubMed] [Google Scholar]
- 93.Ling Z, et al. Alterations of the fecal microbiota in Chinese patients with multiple sclerosis. Front Immunol. 2020;11:590783. [DOI] [PMC free article] [PubMed] [Google Scholar]
- 94.Porozhan Y et al. Defective integrator activity shapes the transcriptome of patients with multiple sclerosis. Life Sci Alliance, 2024. 7(10). [DOI] [PMC free article] [PubMed]
- 95.Salehi Z, et al. RNA sequencing of CD4(+) T cells in relapsing-remitting multiple sclerosis patients at Relapse: deciphering the involvement of novel genes and pathways. J Mol Neurosci. 2021;71(12):2628–45. [DOI] [PubMed] [Google Scholar]
- 96.Martin-Gutierrez L, et al. Dysregulated lipid metabolism networks modulate T-cell function in people with relapsing-remitting multiple sclerosis. Clin Exp Immunol. 2024;217(2):204–18. [DOI] [PMC free article] [PubMed] [Google Scholar]
- 97.Shang Z, et al. Identification of key genes associated with multiple sclerosis based on gene expression data from peripheral blood mononuclear cells. PeerJ. 2020;8:e8357. [DOI] [PMC free article] [PubMed] [Google Scholar]
- 98.Yeh WZ, et al. Transcriptomics identifies blunted immunomodulatory effects of vitamin D in people with multiple sclerosis. Sci Rep. 2024;14(1):1436. [DOI] [PMC free article] [PubMed] [Google Scholar]
- 99.Lindsey JW, Agarwal SK, Tan FK. Gene expression changes in multiple sclerosis relapse suggest activation of T and non-T cells. Mol Med. 2011;17(1–2):95–102. [DOI] [PMC free article] [PubMed] [Google Scholar]
- 100.Malhotra S, et al. NLRP3 inflammasome as prognostic factor and therapeutic target in primary progressive multiple sclerosis patients. Brain. 2020;143(5):1414–30. [DOI] [PubMed] [Google Scholar]
- 101.Shi Y, et al. Discovery of Novel biomarkers for Diagnosing and Predicting the Progression of multiple sclerosis using TMT-Based quantitative proteomics. Front Immunol. 2021;12:700031. [DOI] [PMC free article] [PubMed] [Google Scholar]
- 102.Stoop MP, et al. Effects of natalizumab treatment on the cerebrospinal fluid proteome of multiple sclerosis patients. J Proteome Res. 2013;12(3):1101–7. [DOI] [PubMed] [Google Scholar]
- 103.Nystad AE, et al. Fingolimod downregulates brain sphingosine-1-phosphate receptor 1 levels but does not promote remyelination or neuroprotection in the cuprizone model. J Neuroimmunol. 2020;339:577091. [DOI] [PubMed] [Google Scholar]
- 104.Bruijstens AL et al. Neurodegeneration and humoral response proteins in cerebrospinal fluid associate with pediatric-onset multiple sclerosis and not monophasic demyelinating syndromes in childhood. Mult Scler, 2022: p. 13524585221125369. [DOI] [PMC free article] [PubMed]
- 105.Farrell RA, et al. Humoral immune response to EBV in multiple sclerosis is associated with disease activity on MRI. Neurology. 2009;73(1):32–8. [DOI] [PMC free article] [PubMed] [Google Scholar]
- 106.Keegan M, et al. Relation between humoral pathological changes in multiple sclerosis and response to therapeutic plasma exchange. Lancet. 2005;366(9485):579–82. [DOI] [PubMed] [Google Scholar]
- 107.Lunemann JD, et al. Broadened and elevated humoral immune response to EBNA1 in pediatric multiple sclerosis. Neurology. 2008;71(13):1033–5. [DOI] [PMC free article] [PubMed] [Google Scholar]
- 108.Ziemssen T, Ziemssen F. The role of the humoral immune system in multiple sclerosis (MS) and its animal model experimental autoimmune encephalomyelitis (EAE). Autoimmun Rev. 2005;4(7):460–7. [DOI] [PubMed] [Google Scholar]
- 109.Wheeler MA, et al. Environmental Control of Astrocyte Pathogenic Activities in CNS inflammation. Cell. 2019;176(3):581–e59618. [DOI] [PMC free article] [PubMed] [Google Scholar]
- 110.Saraswat D, et al. Heparanome-mediated rescue of oligodendrocyte progenitor quiescence following inflammatory demyelination. J Neurosci. 2021;41(10):2245–63. [DOI] [PMC free article] [PubMed] [Google Scholar]
- 111.Teixeira F, Gotte M. Involvement of Syndecan-1 and Heparanase in Cancer and inflammation. Adv Exp Med Biol. 2020;1221:97–135. [DOI] [PubMed] [Google Scholar]
- 112.Changyaleket B, et al. Heparanase: potential roles in multiple sclerosis. J Neuroimmunol. 2017;310:72–81. [DOI] [PubMed] [Google Scholar]
- 113.Bitan M, et al. Heparanase upregulates Th2 cytokines, ameliorating experimental autoimmune encephalitis. Mol Immunol. 2010;47(10):1890–8. [DOI] [PMC free article] [PubMed] [Google Scholar]
- 114.de Mestre AM, et al. Expression of the heparan sulfate-degrading enzyme heparanase is induced in infiltrating CD4(+) T cells in experimental autoimmune encephalomyelitis and regulated at the level of transcription by early growth response gene. J Leukoc Biol. 2007;82(5):1289–300. [DOI] [PubMed] [Google Scholar]
- 115.Heyman B, Yang Y. Mechanisms of heparanase inhibitors in cancer therapy. Exp Hematol. 2016;44(11):1002–12. [DOI] [PMC free article] [PubMed] [Google Scholar]
- 116.Sanderson RD, et al. Heparanase regulation of cancer, autophagy and inflammation: new mechanisms and targets for therapy. FEBS J. 2017;284(1):42–55. [DOI] [PMC free article] [PubMed] [Google Scholar]
- 117.Zhang GL, et al. Significance of host heparanase in promoting tumor growth and metastasis. Matrix Biol. 2020;93:25–42. [DOI] [PMC free article] [PubMed] [Google Scholar]
- 118.Higashi N, Irimura T, Nakajima M. Heparanase is involved in Leukocyte Migration. Adv Exp Med Biol. 2020;1221:435–44. [DOI] [PubMed] [Google Scholar]
- 119.Caruana I, et al. Heparanase promotes tumor infiltration and antitumor activity of CAR-redirected T lymphocytes. Nat Med. 2015;21(5):524–9. [DOI] [PMC free article] [PubMed] [Google Scholar]
- 120.Li JP, Vlodavsky I. Heparin, heparan sulfate and heparanase in inflammatory reactions. Thromb Haemost. 2009;102(5):823–8. [DOI] [PubMed] [Google Scholar]
- 121.Meirovitz A, et al. Heparanase in inflammation and inflammation-associated cancer. FEBS J. 2013;280(10):2307–19. [DOI] [PMC free article] [PubMed] [Google Scholar]
- 122.Goldberg R, et al. Versatile role of heparanase in inflammation. Matrix Biol. 2013;32(5):234–40. [DOI] [PMC free article] [PubMed] [Google Scholar]
- 123.Vlodavsky I, Iozzo RV, Sanderson RD. Heparanase: multiple functions in inflammation, diabetes and atherosclerosis. Matrix Biol. 2013;32(5):220–2. [DOI] [PubMed] [Google Scholar]
- 124.Takahashi H, et al. Involvement of heparanase in migration of microglial cells. Biochim Biophys Acta. 2008;1780(4):709–15. [DOI] [PubMed] [Google Scholar]
- 125.Lively S, Schlichter LC. The microglial activation state regulates migration and roles of matrix-dissolving enzymes for invasion. J Neuroinflammation. 2013;10:75. [DOI] [PMC free article] [PubMed] [Google Scholar]
- 126.Takahashi H, et al. Expression of heparanase in nestin-positive reactive astrocytes in ischemic lesions of rat brain after transient middle cerebral artery occlusion. Neurosci Lett. 2007;417(3):250–4. [DOI] [PubMed] [Google Scholar]
Associated Data
This section collects any data citations, data availability statements, or supplementary materials included in this article.
Supplementary Materials
Data Availability Statement
The mass spectrometry proteomics data have been deposited to the ProteomeXchange Consortium via the PRIDE partner repository with the dataset identifier of accession number PXD040101 and DOI 10.6019/PXD040101. Further inquiries can be directed to the corresponding authors.