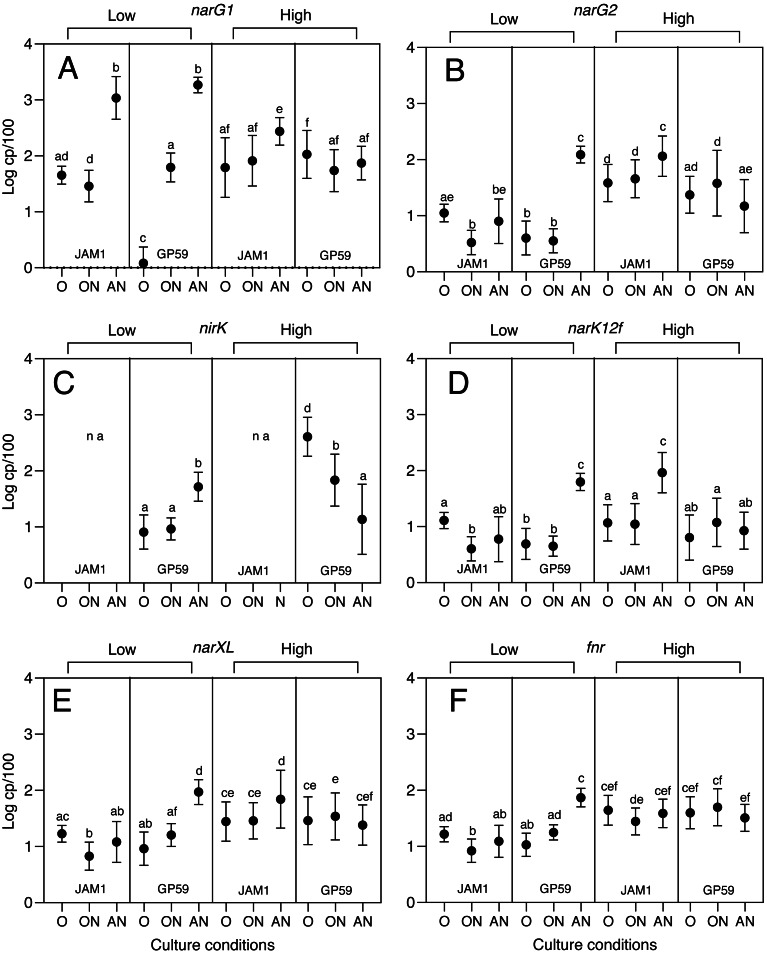
Figure 1. Transcript levels of selected denitrification genes and regulatory genes in cultures of strain JAM1T and strain GP59.
Strains JAM1T and strain GP59 were cultured under oxic (< <O > >), oxic with (< <ON > >) and anoxic (, no oxygen; < <AN > >) conditions. Total RNA was extracted from replicate cultures and RT-qPCR were performed. The transcript levels are expressed as the number of gene copies per 100 copies of normalized genes (cp/100). Two-way ANOVA tests with Tukey post hoc tests were performed on log10-transformed transcript levels. Values represented by different letters are highly significantly different (p < 0.0001) across culture conditions and strains. Values represented by the same letter are considered not highly significantly different. For instance, in panel A, Low period: the < <AN > > conditions between strain JAM1T and strain GP59 showed no difference (same letter “b”). Strain JAM1T under the < <O > > conditions (letters “a and d”) showed no difference with strain JAM1T under the < <ON > > conditions (letter “d”) and with strain GP59 under the < <ON > > conditions (letter “a”). However, strain JAM1T under the < <ON > > conditions (letter “d”) was different then strain GP59 under the < <ON > > conditions (letter “a”). Data represent mean log10 values ± SD. na, not applicable.

