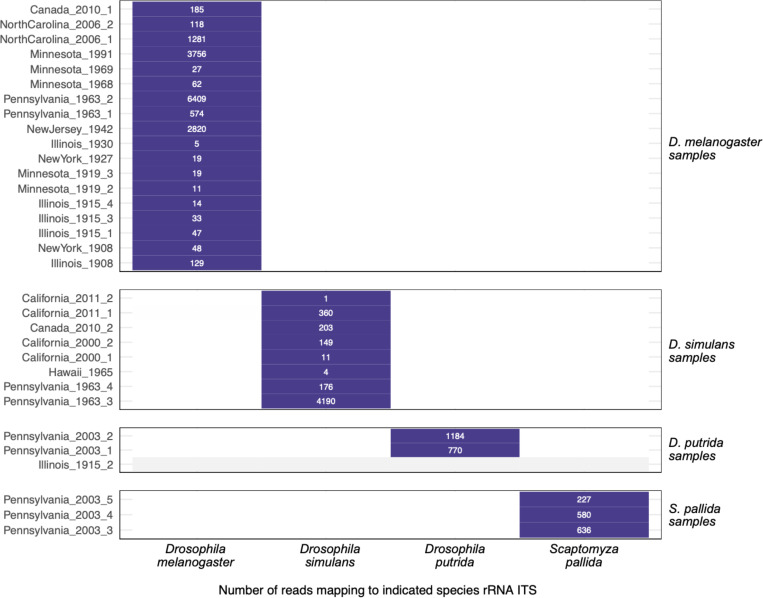
Figure 12: Host-mapping reads exhibited species specificity.
The number of reads mapping to the indicated species rRNA internal transcribed spacer 1 (ITS) sequence for each museum sample dataset is shown. Samples are grouped according to their molecular species assignment (Table S1). Datasets with no ITS-mapping reads are represented with grey.

