

Abstract
Understanding how mutations arise and spread through individuals and populations is fundamental to evolutionary biology. Most organisms have a life cycle with unicellular bottlenecks during reproduction. However, some organisms like plants, fungi, or colonial animals can grow indefinitely, changing the manner in which mutations spread throughout both the individual and the population. Furthermore, clonally reproducing organisms may also achieve exceedingly long lifespans, making somatic mutation an important mechanism of creating heritable variation for Darwinian evolution by natural selection. Yet, little is known about intra-organism mutation rates and evolutionary trajectories in long-lived species. Here, we study the Pando aspen clone, the largest known quaking aspen (Populus tremuloides) clone founded by a single seedling and thought to be one of the oldest studied organisms. Aspen reproduce vegetatively via new root-borne stems forming clonal patches, sometimes spanning several hectares. To study the evolutionary history of the Pando clone, we collected and sequenced over 500 samples from Pando and neighboring clones, as well as from various tissue types within Pando, including leaves, roots, and bark. We applied a series of filters to distinguish somatic mutations from the pool of both somatic and germline mutations, incorporating a technical replicate sequencing approach to account for uncertainty in somatic mutation detection. Despite root spreading being spatially constrained, we observed only a modest positive correlation between genetic and spatial distance, suggesting the presence of a mechanism preventing the accumulation and spread of mutations across units. Phylogenetic models estimate the age of the clone to between ~16,000–80,000 years. This age is generally corroborated by the near-continuous presence of aspen pollen in a lake sediment record collected from Fish Lake near Pando. Overall, this work enhances understanding of mutation accumulation and dispersal within and between ramets of long-lived, clonally-reproducing organisms.
Keywords: somatic mutations, clonal organisms, aspen
other keywords? 5 max
Understanding how mutations arise and spread through a population is essential to understanding biological evolution. The advent of high-throughput genome sequencing has allowed us to study mutational dynamics in a vast array of previously intractable non-model organisms (1), but nearly all prior work has focused on how mutations spread among well-individuated organisms (i.e., a life cycle that includes regular genetic bottlenecks), ignoring the effects of within-organism somatic mutations. This is a reasonable assumption for animals, in which germ cells segregate early during ontogeny, but many multicellular organisms (i.e., plants, fungi, red algae, brown algae) do not have germline sequestration (2, 3).
Clonal reproduction offers many ecological advantages. In addition to persisting over long timescales, horizontal growth through root or mycelium expansion also facilitates large spatial colonization. This effective use of clonal growth in diverse environments is exemplified by seagrasses, with genets spanning large areas of shallow waters despite local fragmentation (4). Similarly, a 2500-year-old clone of the fungus Armillaria gallica spread over 75 hectares of forest floors, sustained by its ability to feed on dead wood (5). Clonal proliferation through structures like stolons or rhizomes enhances colonization, especially after disturbances, such that many of these organisms have pioneering roles in their ecosystems. For instance in P. tremuloides, the growth of new ramets is stimulated by nutrients and light availability in areas recently damaged by fire (6, 7). Clonal propagation, as opposed to sexual reproduction, might also offer evolutionary advantages in challenging environments marked by pollinator scarcity or conditions inhibiting seed germination. The survival of the largest known clone of slow-growing rhizomatous sedge Carex curvula in alpine terrain may indeed have endured thanks to clonal recruitment (8). The persistence and ecological dominance of these clonal organisms underscore the evolutionary benefits of modular growth in ensuring survival and success across diverse habitats.
Yet, because every cell division represents an opportunity for DNA replication errors, clonal organisms also have greater opportunities to accumulate mutations. Indeed, the number of cell divisions separating the basal from the apical meristems may lead to the buildup of somatic mutations, spreading to derived tissues (9). While the emergence of somatic mutations in animals can lead to lethal cellular proliferation (tumors), it is noteworthy that the longest documented lifespans are all clonal organisms. In seagrasses, such as Posidonea australis (10), P. oceanica (11), Thalassia testudinum (4), or Zostera marina L. (12), estimates suggest ages exceeding 6000 years. With indefinite growth, the longevity of the clone is independent from the module life span, making it potentially immortal. Furthermore, clonal reproduction implies that somatic mutations can be passed down to their progeny, making somatic mutation an important mechanism of creating heritable variation for Darwinian evolution by natural selection. Indefinite growth, long lifespans and clonal reproduction are thus combined opportunities for mutation accumulation in clonally long-lived organisms.
The genetic signal from somatic mutations in clonal organisms can be harnessed to track within-plant architecture, but also the evolutionary history of the organism (13). So far, the study of the accumulation and spread of somatic mutations has been limited to a few studies in plants and fungi (4, 6, 14, 15), such that we still know little about the evolutionary fates of intra-organism mutations in large and long-lived perennials.
Here, we focus on one of the largest clonally-reproducing organism, the Pando clone, a quaking aspen that is also believed to be one of the oldest still-living organism. Quaking aspen (Populus tremuloides) can reproduce vegetatively by expanding roots from which new ramets grow. While individual stem lifespan averages 110 years (16), clones can regenerate themselves from the root stock such that the organism can be far older than its parts. The Pando clone has gathered particular attention for its size (42.6 hectares comprising ~47,000 individual stems) and was even nicknamed “Pando” (Latin for “I spread”) for this reason (17, 18).
To explore the evolutionary history of the Pando clone, we sequenced leaves, roots and bark samples at both large and fine scales. After identifying the samples pertaining to Pando, as opposed to the neighboring clones, we isolated the somatic mutations within the clone. Only the somatic mutations were considered, as germline mutations are present in every ramet and will not inform spatial expansion and genetic patterning. To increase confidence in the SNP-calling of somatic mutations and account for missing mutations, we used a technical replicate sequencing approach. Comparing both large scale and finer scale datasets, we find that physically close ramets tend to be genetically more similar. Using phylogenetic models, we estimate the age of the Pando clone to range from ~16,000 to 80,000 years, making it one of the oldest living organisms on Earth. In addition to shedding light on an old and iconic organism, this work deepens our understanding of the rate of accumulation and spread of somatic mutations within long-lived perennials.
Results
Brief overview of the different datasets.
To describe the evolutionary history of the Pando clone, we generated three different sets of data using different spatial scales and sequencing strategies (Table 1). We generated a large scale dataset by sampling leaves from the whole Pando stand, comprising the neighboring non-Pando clones, on a 50-m grid (“large scale dataset”, 184 samples, 22,888 SNPs, Supplementary Figure A.2, left panel). To focus on a smaller spatial scale and different tissue types, we gathered samples from two additional subsections from within the Pando clone and sequenced root, bark, leaves and branches (“fine scale dataset”, 101 samples, 15,925 SNPs with 3034 somatic mutations, Supplementary Figure A.2, right panel). To avoid batch effects and possible confounding effects of the two different spatial scales, the large and fine scale datasets were analyzed separately (see ordination plots in Supplementary Figure A.1).
Table 1.
To study the evolutionary history of the Pando clone, we generated datasets at different spatial scales and using different sequencing strategies. The large scale and fine scale datasets have the same initial number of mutations as the variant calling was done on both sets at once.
| Dataset name | Number of samples | Number of mutations (all/somatic) |
|---|---|---|
| large scale | 184 (Pando and neighboring clones) 89 (Pando only) | 22,888/-15,925/3942 |
| fine scale | 101 | 15,925/3034 |
| replicate | 80 | 4,607/101 |
Finally, to test our ability to accurately identify somatic mutations, we re-sequenced 12 samples from the fine scale dataset 8 times (same DNA extraction sequenced 8 times) (“replicate dataset”, 80 samples with 101 somatic mutations).
Delineating the Pando clone.
To isolate the Pando clone samples from the neighboring clone samples in the large scale dataset, we applied an ordination method and k-means clustering on 22,888 single nucleotide variants comprising a mixture of germline SNPs and somatic mutations (principal component analysis, PCA, Figure 1A). Pando samples (89 out of 184 samples) formed a distinct cluster in PCA space with spatial boundaries for Pando that were consistent with previously defined clone boundaries based on morphological differences (19), and microsatellite markers (17, 20) (Figure 1B). We thus verified the spatial extent, 42.6 ha, of Pando.
Fig. 1.
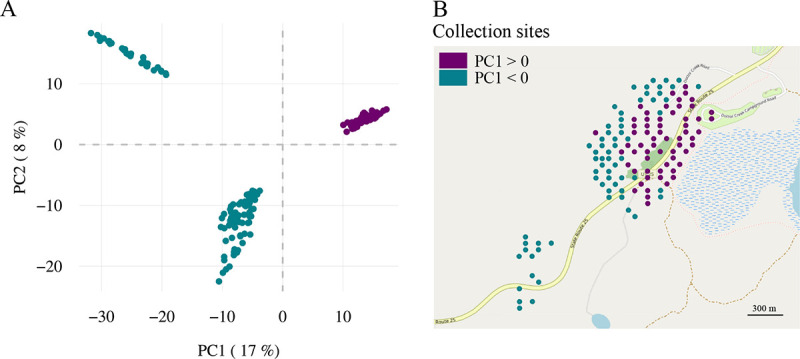
Parsing out the Pando samples from the surrounding clone samples. (A) The projection of genotypes (22,888 variants) form three distinct clusters: two clusters with negative PC1 values and one cluster with positive PC1 values. Points are labeled with a color proportional to their PC1 value. (B) Plotting the PC1 value into the sampling space delineates the Pando cluster (positive PC1 values) from the surrounding clone clusters (negative PC1 values).
Identifying the somatic mutations.
Germline mutations are inherited and should be common to Pando as a whole. Somatic mutations, however, are mutations that appeared after seed formation and during the organism’s growth, potentially making tractable the evolutionary history of the organism. To describe the development of the Pando clone in time and space, we thus focused on the somatic mutations in a large number of samples. With a genome size of 480 Mbp (21), sequencing whole genomes for hundreds of individuals was prohibitively expensive. Furthermore, we only needed information from the same subset of the genome for a high number of individuals. Hence, we generated a reduced complexity library using Genotyping-By-Sequencing (GBS) (22).
Somatic mutations have been extensively studied in the context of cancer research (23), which are caused by post-zygotic mutations. In such cases, one common approach to identify somatic mutations in tumor cells is to compare the genomes of a set of healthy cells (“normal”) and a set of malignant cells (“tumor”). However, in our case, we did not have access to the “normal” set of samples, which would be the initial “mother” tree of the Pando clone. Thus, to separate somatic mutations from the pool of genetic variants, we created a set of “normal” samples based on the variants found in the neighboring clones and in 100 P. tremuloides samples from the USA’s Intermountain region (Colorado, Wyoming, Nevada, Idaho). We removed variants that were found in both the Pando clone samples and this comparative dataset, with the reasoning that common mutations may be germline in origin, or highly mutable sites. Secondly, to minimize the effects of sequencing errors, we removed mutations that were found in only one sample.
With an inherent per-base pair error rate of approximately 0.31% for Illumina reads (24), focusing on rare (somatic) mutations increases the risks of missing true mutations, and on picking false mutations. To assess our ability to consistently recover somatic mutations, we sequenced the same sample several times (12 samples sequenced 8 times each, from the same DNA extraction). After applying basic quality filtering (see Methods for more details), we kept the mutation as somatic if it was found in at least two replicates of a sample, and at most 80% of the samples (Figure 2A). This decision for the 80% filter was based on the rationale that variants occurring in more than 80% of the ramets are likely germline mutations, shared across all trees but not necessarily detected in each one. These filters left us with a set of 101 mutations present in less than 40% of the samples, as there were no mutations between 40% and the 80% cutoff (Figure 2B). When a mutation is found in two replicates per sample, it is on average found in 3.5 replicates total (i.e., 44% of the replicates), which is significantly higher than by chance (randomization test, null expectation = 0.37 with 1000 permutations, P < 0.001, Figure 2C). The replication of mutations did not vary as a function of coverage (Supplementary Figure A.4). While these analyses confirm the detection of somatic mutations, they suggest that some mutations are still being missed. We revisit this issue when estimating the age of Pando (see Age of the Pando clone section).
Fig. 2.
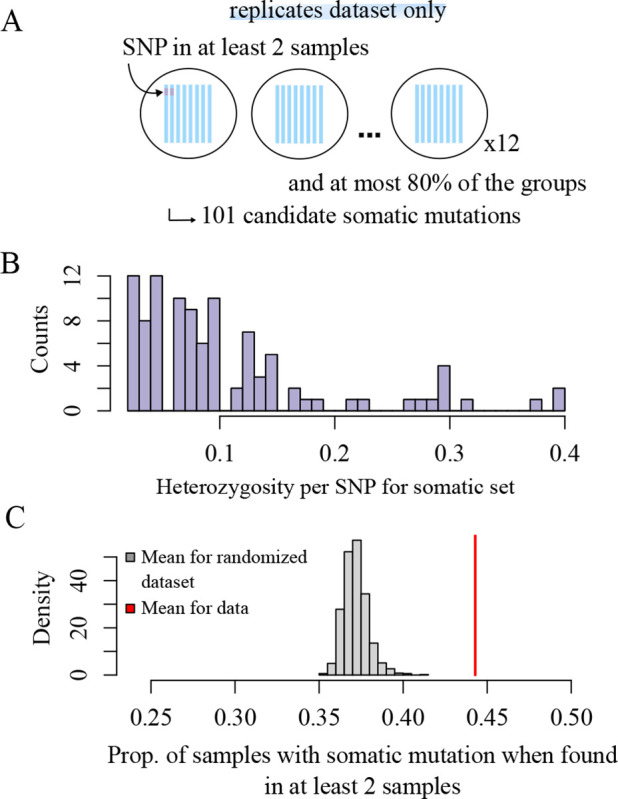
Replication power for somatic mutations. (A) To filter for somatic mutations, we kept the mutations that were found in at least two samples per replicate group, and at most 80% of the samples (see methods for details on the filters). We identified 101 somatic mutations, (B) found in less than 40% of the individuals. (C) If a mutation is present in two samples in a group, it is found on average in 44% of the samples total.
Having established our ability to recover rare mutations, we proceeded to identify somatic mutations in the rest of the Pando datasets, which include both the large-scale dataset (with only the Pando samples) and the fine-scale dataset (Table 1). We applied the same set of filters that were applied to the replicate dataset to filter out the germline mutations.
Patterns of spatial genetic structure for somatic mutations - large scale.
We identified 3942 putative somatic mutations from the 89 Pando ramet samples (large scale dataset, Table 1). On average, samples shared 26.8% somatic mutations (range = 583 to 1679). Due to clonal reproduction and spatial restriction in dispersal (roots from one tree can expand up to 15m (25)), we expected to observe a non-random spatial distribution of somatic mutations (26). More specifically, we expected ramets that are close in space to share more mutations than ramets that are further apart from each other. However, there was only a marginally detectable correlation between the proportion of shared variants and the physical distance between pairs of ramets (Figure 3A, Pearson correlation coefficient = −0.02, [CI] = [−0.05, 0.00] Figure 3B, null expectation = −0.001 with 1000 permutations of the somatic mutation set, P < 0.001). We uncovered further spatial structure when focusing on spatial distribution of each somatic mutation. The mean distance between all samples sharing a mutation, averaged over all mutations, is smaller than expected by chance (Figure 3C&D, mean distance for groups sharing a somatic mutations is 264.28 m, as compared to the mean distance (null expectation) of 279.93 m for a randomized dataset with 500 permutations of the sample coordinates, P < 0.002). Given that a single root can extend up to 15 m in space (25), and our grid sampling had a minimum distance of 50 m, we hypothesized that we might be missing spatial signals at finer scales. Additionally, focusing solely on leaves could overlook somatic mutation signals, as clonal aspen expand through their roots (Figure 4). To better understand the spread of somatic mutations within and between ramets and tissue types, we conducted our analyses at a finer spatial scale by comparing samples from sub-sections of the clone and from different tissues within ramets.
Fig. 3.
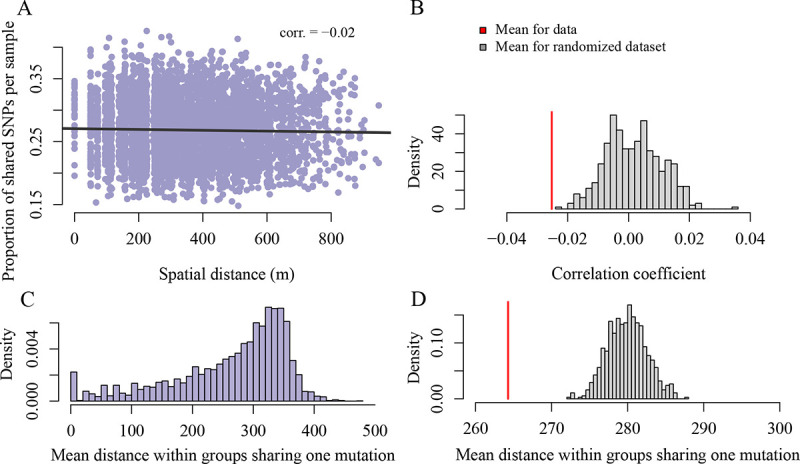
Detecting spatial genetic structure at large scale. (A) We use the set of 3942 somatic mutations identified in the Pando clone samples to test for spatial genetic structure. Focusing on the sample-level, we observe that the number of shared variants between pairs of samples decreases with the physical distance between samples pairs (Pearson correlation coefficient between number of variants and spatial distance is −0.02, [CI] = [−0.05, 0.00]), which is significantly different from a randomized distribution (P < 0.001) (B). (C & D) Focusing on the variant-level, we find that the mean distance within a group of samples sharing the variant is significantly less than expected by chance (mean distance for data is 264.28 m and mean distance for randomized dataset is 279.93 m, P < 0.001).
Fig. 4.
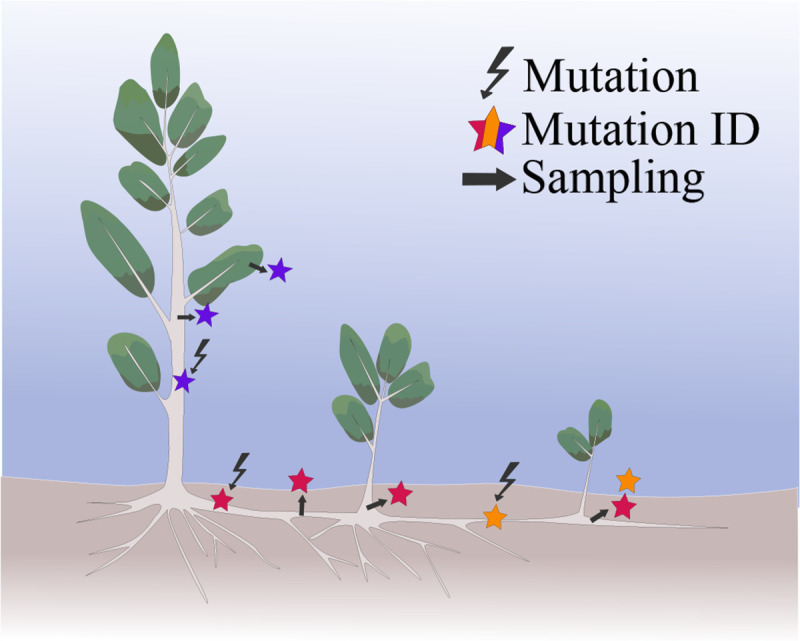
Conceptual model of somatic mutation inheritance between ramets within an aspen clone. When a mutation arises, we expect it to propagate down to the new tissues as the clone continues to grow. New mutations are symbolized with the lightning bolt. The mutation identity is marked as a colored star and the dark marks corresponds to where samples could be collected from the clone.
Patterns of spatial genetic structure for somatic mutations - fine scale.
To detect fine-scale spatial structure and differences between tissue types, we focused on a smaller spatial scale, sampling ramets 1–15 m apart in a circular scheme at two locations within the Pando clone (~120 m apart, see Supplementary Figures A.2 and A.3), as well as tissues within ramets (roots, shoots, branches, and leaves).
Overall, we found significant evidence of genetic structure, with genetic differences increasing with spatial distance (Figure 5A, Pearson correlation coefficient = −0.1, [CI] = [−0.12, −0.07], null expectation = 0.00 with 500 permutations, P = 0.006). The signal was especially strong for leaves (Pearson correlation coefficient −0.44, [CI] = [−0.49, −0.38]), with more somatic mutations shared between spatially close leaves compared to random (P < 0.001). The roots also shared significantly more mutations than expected under a null distribution (Pearson correlation coefficient −0.11, [CI] = [0.18, −0.03], P = 0.026 when compared to null distribution). This signal was not observed in the branches and the shoots (Pearson correlation coefficient −0.06, [CI] = [−0.24, 0.11] for branches and −0.05, [CI] = [−0.37, 0.28] for shoots).
Fig. 5.
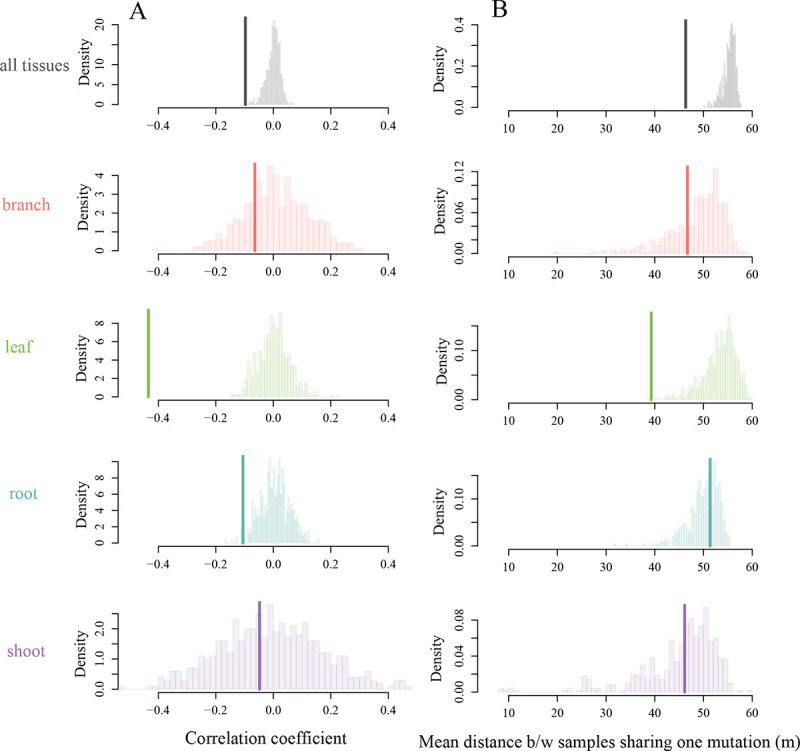
Detecting spatial genetic structure at the finer scale. We use the set of 3034 somatic mutations detected in the finer scale dataset to test for smaller-scale and within tissues spatial genetic structure. (A) Focusing at the sample-level, we observe an overall significantly negative correlation between genetic and physical distance (thick lines, Pearson correlation coefficient = −0.097, [CI] = [−0.12, 0.07]), driven mostly by the leaves and the roots (compared to null distributions, P < 0.001 and P = 0.026, respectively). (B) Focusing on the variant-level, we find that the mean distance within a group of samples sharing the variant (thick line, mean distance for the data is 46.33 m) is significantly less than expected by chance when considering all tissue types together (mean distance for the null distribution is 55.31 m, P < 0.001), signal that is mostly driven by the leaves (mean distance for leaves only is 39.28 m, as compared to 53.36 m expected under the null distribution, see Supplementary Figure A.6 for means and p-values).
Similarly, a variant-level approach showed that the number of shared somatic mutations per pair of samples decreased with spatial distance (Figure 5B, mean distance for groups sharing a somatic mutations is 46.33 m, as compared to the mean distance (null expectation) of 55.31 m for a randomized dataset with 500 permutations, P = 0.002). The leaves showed the strongest spatial structure signal using this metric (Figure 5B and Supplementary Figure A.5), while other tissue types did not differ from the null expectation. The absence of signal in the shoots and branches may be partly explained by the significantly higher number of mutations recovered in leaves compared to other tissues (Supplementary Figure A.8).
Age of the Pando clone.
We took a phylogenetic approach to infer the Pando clone age with our set of somatic mutations. Specifically, we reconstructed the phylogenetic history of the Pando samples with BEAST2 with the large-scale dataset (3957 mutations and 102 samples). We used a variable population size coalescent model, which reconstructs the past population dynamics based on a contemporary set of sequence data (Coalescent Bayesian Skyline model in BEAST2 (27)). Because the somatic mutations are rare, they can be harder to detect using Illumina technology when the read depth is not exceptionally high (mean read depth is 14×). To estimate the proportion of missed mutations, we compared the set of somatic mutations obtained in the replicate dataset (101 mutations, Figure 2), to the set of somatic mutations obtained in the same samples in the main dataset, where each of samples was sequenced only once (3957 mutations). Only ~6%, 6 mutations out of 101 were replicated. Coverage partially explained this lack of replication: in general, mutations that were found in the replicate dataset had higher depth than mutations the mutations found in the fine scale dataset (41.5x versus 11.6x), however, some of the somatic mutations that were found in both datasets had a depth as low as 6x for the fine scale dataset (Supplementary Figure A.7). It is important to note that the mutations were called independently in these two datasets. Given that variant calling is influenced by sample composition, this independent variant call may underestimate the mutation replication rate.
To take into account the effect of large amount of missing mutations on the phylogenetic tree height and thus the Pando clone age, we empirically estimated the relationship between the proportion of missing mutations and the phylogenetic tree height (Figure 6A). To do so, we randomly removed mutations and simulated the phylogeny in BEAST (black dots, Figure 6A). We obtained a linear relationship between the proportion of missing mutations and the phylogenetic tree height, which we extrapolated to take into account false negatives or positives (i.e. mutations that we either missed, or called but are not real). This scaled tree height was converted to years based on the published estimation of somatic mutation rate in P. tremuloides (28) using the following equation:
with T being the scaled phylogenetic tree height, nS the total number of mutations, nBP, the total number of base pairs sequenced, μ the leaf somatic mutation rate (1.33 * 10−10 per base per haploid genome per year (28)), taking into account that the Pando clone is triploid (20, 29) (see Methods for details).
Fig. 6.

The Pando clone is at least 16,000 years old. (A) We use the relationship between the proportion of missing mutations from a simulated dataset and the phylogenetic tree height to take into account the somatic mutations that we might be missing in the Pando clone (linear regression y = 0.10 + 0.11x, P < 2.2e − 16, R2 = 0.92). (B) With this correction, we calculate the Pando clone age based on three different assumptions: (1) if the mutations we detect are all real, the Pando clone would be about 34 000 years old (± sd = 1007 years); (2) if we are missing 94% of the mutations, then the clone would on average be 81,000 years old (± sd = 1922 years); (3) finally, if only 6% of the mutations we detect are real somatic mutations, the Pando clone would be 16,402 years old (± sd = 7 years). (C) The Bayesian skyline plot suggests a steady population increase followed by a plateau. Note that this example was scaled for assumption 1 (all the mutations that we detect are real somatic mutations). (D) Despite thousands of years of evolutionary history, the Pando clone shows minimal phylogenetic structure (points colored according to PC1 score). (E) Pollen records from the Fish Lake show Populus was consistently present during the last 15,000 years, and generally well-represented over the last 60,000 years.
We calculated three different estimates of the Pando clone age based on three different assumptions (Figure 6B). First, if the mutations we detected are all true positives and we did not miss any somatic mutations in the proportion of the genome we sequenced, we do not have to apply any correction to the phylogeny height conversion and the Pando clone would be about 34,000 years old (assumption 1, sd = 1007 years). Second, if we take into account that we only detected 6% of the somatic mutations present in the samples and use the linear relationship (Figure 6A) to account for false negatives, then the clone would on average be 81,000 years old (assumption 2, sd = 1922 years). Finally, if only 6% of the mutations we detect are true positives, the Pando clone would be 16,402 years old (assumption 3, sd = 7 years). The population dynamics reconstruction suggest a slow and steady increase during the first half of Pando’s life, followed by a steadier population size (Figure 6C). The unit of effective population size here can be thought of in terms of cellular lineages giving rise to new tissues (as compared to individuals when working with germline mutations). Despite its thousands of years of history, the phylogeny of the Pando clone samples suggests only minimal structure (Figure 6D). The same analysis of the fine scale dataset suggests results of a similar scale, that is, an age for Pando between ~10,000 and 100,000 years (Supplementary Figure A.9). Interestingly, pollen records from the Fish Lake support a continuous presence of Populus during the last 15,000 years, potentially up to 60,000 years ago, which generally coincides with our age estimates for Pando (Figure 6E).
Discussion
We explored the evolutionary and developmental history of a long-lived, clonally reproducing tree, confirming that the Pando clone consists of a single genet spanning 42.6 hectares. We based our estimate of the age of the Pando clone on the accumulation of somatic mutations, acknowledging uncertainties due to rare mutation calls by exploring three different scenarios (Figure 6). Our most conservative estimate, based on the percentage of mutations we are confident in recovering, suggests the clone is at least 16 000 years old. A second scenario, using all detected mutations without further filtering, places the clone’s age at approximately 34 000 years. Lastly, our least conservative estimate, which includes potential undetected somatic mutations, suggests the Pando clone could be as old as 81 000 years. Regardless of the scenario, these estimates highlight the remarkable longevity of the Pando clone, which has likely persisted for more than ten thousand years, making it one of the oldest living organisms on Earth.
The last glaciation event models that this region of North America at low altitudes was not covered in ice (30, 31). With an altitude of 2700 m however, the specific area where the Pando clone is in the Fish Lake plateau could have been caught in mountain glaciers. Boulder exposure ages in the Fish Lake plateau suggests a local last glacial maximum of 21,100 years (32). However, the Fish Lake Plateau glaciers reconstructed from models have altitudes ranging from 2950 to 3190 m, thus higher in elevation than the Pando area, suggesting that vegetation survived through the glacial period, specifically at Pando’s present location. This interpretation is supported by subfossil pollen analyzed from a lake sediment core collected nearby Fish Lake (Figure 6E, upper panel). This data show that Populus pollen has been present continuously in the Fish Lake catchment for the last 15,000 years but has been generally present over the last 60,000 years.
When reflecting on the Pando clone’s expansive territorial dominance and enduring resilience, its triploid nature may have played a crucial role in its success (33). Polyploid organisms, like Pando, often exhibit advantages such as enhanced adaptability and competitive ability, traits commonly associated with the success of invasive species. Although polyploidy can be energetically costly, it is frequently linked to rapid territorial expansion (34). Prior work shown a positive correlation between polyploidy and plant invasiveness, along with a reduced risk of endangerment (35). In Pando’s case, polyploidy may have contributed to its capacity to thrive in changing environments and secure its long-lived dominance. However, unlike many polyploid species that spread via sexual reproduction, odd-numbered ploidies have typically very low fertility, making clonal evolution even more critical to Pando’s persistence (36). This highlights the importance of somatic mutation and within-organism evolution in shaping the genetic diversity and resilience of this ancient clone.
To explore isolation by distance in clonally reproducing organisms, we sequenced leaves across a 50-m grid covering the entire Pando area as well as leaves, branches, shoots and roots at a finer scale, with samples collected 1–15 m apart in two locations within the clone. Our findings reveal spatial genetic structure within the clone, with samples sharing more mutations when geographically closer (Figure 3 & 5). While we were able to detect this spatial signal at fine scale in the leaves and roots, it was weaker at larger scales than expected and usually observed in clonal organisms (26, 37, 38). Although we can clearly distinguish Pando samples from neighboring clones (Figure 1) and detect some internal structure within Pando (Figures 3&5, the relatively low number of shared mutations between closely related tissues (roots, shoots and branches, Figure 5) suggests an intriguing underlying dynamic.
Research on within-clone mutation diversity shows that members of the same clonal population are rarely genetically identical, but rapidly accumulate mutations that are not shared by all individuals (12). Similar observations were made in strawberries where mutations present in mother plants were absent in daughter plants propagated via stolons (13). Somatic mutations occurring in local tissues are not always passed down to the next generation of cells. As roots grow, the meristematic island that will give rise to new ramets gets pushed by waves of cells, protecting the stem cells from mutation accumulation (39). This aligns with the low number of somatic SNPs detected between two oak leaf genomes sampled from the same individual (17 out of 314 865 putative SNPs in 236-yo oak tree (15)). Despite prolonged lifespan and exposure to significant environmental changes, plants seem to have evolved mechanisms protecting the meristems from accumulating mutations. When sequencing entire tissues, we might be observing the localized buildup of somatic mutations rather than the cell lineages contributing to organismal evolution, which would explain the relatively weak spatial genetic structure.
Our results suggest differing rates of somatic mutations between tissues that contribute to the progeny versus those that do not, and between annual and perennial tissues. We found that leaves accumulate more mutations than bark (branches and shoots), and roots. This aligns with findings from other studies, where longer-lived organs show lower mutation rates compared to more short-lived structures (leaves versus petals) (13). Similarly, in peach trees, mutation accumulation in branches—tissues involved in sexual reproduction—was lower than in roots (13), suggesting a history of selection minimizing mutation accumulation in reproductive tissues.
This work provides novel insights into the evolutionary history of one of Earth’s oldest and largest known organisms, the quaking aspen clone Pando. By analyzing somatic mutations across different spatial scales and tissue types, we estimate the clone’s age to be at least 16,000 years old, with potential upper estimates reaching 80,000 years. Our findings reveal a weaker than expected spatial genetic structure within the clone, suggesting localized mutation build-up rather than consistent dispersal along tissue lineages. This work advances our comprehension of intra-organism evolution in clonal plants and suggests potential mechanisms for maintaining genetic integrity in indefinitely growing organisms. The observed differences in mutation accumulation between tissue types provide insight into how plants may evolve to preserve the genetic fidelity of meristems fueling indefinite growth. These findings have broader implications for our understanding of adaptive strategies in long-lived perennials and the evolutionary dynamics of clonal organisms in changing environments.
Methods
Sampling.
The Pando clone (Populus tremuloides) is located in the Fishlake National Forest, Utah, USA (38°31’N, 111°45’W), and ranges in altitude from 2700–2790 m. The sampling area consists of two distinct subsections dominated by aspen containing both Pando and surrounding clones. The large scale dataset containing the Pando clone and the surrounding clones was obtained by collecting leaves based on a 50-m grid in June 2006 and November 2007, sampling from both a smaller (younger) and a taller (older) tree at each location (see (17) for more details). To test for the finer scale within clone genetic structure, leaves, roots, bark from the trunk and branches of additional stems were sampled in June 2022. Two sampling sites within the Pando clone were chosen for this additional sampling, one situated in an area that was clear-cut 30 years ago and the other one in an older area (Supplementary Figures A.2 and A.3). 100 additional leaf samples were collected from P.tremuloides in the USA’s Intermountain region (Colorado, Wyoming, Nevada, Idaho) to generate the ’panel of normals’ (see “Identifying somatic mutations” section). Leaves were kept in paper coin envelope and placed in desiccant. Root and bark samples were placed in polyethylene bags and kept at cool temperatures before long term storage at −20°C.
Sequencing.
The 296 leaf samples from the Pando and surrounding clones, and the 45 root samples, 45 leaves and 27 bark samples from trunk and branches were prepared for GBS sequencing. Woody tissues were powdered using a pester and mortal and further lysed using Tissue Lyzer II (TissueLyser II, Qiagen). Genomic DNA was extracted using the DNeasy Plant Pro Kit (Cat. No. 69204, Qiagen). To generate a reduced complexity DNA library, the genome was digested using MseI and EcoR1 enzymes. The fragments were labelled and prepared for sequencing using oligonucleotides consisting of Illumina adaptors and unique 8–10 base pair (bp) sequences. The fragments were amplified and size-selected to only keep fragments between 300 and 400 bp-long, before sequencing (Genotyping-By-Sequencing, see (40) for more details). The samples were sequenced at the University of Texas Genomic Sequencing and Analysis Facility (Austin, TX, USA). Library preparation and sequencing were done in three batches, with 367 samples sequenced with an Illumina HiSeq 4000 (1 × 100 base pair reads) in 2018, 126 and 96 samples sequenced on a NovaSeq (1 × 100 base pair reads) in 2022 and 2024, respectively (one lane each). Total number of reads was 1 027 955 624.
Genome alignment and variant calling.
We used the mem algorithm from bwa (default options, version 0.7.17-r1188, (41)) to align the reads to the published reference genome for P. tremuloides (21). We used samtools to compress, sort and index the alignments (Version: 1.16 (41)). We called the variants using samtools mpileup algorithm (Version: 1.16). The large-scale and fine-scale datasets were pooled for variant calling, and the replicate and ’panel of normals’ datasets were kept separate. We kept mapped reads with a quality >30, skipped bases with base quality >30 and ignored insertion–deletion polymorphisms. At this step, we also separated from the poled vcf the fine-scale and large-scale samples. We then filtered our set of SNPs by keeping the sites for which we had data (mapped reads) in at least 60% of individuals, a mean coverage per sample of at least 4×, and at least one read supporting the non-reference allele. We also removed SNPs failing the base quality rank-sum test (P < 0.005), mapping-quality rank-sum test (P < 0.005), and the read position rank-sum test (P < 0.01).
To minimize confounding batch effects, we additionally removed the variants that had a notable difference in coverage between the fine-scale and large-scale datasets. Indeed, differences during the GBS size selection step between batches could lead to differences in the representation of some fragments. To counter this, we removed SNPs with a difference in coverage between the two datasets, that was more than half the mean coverage of the datasets combined (the mean coverage was 14× per individual per variant). At this step, we were left with 22,888 variants.
In order to differentiate between the samples pertaining to the Pando clone and the surrounding clones, we obtained Bayesian estimates of genotypes. We specifically computed the posterior mean genotype as a point estimate based on the genotype likelihood from bcftools and a binomial prior based on the allele frequency estimates from the vcf file. We used principal component analysis (PCA) to ordinate the samples; this was performed on the matrix of centered but not scaled genotype estimates. We did not scale as the variance was similar between samples. The PCA clustered the samples, separating the Pando clone samples, from the surrounding clone samples (Figure 1). We used k-means clustering (R kmeans function, with K=2) to label the different clusters of samples and further split the variant file into two files: the Pando variant file and the surrounding clones variant file, with 9 424 and 20 178 SNPs, respectively.
Identifying somatic mutations.
To filter out the germline mutations and only be left with the somatic mutations, we first compared each dataset (replicates, fine scale and large scale) with the surrounding clones set of variants and a ‘panel of normals’ and only kept the variants unique to dataset of focus. The ‘panel of normals’ (42) is composed of 100 samples of P. tremuloides from Utah neighboring states (Idaho, Wyoming, Colorado, Nevada) that were collected and sequenced with the large scale dataset in 2008. Next, we labeled samples as homozygotes or heterozygotes for every variant detected by comparing their probability of being heterozygote to the threshold value (.95). To remove variants that may have been present in the mother seed of the organism, we removed the SNPs that were found in 80% or more of the samples. We also removed the variants that were only found in one sample, as they could be either rare variants, or sequencing errors. We filtered out individuals with a mean coverage of <4x for all variants. We then performed a spatial structure analysis on the filtered sets of somatic mutations.
Spatial analyses.
To detect spatial structure in the dataset, we applied the same set of analyses on two different datasets: (1) a large scale, and (2) a finer scale dataset. We first compared the proportion of shared variants per pair of samples to their physical distance (number of shared mutations between a pair of samples, divided by the mean number of mutations for the same pair of samples). We then compared the mean distance between groups of samples sharing a mutation. We used Vincenty ellipsoid method (distVincentyEllipsoid function in R) to calculate the shortest spatial distance between two samples. For each analysis, we compared the empirical values to values obtained from a randomized dataset to assess the significance of the results. To generate null distributions, we randomized either the genotypes or the pair of spatial coordinates, (latitude and longitude) and ran the same analysis as ran on the non-permuted data (500 or 1000 permutations).
Coalescent model using BEAST.
We used the software package BEAST (version 2.7.5) to estimate the height of the phylogenetic tree for the Pando samples based on the accumulated somatic mutations; this was done on a coalescent Bayesian skyline model for effective population size (27, 43, 44). We chose the GTR nucleotide-substitution model to account for unequal substitutions rates between bases (45). The nexus file was obtained by concatenating the set of somatic SNPs with binary coding of the presence of the homozygote genotype with one of the base pair (for example, “A”), a heterozygote with another base pair (for example, “T”) and a missing site (no variant calling information for that site) with an “N”. The chains were run for 7x10⁷ states. To estimate the age of the tree, we converted the phylogeny height to years a posteriori following this calculation:
with T being the phylogenetic tree height as given by BEAST, nS the total number of mutations, nBP, the total number of base pairs sequenced, μ the leaf somatic mutation rate (1.33 * 10−10 per base per haploid genome per year (28)), taking into account that the Pando clone is triploid (20, 29). The total number of base pairs sequenced (129,194,577) was estimated using angsd (46), and reduced following the proportion of base pairs that we filtered out based on coverage (48%).
Accounting for missing mutations.
We compared the number of common mutations between the replicate dataset set of somatic mutations, and mutations from the 12 samples of the finer scale, from which the replicate samples were derived. 6 mutations (out of 101) were common between both datasets, implying that we are missing 96% of the somatic mutations. To take this into account as well as how the phylogenetic tree height might be affected with missing mutations, we calculated the relationship between the number of missing mutations and the phylogeny height. To do so, we randomly removed an increasing percentage of mutations, simulated the phylogeny in BEAST and found a linear relationship between the proportion of missing mutations and the phylogenetic tree height. We used this regression to estimate the Pando clone age.
Pollen analysis.
Pollen analysis followed standard acid digestion procedures (47). Pollen residues were classified and tabulated using light microscopy at 40x until a minimum of 300 terrestrial grains were counted. Pollen identification was assisted by relevant keys and literature (e.g., Kapp et al. 2000 (48)). We assume that the Populus pollen type, which is generally not diagnostic to species-level assignment, reflects quaking aspen in this environmental setting.
Supplementary Material
Significance Statement.
This study enhances our understanding of evolutionary processes in long-lived clonal organisms by investigating somatic mutation accumulation and dispersal patterns within the iconic Pando aspen clone. The authors estimated the clone to be between 10,000 and 80,000 years old and uncovered a modest spatial genetic structure in the 42.6-hectare clone, suggesting localized mutation build-up rather than dispersal along tissue lineages. This work sheds light on an ancient organism and how plants may evolve to preserve genetic integrity in meristems fueling indefinite growth, with implications for our comprehension of adaptive strategies in long-lived perennials.
ACKNOWLEDGMENTS.
We would like to thank the GT QBioS Graduate Program for its support and the Society for the Study of Evolution for granting a Rosemary Grant Advanced Award to Rozenn Pineau that helped with pushing this work forward. This work was initiated by a seed grant from AV and JM. The work was further supported by grants from the NIH (Grant No. 5R35GM138030), the NSF Division of Environmental Biology (Grant No. DEB-1845363) to WCR and (Grant No. DEB-1844941) to ZG, and the NSF grant Paleo Perspectives on Climate Change (P2C2) Program (Grant No. 2102997) to JM and AB. The support and resources from the Center for High Performance Computing at the University of Utah are gratefully acknowledged.
Footnotes
Authors declare no competing interests.
References
- 1.Ekblom R, Galindo J, Applications of next generation sequencing in molecular ecology of non-model organisms. Heredity 107, 1–15 (2011). [DOI] [PMC free article] [PubMed] [Google Scholar]
- 2.Lanfear R, Do plants have a segregated germline? PLoS biology 16, e2005439 (2018). [DOI] [PMC free article] [PubMed] [Google Scholar]
- 3.Berger F, Twell D, Germline specification and function in plants. Annu. review plant biology 62, 461–484 (2011). [DOI] [PubMed] [Google Scholar]
- 4.Bricker E, Calladine A, Virnstein R, Waycott M, Mega clonality in an aquatic plant—a potential survival strategy in a changing environment. Front. plant science 9, 435 (2018). [DOI] [PMC free article] [PubMed] [Google Scholar]
- 5.Anderson JB, et al. , Clonal evolution and genome stability in a 2500-year-old fungal individual. Proc. Royal Soc. B 285, 20182233 (2018). [DOI] [PMC free article] [PubMed] [Google Scholar]
- 6.Wang GG, Early regeneration and growth dynamics of populus tremuloides suckers in relation to fire severity. Can. J. For. Res. 33, 1998–2006 (2003). [Google Scholar]
- 7.Johnstone JF, Effects of aspen (populus tremuloides) sucker removal on postfire conifer regeneration in central alaska. Can. J. For. Res. 35, 483–486 (2005). [Google Scholar]
- 8.Steinger T, Körner C, Schmid B, Long-term persistence in a changing climate: Dna analysis suggests very old ages of clones of alpine carex curvula. Oecologia 105, 94–99 (1996). [DOI] [PubMed] [Google Scholar]
- 9.Tomimoto S, Satake A, Modelling somatic mutation accumulation and expansion in a long-lived tree with hierarchical modular architecture. J. Theor. Biol. 565, 111465 (2023). [DOI] [PubMed] [Google Scholar]
- 10.Edgeloe JM, et al. , Extensive polyploid clonality was a successful strategy for seagrass to expand into a newly submerged environment. Proc. Royal Soc. B 289, 20220538 (2022). [DOI] [PMC free article] [PubMed] [Google Scholar]
- 11.Arnaud-Haond S, et al. , Implications of extreme life span in clonal organisms: millenary clones in meadows of the threatened seagrass posidonia oceanica. PloS one 7, e30454 (2012). [DOI] [PMC free article] [PubMed] [Google Scholar]
- 12.Reusch TB, Boström C, Widespread genetic mosaicism in the marine angiosperm zostera marina is correlated with clonal reproduction. Evol. Ecol. 25, 899–913 (2011). [Google Scholar]
- 13.Wang L, et al. , The architecture of intra-organism mutation rate variation in plants. PLoS biology 17, e3000191 (2019). [DOI] [PMC free article] [PubMed] [Google Scholar]
- 14.Anderson RP, Macdonald FA, Jones DS, McMahon S, Briggs DE, Doushantuo-type microfossils from latest ediacaran phosphorites of northern mongolia. Geology 45, 1079–1082 (2017). [Google Scholar]
- 15.Schmid-Siegert E, et al. , Low number of fixed somatic mutations in a long-lived oak tree. Nat. Plants 3, 926–929 (2017). [DOI] [PubMed] [Google Scholar]
- 16.DeByle NV, Winokur RP, Aspen: ecology and management in the western United States. (US Department of Agriculture, Forest Service, Rocky Mountain Forest; and … ) Vol. 119, (1985). [Google Scholar]
- 17.DeWoody J, Rowe CA, Hipkins VD, Mock KE, “pando” lives: molecular genetic evidence of a giant aspen clone in central utah. West. North Am. Nat. 68, 493–497 (2008). [Google Scholar]
- 18.Grant MC, The trembling giant. Discover 14, 82 (1993). [Google Scholar]
- 19.Barnes BV, The clonal growth habit of american aspens. Ecology 47, 439–447 (1966). [Google Scholar]
- 20.Mock KE, Rowe C, Hooten MB, Dewoody J, Hipkins V, Clonal dynamics in western north american aspen (populus tremuloides). Mol. Ecol. 17, 4827–4844 (2008). [DOI] [PubMed] [Google Scholar]
- 21.Lin YC, et al. , Functional and evolutionary genomic inferences in populus through genome and population sequencing of american and european aspen. Proc. Natl. Acad. Sci. 115, E10970–E10978 (2018). [DOI] [PMC free article] [PubMed] [Google Scholar]
- 22.Narum SR, Buerkle CA, Davey JW, Miller MR, Hohenlohe PA, Genotyping-by-sequencing in ecological and conservation genomics. Mol. ecology 22, 2841 (2013). [DOI] [PMC free article] [PubMed] [Google Scholar]
- 23.Martincorena I, Campbell PJ, Somatic mutation in cancer and normal cells. Science 349, 1483–1489 (2015). [DOI] [PubMed] [Google Scholar]
- 24.Schirmer M, D’Amore R, Ijaz UZ, Hall N, Quince C, Illumina error profiles: resolving fine-scale variation in metagenomic sequencing data. BMC bioinformatics 17, 1–15 (2016). [DOI] [PMC free article] [PubMed] [Google Scholar]
- 25.Day MW, The root system of aspen. Am. Midl. Nat. pp. 502–509 (1944). [Google Scholar]
- 26.Vekemans X, Hardy OJ, New insights from fine-scale spatial genetic structure analyses in plant populations. Mol. ecology 13, 921–935 (2004). [DOI] [PubMed] [Google Scholar]
- 27.Drummond AJ, Rambaut A, Shapiro B, Pybus OG, Bayesian coalescent inference of past population dynamics from molecular sequences. Mol. biology evolution 22, 1185–1192 (2005). [DOI] [PubMed] [Google Scholar]
- 28.Hofmeister BT, et al. , A genome assembly and the somatic genetic and epigenetic mutation rate in a wild long-lived perennial populus trichocarpa. Genome Biol. 21, 1–27 (2020). [DOI] [PMC free article] [PubMed] [Google Scholar]
- 29.Mock KE, et al. , Widespread triploidy in western north american aspen (populus tremuloides). PLoS One 7, e48406 (2012). [DOI] [PMC free article] [PubMed] [Google Scholar]
- 30.Clark PU, et al. , The last glacial maximum. science 325, 710–714 (2009). [DOI] [PubMed] [Google Scholar]
- 31.Marshall SJ, James TS, Clarke GK, North american ice sheet reconstructions at the last glacial maximum. Quat. Sci. Rev. 21, 175–192 (2002). [Google Scholar]
- 32.Marchetti DW, Harris MS, Bailey CM, Cerling TE, Bergman S, Timing of glaciation and last glacial maximum paleoclimate estimates from the fish lake plateau, utah. Quat. Res. 75, 183–195 (2011). [Google Scholar]
- 33.DeRose RJ, Mock KE, Long JN, Cytotype differences in radial increment provide novel insight into aspen reproductive ecology and stand dynamics. Can. J. For. Res. 45, 1–8 (2015). [Google Scholar]
- 34.Ally D, Ritland K, Otto S, Can clone size serve as a proxy for clone age? an exploration using microsatellite divergence in populus tremuloides. Mol. Ecol. 17, 4897–4911 (2008). [DOI] [PubMed] [Google Scholar]
- 35.Pandit MK, Pocock MJ, Kunin WE, Ploidy influences rarity and invasiveness in plants. J. Ecol. 99, 1108–1115 (2011). [Google Scholar]
- 36.Ally D, Ritland K, Otto SP, Aging in a long-lived clonal tree. PLoS Biol. 8, e1000454 (2010). [DOI] [PMC free article] [PubMed] [Google Scholar]
- 37.Chybicki IJ, Trojankiewicz M, Oleksa A, Dzialuk A, Burczyk J, Isolation-by-distance within naturally established populations of european beech (fagus sylvatica). Botany 87, 791–798 (2009). [Google Scholar]
- 38.Kuss P, Pluess AR, Ægisdóttir HH, Stöcklin J, Spatial isolation and genetic differentiation in naturally fragmented plant populations of the swiss alps. J. Plant Ecol. 1, 149–159 (2008). [Google Scholar]
- 39.Burian A, Barbier de Reuille P, Kuhlemeier C, Patterns of stem cell divisions contribute to plant longevity. Curr. Biol. 26, 1385–1394 (2016). [DOI] [PubMed] [Google Scholar]
- 40.Gompert Z, et al. , Admixture and the organization of genetic diversity in a butterfly species complex revealed through common and rare genetic variants. Mol. ecology 23, 4555–4573 (2014). [DOI] [PubMed] [Google Scholar]
- 41.Li H, et al. , The sequence alignment/map format and samtools. bioinformatics 25, 2078–2079 (2009). [DOI] [PMC free article] [PubMed] [Google Scholar]
- 42.Dou Y, Gold HD, Luquette LJ, Park PJ, Detecting somatic mutations in normal cells. Trends Genet. 34, 545–557 (2018). [DOI] [PMC free article] [PubMed] [Google Scholar]
- 43.Bouckaert R, et al. , Beast 2: a software platform for bayesian evolutionary analysis. PLoS computational biology 10, e1003537 (2014). [DOI] [PMC free article] [PubMed] [Google Scholar]
- 44.Bouckaert R, et al. , Beast 2.5: An advanced software platform for bayesian evolutionary analysis. PLoS computational biology 15, e1006650 (2019). [DOI] [PMC free article] [PubMed] [Google Scholar]
- 45.Waddell PJ, Steel M, General time-reversible distances with unequal rates across sites:mixing γ and inverse gaussian distributions with invariant sites. Mol. phylogenetics evolution 8, 398–414 (1997). [DOI] [PubMed] [Google Scholar]
- 46.Korneliussen TS, Albrechtsen A, Nielsen R, Angsd: analysis of next generation sequencing data. BMC bioinformatics 15, 1–13 (2014). [DOI] [PMC free article] [PubMed] [Google Scholar]
- 47.Fagri K, Iversen J, Textbook of pollen analysis (3rd version) (1989).
- 48.Kapp RO, Guide to Pollen and Spores. (The American Association of Stratigraphic Palynologists Foundation, College Station, Texas: ), 2nd edition, (2000). [Google Scholar]
Associated Data
This section collects any data citations, data availability statements, or supplementary materials included in this article.