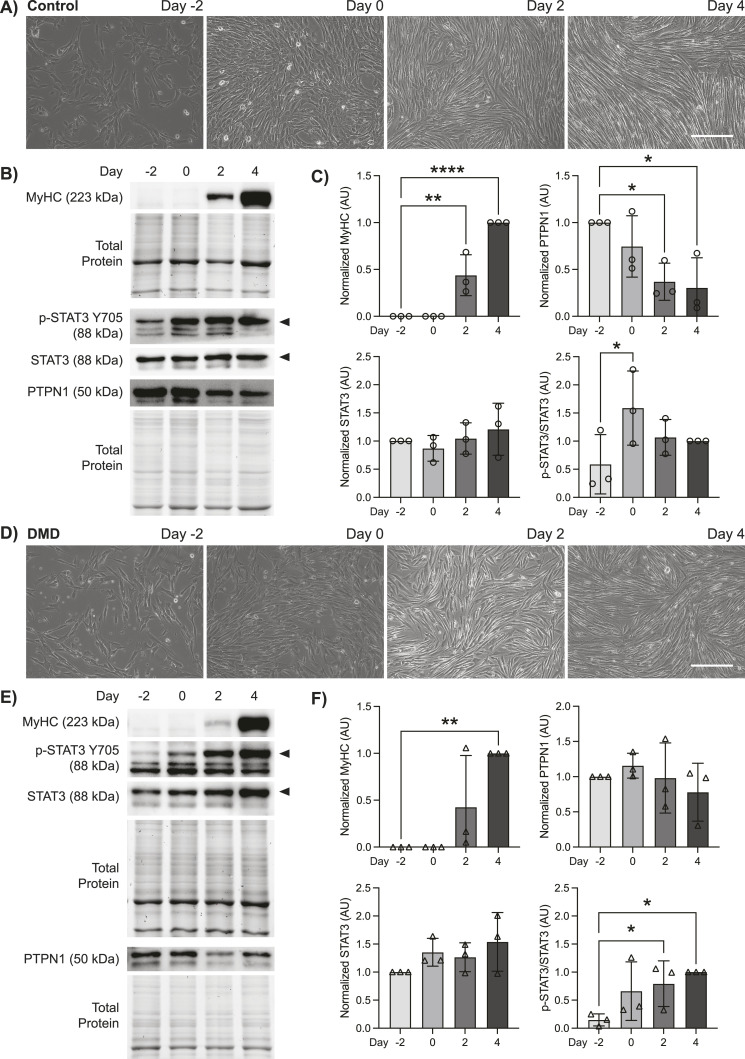
Figure 1. Duchenne muscular dystrophy (DMD) muscle stem cells (MuSCs) exhibit altered PTPN1 expression and STAT3 phosphorylation kinetics during myogenic differentiation.
(A) Control human MuSCs were cultured and differentiated for 4 d. Phase contrast images were taken on days −2, 0, 2, and 4 of differentiation. Scale bar represents 150 μm. (B) Protein expression of MyHC, phosphorylated STAT3 (p-STAT3, Y705), total STAT3, and PTPN1 on days −2, 0, 2, 4 of differentiation in control cells were examined by immunoblot analysis (n = 3 biological replicates per group). (C) Quantification of MyHC, p-STAT3, STAT3, and PTPN1 protein expression levels in control cells. (D) DMD patient-derived MuSCs were subject to differentiation as in (A). (E) Immunoblot analysis and (F) quantification of indicated proteins from DMD cells as described in (B, C). MyHC, STAT3, and PTPN1 were normalized to total protein; p-STAT3 was normalized to total STAT3 (AU; arbitrary units). Data are represented as mean ± SD, *P < 0.05, **P < 0.01, ****P < 0.0001 (one-way ANOVA with Fisher’s uncorrected LSD).
Source data are available for this figure.

