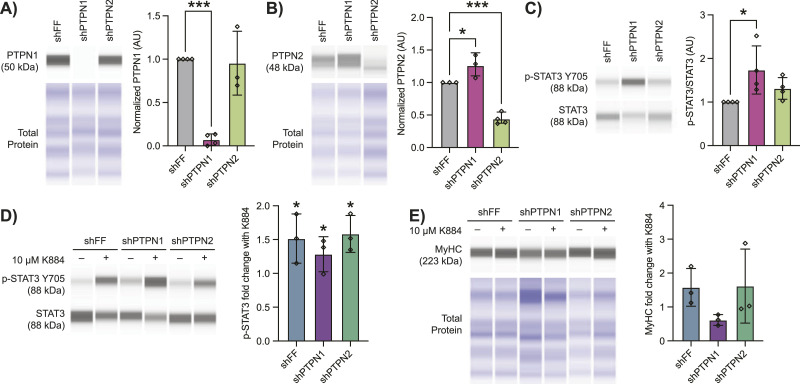
Figure 4. The pro-myogenic effect of K884 in Duchenne muscular dystrophy (DMD) muscle stem cells (MuSCs) is mediated mainly through PTPN1.
DMD muscle stem cells were treated with either control (shFF) or shRNA targeting PTPN1 (shPTPN1) or PTPN2 (shPTPN2). (A, B, C) Simple Western immunoassays of cell lysates from shRNA-treated cells examining (A) PTPN1, (B) PTPN2, and their (C) STAT3 and p-STAT3 levels (n = 3 or 4 replicates, as shown). (D, E) After shRNA treatment, cells were differentiated either in the presence or absence of 10 μM K884 (sterile H2O was used as vehicle). Cells were collected (D) 6 h after initiating differentiation and protein levels of STAT3 and p-STAT3 were quantified (n = 3 replicates), or (E) 4 d after differentiation and protein levels of MyHC were quantified (n = 3 replicates) by Simple Western. (C, D) In (A, B, E), MyHC, PTPN1, and PTPN2 protein levels were normalized to total protein, and in (C, D), p-STAT3 was normalized to total STAT3 (AU; arbitrary units). Data represented in (A, B, C) are normalized to shFF. Data represented in (D, E) are represented as fold-change with K884. Data are represented as mean ± SD, *P < 0.05, ***P < 0.001 (two-way ANOVA with Fisher’s LSD).
Source data are available for this figure.

