Abstract
Dimethylsulfide (DMS) is a climatically active volatile sulfur compound found in Earth’s oceans and atmosphere that plays an important role in cloud formation. DMS originates from its precursor dimethylsulfoniopropionate (DMSP), which is produced by several classes of phytoplankton. Concentrations of DMS and DMSP in Antarctic sea ice, snow and underlying seawater are not well documented and there is currently no dataset available to find the existing data. The purpose of this project was to compile historical measurements into a publicly available dataset. A total of 220 samples collected since 1992 were compiled using the Antarctic Sea ice Processes and Climate program template, in accordance with the existing datasets for chlorophyll-a, macronutrients, and dissolved iron. Analyses performed on the completed DMS dataset showed that the spatial and temporal coverages are limited; there are barely any measurements in autumn and winter, nor in the Amundsen or Ross seas. These findings provide a basis for future sampling efforts in the Antarctic region.
Subject terms: Element cycles, Marine chemistry
Background & Summary
Sea ice plays an important role in the regulation of the Earth system, largely due to its high albedo and the habitat it provides for marine life. Antarctic sea ice is an important habitat for microbial and algal communities both at the ice-water interface and throughout the ice matrix because it retains them near the ocean surface where there is enough sunlight and nutrients for algae to grow1. Dimethylsulfoniopropionate (DMSP) is a bi-product of microbial production that is closely associated with the presence of sea-ice algae2,3. DMSP acts as an osmolyte (compound that regulates osmotic pressure in cells) for aquatic algae in general, but is also thought to act as a cryoprotectant (antifreeze) for these primary producers, allowing them to withstand the extreme gradients in temperature and salinity experienced in the Antarctic environment4. DMSP can remain in sea ice and the water column but can also be converted into dimethylsulfide (DMS) by sea-ice algae or bacteria through enzymatic cleavage5. Unlike DMSP, DMS can transfer from the ice or ocean into the atmosphere. In the atmosphere, DMS is oxidised into sulphur-containing aerosols such as sulfuric acid and methanesulfonic acid, which are known as cloud condensation nuclei1. Therefore, these sulphur particles can increase cloud formation and scattering properties, which can in turn increase the amount of solar radiation reflected by the Earth. Through this mechanism, DMS emission from Antarctic sea ice is likely to translate into increased albedo over the Antarctic region, thereby counteracting some of the positive climate feedbacks6.
DMS is abundant in the oceans around the world, and DMS and DMSP concentrations have both been extensively measured in the tropical and temperate oceans; however remote and inaccessible places such as the polar regions have been less well studied, leading to gaps in our knowledge. Only a handful of studies have explored the concentrations of DMS and DMSP in Antarctic sea ice, showing that the recorded concentrations greatly vary both spatially and seasonally5. Notably, all these data were publicly unavailable, making it difficult for researchers to further our understanding of the roles DMS and DMSP play in the Earth system.
This project aimed to collate as much data as possible from these existing studies into one dataset to advance our understanding of the current spatial and temporal distribution of the data as well as inform future research efforts. From eighteen studies identified in a literature search, we were able to access data from twelve of those studies, either directly from the authors or using the MATLAB File Exchange GRABIT7, totalling 216 samples (Table 1). Data include measurements from both free-floating sea ice (pack ice) and sea ice attached to the Antarctic continent (fast ice)8. As well as sea ice and underlying seawater, measurements are included from snow on top of sea ice, slush, formed when water is introduced to the snow9, and brine that is expelled from the ice matrix during freezing9.
Table 1.
A summary of the studies from which DMS and DMSP data were collected. Studies where GRABIT7 was used are marked with (*).
| Study | Location | Ice type | Season and year | Type of sample | Variable | No. cores/samples |
|---|---|---|---|---|---|---|
| Carnat et al.20,21 | Ross Sea | pack | autumn-winter 2013 | ice core | DMSP | 4 |
| Weddell Sea | pack | winter 2017 | ice core | DMSP | 3 | |
| McMurdo Sound | fast | spring-summer 2011–2012 | ice core | DMSP | 7 | |
| *Damm et al.5 | East Antarctica SIZ | pack | spring 2012 | ice core, slush core | DMSP | 2 |
| *Gambaro et al.22 | Terra Nova Bay | fast | summer 2000–2001 | ice core | DMSP | 5 |
| Nomura et al.23 | Lützow-Holm Bay | fast | summer 2006–2007 | ice core | DMS + DMSP | 6 |
| Nomura et al.24 | Lützow-Holm Bay | fast | summer 2010 | under-ice water, slush | DMS | 14 |
| Tison et al.2 | Western Weddell Sea | pack | spring-summer 2004 | ice core, under ice water, brine | DMS, DMSP | 42 |
| *Trevena and Jones3 | Prydz Bay | pack | summer 1997–1998 | ice core | DMSP | 2 |
| *Trevena et al.25 | Prydz Bay | pack | spring 1997 | ice core | DMSP | 7 |
| *Trevena26 | Prydz Bay | fast | spring 1997 | ice core | DMSP | 12 |
| *Turner et al.27 | Bellingshausen Sea | pack | spring 1992 | ice core | DMSP | 3 |
| Wright and Jones28 | East Antarctica SIZ | pack | spring-summer 1997–1998 | ice core | DMSP | 62 |
| *Zemmelink et al.29 | Weddell Sea | pack | summer 2004 | snow sample | DMS | 47 |
| Total: 216 |
Table 1 summarises the collated data, demonstrating that there is incomplete representation of all sample types and variables. The dataset contains eleven studies that sampled sea ice and slush, two that include under-ice seawater and only one measurement for snow. There are also significantly more DMSP data than the DMS data; the dataset is made up of 38.43% DMS measurements, 58.80% DMSP measurements, and 2.78% combined measurements. This may be because of the relative difficulty of extracting DMS compared to DMSP from sea ice10. This dataset would be more valuable if there were more measurements of DMS added to it as this variable is crucial for biogeochemical model developments.
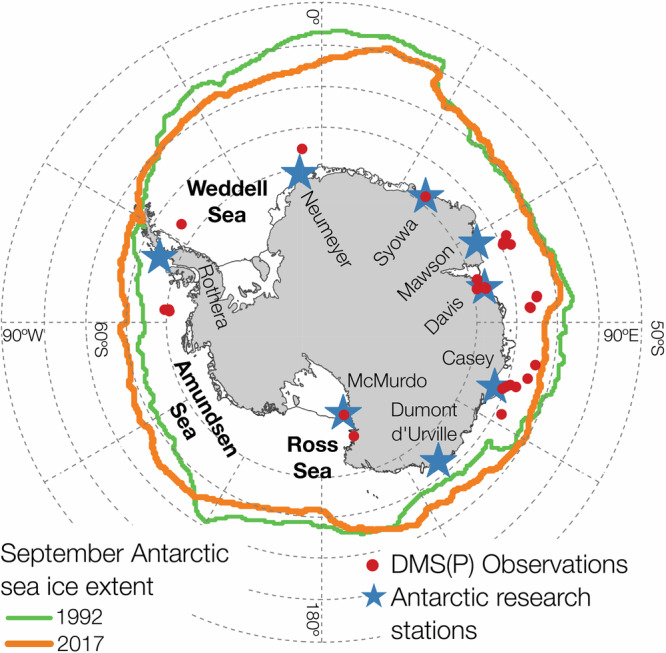
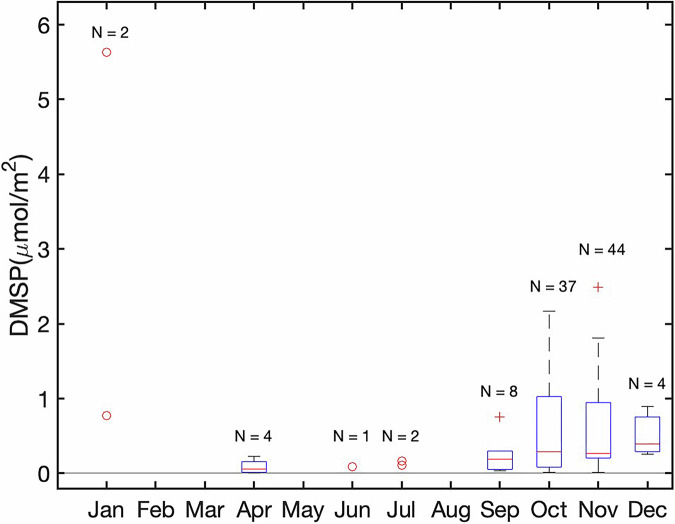
The vast majority of the data were collected during the Austral spring and summer, when there is increased biological activity (Table 1, Fig. 1). The majority of DMS and DMSP samples were collected in East Antarctica and around McMurdo Station, with some near the west Antarctic Peninsula (Fig. 2). There are only three samples included from the Bellingshausen/Amundsen Sea and four from the Ross Sea. The high representation of East Antarctic sites may be because Australian data were the most easily accessible. The Antarctic Sea ice Processes and Climate (ASPeCt)-Bio dataset11, which is the collation of chlorophyll-a (Chla) in Antarctic sea ice, contains more samples with a wider distribution and shows high Chla concentrations in ice cores in the Weddell, Ross and Amundsen seas. More extensive sampling may show that these high Chla areas are also high in DMS due to the biological activity.
Fig. 1.
Temporal analysis of DMSP sea-ice core data in this dataset. The boxplot shows the range of DMSP concentrations for all depth-integrated ice cores against the month in which they were collected. Boxes represent the interquartile range of DMSP concentrations, with lower and upper whiskers showing the nonoutlier minima and maxima, respectively, red lines showing the medians, and the symbol (+) representing the outliers. The thin grey horizontal line marks the DMSP values at 0. Months with insufficient data points are plotted with dots. Sample size for each month is shown as N.
Fig. 2.

Sampling sites for DMS and DMSP from all the studies in Table 1. The red dots mark the locations of the samples, and blue stars the Antarctic research stations. September mean sea-ice extents for the years spanning DMS(P) data records, acquired from National Snow and Ice Data Centre30, are shown for context. Most data were collected in East Antarctica, the Ross Sea or near the Antarctic Peninsula.
Ideally some of the DMS and DMSP data from this dataset may be compared with other variables such as dissolved iron12, macronutrients13, or Chla11,14 from other data compilations (such as ASPeCt-Fe12 or ASPeCt-Bio11,14). However, some of these studies measured DMS from different cores with different depth ranges to the Chla or iron cores, making direct comparison difficult. A cross-comparison of the ASPeCt datasets could still be a valuable undertaking in the future to investigate possible correlations between biogeochemical variables.
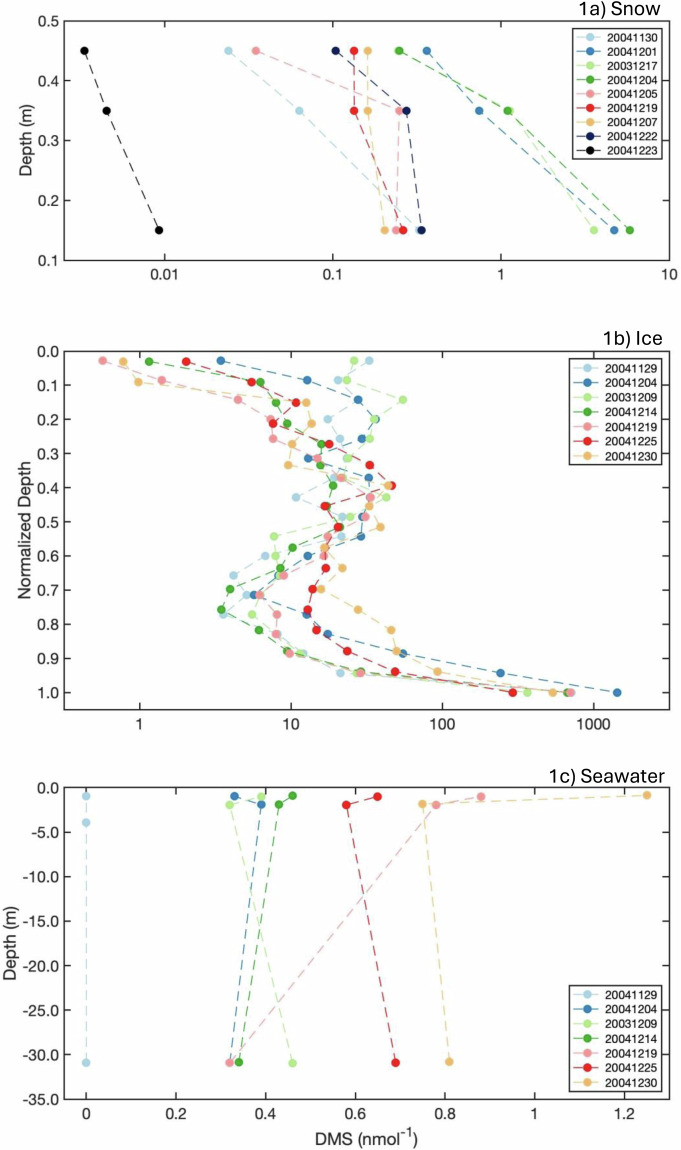
This dataset should provide useful and centralised data for researchers who want to analyse and add to the current understanding of DMS in Antarctica. The dataset can be analysed using any programming language. For a Matlab or Octave user, it can be analysed using a MATLAB ice core analyzer15, to which we have written the accompanying script, ‘DMS Analyzer16’. This script allows the user to easily extract data from the dataset and make profile plots such as Fig. 3, which shows an example of a DMSP depth profile, incorporating the snow, ice and water layers, that can be made using this tool.
Fig. 3.
Example of vertical profiles of (a) snow, (b) sea ice, and (c) under-ice seawater DMS concentrations plotted using the BEPSII DMS Analyzer16, Using data from Tison et al.2. Note that for the middle panel, 0 refers to the air/ice interface and 1 refers to the bottom of the sea ice/ocean interface. Cores/samples are color-coded by date collected.
Methods
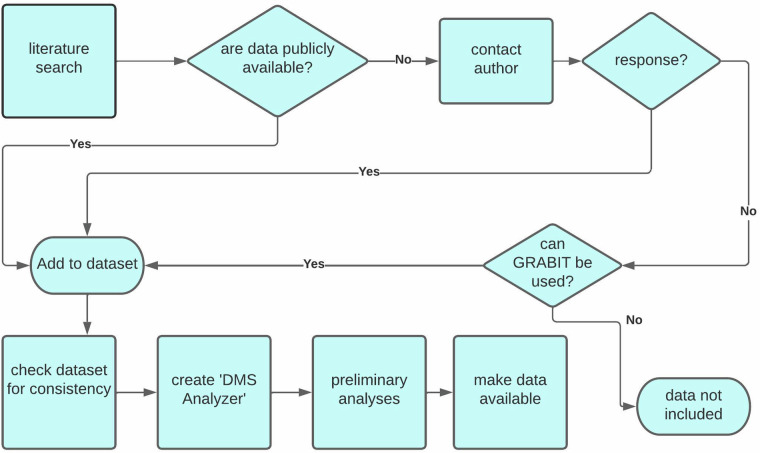
Data collation was conducted in the style of Lannuzel et al.12 and Meiners et al.11 as illustrated in Fig. 4. A comprehensive literature search was carried out using keywords to identify as many studies as possible that had documented measurements of DMS and/or DMSP in Antarctic sea ice, snow or underlying seawater. The information of interest included the sample depths and mean concentrations of DMS and DMSP measured in nanomoles per litre (nmol l−1), for the associated depths. Ancillary data such as nutrients, temperature and Chla concentrations were also recorded, as well as descriptive data for the sampling sites, such as date, coordinates, type of ice, snow and ice thickness, core diameter, etc., which provide key information on the history and properties of the ice for analysis and modelling. These data were sometimes included in the paper, sometimes attached as an appendix to the online publication and occasionally publicly available on one of many online data repositories such as the Australian Ocean Data Network, the Southern Ocean Observing System, the Australian Antarctic Data Centre and the British Oceanographic Data Centre. In cases where the data were not publicly available, the corresponding author was contacted, and we requested they make them available for collation.
Fig. 4.
Workflow diagram depicting the data collation process.
Data were also requested through relevant scientific communities such as the Biogeochemical Exchange Processes at the Sea Ice Interfaces (BEPSII), the Cryosphere and Atmospheric Chemistry (CATCH) activity, the Australian Antarctic Partnership Program (AAPP), the Australian Centre for Excellence in Antarctic Science (ACEAS), the Scientific Committee on Antarctic Research (SCAR) and the Australian Research Council Centre on Excellence for Climate Extremes (CLEX). Where data could not be accessed through any of these means, they were extracted directly from figures using the MATLAB package GRABIT7. Note that in studies in which GRABIT was used, figures did not represent the entire dataset, and the GRABIT software is only fit for the best approximation of the data in the figure. Additionally, there was often no way to find exact dates for the sampled stations, or other ancillary data such as ice thickness or ice type. In these cases, samples were labelled to the month they were collected, with the value ‘00’ for the day. The studies where GRABIT was used are specified in Table 1.
Once the data were acquired, they were collated into the ASPeCt dataset template using Microsoft Excel, to which the fields DMS and DMSP had been added, along with depth ranges for each. Samples were classified as being measurements of ice, snow, slush, seawater or brine, with one excel spreadsheet representing one ice core, snow sample or seawater sample as a vertical profile with section depth ranges. These methods curate the existing data into a standardised format and centralise them into one location, allowing easy analysis over the spatial and temporal scales at which they have been collected. The accompanying script, ‘DMS Analyzer’16 was written in MATLAB, and created to be an extension of the package ‘BEPSII ice core analyzer’15, allowing users to construct vertical profiles and easily analyse these curated data.
These methods curate the existing data into a standardised format and centralise them into one location, allowing easy analysis over the spatial and temporal scales at which they have been collected.
Data Records
This dataset is available at the Australian Antarctic data Centre (AADC) (Metadata URL: DMS_DMSP_Antarctica_Snow_Ice_Seawater_DataCollation, https://data.aad.gov.au/metadata/DMS_DMSP_Antarctica_Snow_Ice_Seawater_DataCollation)17. The dataset consists of folders for measurements of sea ice, snow, slush, seawater and brine. Each excel file represents one sea-ice core, snow or seawater sample as a vertical profile with section depth ranges. It includes ancillary data such as nutrients, temperature and Chla concentrations if available, as well as descriptive data for the sampling sites, such as date, coordinates, type of ice, snow and ice thickness, core diameter, etc.
Technical Validation
No data were produced by the authors; the dataset solely includes measurements from previously published and peer-reviewed studies. Similar collations have already been successfully carried out for historical sea-ice core data relating to other biogeochemical variables such as Chla11, iron12 and macronutrients13,18. These were compiled following the protocols of the Antarctic Sea ice Processes and Climate (ASPeCt) sea ice physics (http://aspect.antarctica.gov.au/) and BEPSII (https://sites.google.com/site/bepsiiwg140 /home) programs. Here, we build on these previous efforts, following the same format, with the goal of creating an ASPeCt dataset (e.g., Meiners et al.11) for DMS and DMSP in Antarctic sea ice, snow and underlying seawater. The dataset consists of Microsoft Excel files following the ASPeCT template, which allows users to easily access the data provided in an identical format. We verify that the collated data are consistent from one another by developing and running the Matlab script ‘DMS Analyzer’16.
Acknowledgements
This project received grant funding from the Australian Government as part of the Antarctic Science Collaboration Initiative program (project ID ASCI000002). GB was supported by the Dean’s Summer Research Scholarship Program, University of Tasmania. DL is funded by an Australian Research Council Future Fellowship FT190100688. The authors would like to acknowledge all the researchers who contributed their data to make this collation possible. The authors would also like to thank Dave Connell and the Australian Antarctic Data Centre for assistance with data and metadata upload, and Martin Vancopenolle for providing the ‘BEPSII Ice Core Analyzer’ script. This project is an activity of the BEPSII working group.
Author contributions
The study was conceptualized by H.H., P.W. and D.L. G.B. carried out the data collation, wrote the DMS Analyzer script, prepared the publication of the data, and wrote the first draft of the manuscript. All authors contributed to and edited the manuscript.
Data availability
No custom code was generated to create this dataset itself, but the DMS Analyzer was used to check the consistency of the data being added to the dataset. The MATLAB package ‘BEPSII Ice Core Analyzer’ can be downloaded using the following link: https://pagesperso.locean-ipsl.upmc.fr/mvlod/. The accompanying script, ‘DMS Analyzer’ was created to assist users with analyses of these data (e.g., Fig. 3), and can be downloaded from Zenodo.com at https://zenodo.org/records/13831861. Figures were generated in MATLAB version R2022b. The code used to generate Figs. 1, 219 is available for download from Zenodo at https://zenodo.org/records/13827062.
Competing interests
The authors declare no competing interests.
Footnotes
Publisher’s note Springer Nature remains neutral with regard to jurisdictional claims in published maps and institutional affiliations.
References
- 1.Tison, J-L., Delille, B. & Papadimitriou, S. in Sea Ice 3rd edn, Ch. 18, 433–471 (John Wiley & Sons, Ltd, 2017).
- 2.Tison, J.-L., Dumont, I. & Stefels, J. High-resolution dimethyl sulfide and dimethylsulfoniopropionate time series profiles in decaying summer first-year sea ice at Ice Station Polarstern, western Weddell Sea, Antarctica. J. Geophysical Research.115, 1–16 (2010). [Google Scholar]
- 3.Trevena, A. J. & Jones, G. B. Dimethylsulphide and dimethylsulphonioproprionate in Antarctic sea ice and their release during sea ice melting. Marine Chemistry.98, 210–222 (2006). [Google Scholar]
- 4.Kirst, G. O. et al. Dimethylsulfonioproprionate (DMSP) in icealgae and its possible biological role. Marine Chemistry.35, 381–388 (1991). [Google Scholar]
- 5.Damm, E., Nomura, D., Martin, Dieckmann, G. S. & Meiners, K. M. DMSP and DMS cycling within Antarctic sea ice during the winter-spring transition. Deep-Sea Research II.131, 150–159 (2016). [Google Scholar]
- 6.Charlson, R. J., Lovelock, J. E., Andreae, M. O. & Warren, S. G. Oceanic phytoplankton, atmospheric sulphur, cloud albedo and climate. Nature.326, 655–661 (1987). [Google Scholar]
- 7.Doke, J. GRABIT. MathWorkshttps://au.mathworks.com/matlabcentral/fileexchange/7173-grabit (2016).
- 8.Fraser, A. D. et al. Antarctic Landfast Sea Ice: A review of its Physics, Biogeochemistry and Ecology. Reviews of geophysics. 61 (2023).
- 9.Sturm, M. & Massom, R. A. in Sea Ice, 3rd edn, Ch. 3, 65–109 (John Wiley & Sons, Ltd, 2017).
- 10.Stefels, J. et al. The analysis of dimethylsulfide and dimethylsulfoniopropionate in sea ice: Dry-crushing and melting using stable isotope additions. Marine Chemistry.128-129, 34–43 (2012). [Google Scholar]
- 11.Meiners, K. M. et al. Chlorophyll a in Antarctic sea ice from historical ice core data. Geophysical Research Letters.39, 1–5 (2012). [Google Scholar]
- 12.Lannuzel, D. et al. Iron in sea ice: Review and new insights. Elementa: Science of the Anthropocene.4, 1–19 (2016). [Google Scholar]
- 13.Henley, S. F. et al. Macronutrient biogeochemistry in Antarctic land-fast sea ice: Insights from a circumpolar data compilation. Marine Chemistry.257, 1–25 (2023).38274497 [Google Scholar]
- 14.Meiners, K. M. et al. Chlorophyll-a in Antarctic Landfast Sea Ice: A First Synthesis of Historical Ice Core Data. J. Geophysical Research Oceans.123, 8444–8459 (2018). [Google Scholar]
- 15.Vancoppenolle, M. A Matlab package to process large-scale sea ice core data. BEPSIIhttps://pagesperso.locean-ipsl.upmc.fr/mvlod/ (2017).
- 16.Burke, G. & Wongpan, P. DMS Analyzer V.2 (Version 2). Zenodohttps://zenodo.org/records/13831861 (2024).
- 17.Lannuzel, D., Wongpan, P., Hayashida, H. & Burke, G. A data collation for climate-cooling gas dimethylsulphide in Antarctic snow, sea ice and underlying seawater. Australian Antarctic Data Centre10.26179/svxw-kt31 (2024). [DOI] [PubMed]
- 18.Fripiat, F. et al. Macro-nutrient concentrations in Antarctic pack ice: Overall patterns and overlooked processes. Elementa: Science of the Anthropocene.5, 1–24 (2016). [Google Scholar]
- 19.Burke, G. & Wongpan, P. Figure documentation for Burke et al. (2024). Zenodohttps://zenodo.org/records/13827062 (2024).
- 20.Carnat, G. et al. Variability in sulfur isotope composition suggests unique dimethylsulfonioproprionate cycling and microalgae metabolism in Antarctic sea ice. Communications Biology.1, 1–9 (2018). [DOI] [PMC free article] [PubMed] [Google Scholar]
- 21.Carnat, G. Carnat_Commsbio-18-0423-T.xlsx. Figsharehttps://figshare.com/s/0d1b7b52d2d8e2ab926b?file=12927443 (2018).
- 22.Gambaro, A. et al. Temporal evolution of DMS and DMSP in Antarctic Coastal Sea water. International J. of Environmental Analytical Chemistry.84, 401–412 (2004). [Google Scholar]
- 23.Nomura, D., Kasamatsu, N., Tateeyama, K., Kudoh, S. & Fukuchi, M. DMSP and DMS in coastal fast ice and under-ice water of Lützow-Holm Bay, eastern Antarctica. Continental Shelf Research.31, 1377–1383 (2011). [Google Scholar]
- 24.Nomura, D. et al. Direct measurements of DMS flux from Antarctic fast sea ice to the atmosphere by a chamber technique. J. Geophysical Research.117, 1–8 (2012). [Google Scholar]
- 25.Trevena, A. J., Jones, G. B., Wright, S. W. & van den Enden, R. L. Profiles of DMSP, algal pigments, nutrients and salinity in pack ice from eastern Antarctica. J. Sea Research.43, 265–273 (2000). [Google Scholar]
- 26.Trevena, A. J. profiles of dimethylsulphoniopropionate (DMSP), algal pigments, nutrients, and salinity in the fast ice of Prydz Bay, Antarctica. J. of Geophysical Research.108, 1–11 (2003). [Google Scholar]
- 27.Turner, S. M., Nightingale, P. D., Broadgate, W. & Liss, P. S. The distribution of dimethyl sulphide and dimethylsulphoniopropionate in Antarctic waters and sea ice. Deep Sea Research II: Tropical Studies in Oceanography.42, 1059–1080 (1995). [Google Scholar]
- 28.Wright, S. & Jones, G. DMS in the Southern Ocean. Australian Antarctic Data Centre10.4225/15/547E5D71810C3 (2000).
- 29.Zemmelink, H. J. et al. CO2 deposition over the multi-year ice of the western Weddell Sea. Geophysical Research Letters.33, 1–4 (2006). [Google Scholar]
- 30.Fetterer, F., Knowles, K., Meier, W. N., Savoie, M. & Windnagel, A. K. Sea Ice Index, Version 3. National Snow and Ice Data Center10.7265/N5K072F8 (2017).
Associated Data
This section collects any data citations, data availability statements, or supplementary materials included in this article.
Data Citations
- Burke, G. & Wongpan, P. DMS Analyzer V.2 (Version 2). Zenodohttps://zenodo.org/records/13831861 (2024).
- Lannuzel, D., Wongpan, P., Hayashida, H. & Burke, G. A data collation for climate-cooling gas dimethylsulphide in Antarctic snow, sea ice and underlying seawater. Australian Antarctic Data Centre10.26179/svxw-kt31 (2024). [DOI] [PubMed]
- Burke, G. & Wongpan, P. Figure documentation for Burke et al. (2024). Zenodohttps://zenodo.org/records/13827062 (2024).
- Carnat, G. Carnat_Commsbio-18-0423-T.xlsx. Figsharehttps://figshare.com/s/0d1b7b52d2d8e2ab926b?file=12927443 (2018).
- Wright, S. & Jones, G. DMS in the Southern Ocean. Australian Antarctic Data Centre10.4225/15/547E5D71810C3 (2000).
- Fetterer, F., Knowles, K., Meier, W. N., Savoie, M. & Windnagel, A. K. Sea Ice Index, Version 3. National Snow and Ice Data Center10.7265/N5K072F8 (2017).
Data Availability Statement
No custom code was generated to create this dataset itself, but the DMS Analyzer was used to check the consistency of the data being added to the dataset. The MATLAB package ‘BEPSII Ice Core Analyzer’ can be downloaded using the following link: https://pagesperso.locean-ipsl.upmc.fr/mvlod/. The accompanying script, ‘DMS Analyzer’ was created to assist users with analyses of these data (e.g., Fig. 3), and can be downloaded from Zenodo.com at https://zenodo.org/records/13831861. Figures were generated in MATLAB version R2022b. The code used to generate Figs. 1, 219 is available for download from Zenodo at https://zenodo.org/records/13827062.


