Abstract
M-DNA is a complex between the divalent metal ions Zn2+, Ni2+ and Co2+ and duplex DNA which forms at a pH of ∼8.5. The stability and formation of M-DNA was monitored with an ethidium fluorescence assay in order to assess the relationship between pH, metal ion concentration, DNA concentration and the base composition. The dismutation of calf thymus DNA exhibits hysteresis with the formation of M-DNA occurring at a higher pH than the reconversion of M-DNA back to B-DNA. Hysteresis is most prominent with the Ni form of M-DNA where complete reconversion to B-DNA takes several hours even in the presence of EDTA. Increasing the DNA concentration leads to an increase in the metal ion concentration required for M-DNA formation. Both poly(dG)•poly(dC) and poly(dA)•poly(dT) formed M-DNA more readily than the corresponding mixed sequence DNAs. For poly(dG)•(poly(dC) M-DNA formation was observed at pH 7.4 with 0.5 mM ZnCl2. Modified bases were incorporated into a 500 bp fragment of phage λ DNA by polymerase chain reaction. DNAs in which guanine was replaced with hypoxanthine or thymine with 5-fluorouracil formed M-DNA at pHs below 8 whereas substitutions such as 2-aminoadenine and 5-methylcytosine had little effect. Poly[d(A5FU)] also formed a very stable M-DNA duplex as judged from Tm measurements. It is evident that the lower the pKa of the imino proton of the base, the lower the pH at which M-DNA will form; a finding that is consistent with the replacement of the imino proton with the metal ion.
INTRODUCTION
The Watson and Crick model of duplex DNA has been the foundation of molecular biology for nearly 50 years. Small variations in the standard B-DNA structure have been well documented (1,2). For example, the A-conformation tends to form at higher ionic strength and is also the conformation favoured by RNA duplexes and mixed RNA/DNA duplexes (3). Z-DNA forms a left-handed rather than right-handed helix but the base pairing is still of the Watson–Crick form. The Z-conformation is favoured by alternating pyrimidine/purine sequences, the replacement of cytosine with 5-methylcytosine (m5C) and the addition of multivalent cations (4). Normal B-DNA has antiparallel strands but it is possible by the use of sequence constraints to force a parallel-stranded structure (5). However, even in this case, Watson–Crick base pairing is maintained. On the other hand, several structures have been reported that contain other types of base pairing.
Three-stranded or triplex structures have attracted considerable interest recently because they may be involved in long range DNA/DNA interactions and also form the basis of antigene therapies (6–8). Triplexes are based on a standard Watson–Crick duplex with the third strand being added with Hoogsteen hydrogen bonding (6). In general, the underlying duplex must be pyrimidine•purine and the third strand either all pyrimidine or all purine. The resulting pyrimidine•purine•pyrimidine triplex is stabilised by low pH and the presence of m5C while the pyrimidine•purine•purine triplex requires multivalent cations for formation (9,10). Both types of triplex are inhibited by the incorporation of 7-deazapurines which interfere with Hoogsteen hydrogen bonds (6,11). Four-stranded helices have also been described based on the guanine quartet motif (12). An interesting aspect of the tetraplex is the dramatic stabilisation by ions such as K+ and Ba2+ which are bound inside the helix to the 6-keto groups of the guanines (13).
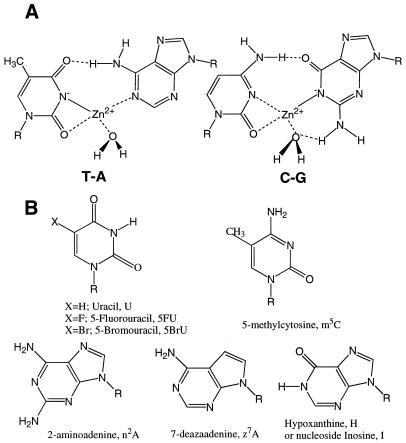
Another metal complex, called M-DNA, can be formed between duplex DNA and Zn2+, Ni2+ or Co2+ at pHs above 8.5 (14). The complex can be converted back to B-DNA by either lowering the pH or adding EDTA to remove the metal ion (14). However, as with other dismutations of DNA, hysteresis occurs (4,15–17); that is, once M-DNA is formed it will remain in this conformation under conditions where B-DNA will not convert to M-DNA. Several lines of evidence suggest that the metal ion is replacing the imino protons of G and T (Fig. 1A). First, one proton is released per metal ion per base pair upon formation of M-DNA (18). Secondly, the imino protons disappear from the proton NMR spectrum on addition of the metal ion (14). As well, the intercalating drug, ethidium bromide, will not bind to M-DNA presumably because the metal ion repels the positively charged drug molecule (14,18). The lack of ethidium binding forms the basis of a rapid fluorescence assay; briefly, if B-DNA is added to a pH 8.3 buffer containg ethidium and 0.2 mM Zn2+ the ethidium will bind and the fluorescence will be enhanced. If M-DNA is added to the same buffer the conversion to B-DNA is very slow, ethidium does not bind and there is no enhancement of fluorescence (14). By addition of EDTA, the M-DNA is converted back to B-DNA and the fluorescence is restored. The addition of EDTA also serves to distinguish between M-DNA and denatured DNA since the latter does not bind ethidium with or without EDTA.
Figure 1.
(A) Proposed structure of the base pairs of M-DNA. (B) Structure of the modified nucleosides with the corresponding abbreviations for the bases.
The circular dichroism, UV spectra and electrophoretic behaviour of M-DNA are all similar to that of B-DNA (14,18). On the other hand, M-DNA has the remarkable property of allowing electron transfer through the DNA helix. Direct measurements have demonstrated that B-DNA is a semiconductor with a wide band gap whereas M-DNA shows metallic conduction (19). Similarly, electron transfer can be shown to occur between donor and acceptor fluorophores at opposite ends of M-DNA duplexes (18). In the presence of a DNA-binding protein the electron transfer is blocked. Therefore, M-DNA may be useful as a building block in nanoelectronics or as a biosensor for DNA-binding molecules.
However, studies on M-DNA are complicated by the very narrow range of conditions under which it will form. If the pH is too high the DNA can be denatured or the metal ion can precipitate, and if the pH is too low then M-DNA will not form. Therefore, it would be advantageous to find methods to stabilise M-DNA at lower pH. Since the sequence of the DNA or the incorporation of unusual bases can have a dramatic effect on the preferred conformation of nucleic acids, we have prepared repeating sequence DNAs and DNA duplexes containing several modified bases and assessed their ability to stabilise M-DNA. The structures of the nucleosides and the abbreviations for the bases are shown in Figure 1B. Here we report that poly(dG)•poly(dC) forms M-DNA at pHs within the physiological range. As well, the incorporation of hypoxanthine in place of guanine or 5-fluorouracil (5FU) in place of thymine gives rise to more stable forms of M-DNA at lower pH whereas m5C and 7-deazaadenine (z7A) have little effect or are destabilising. Both hypoxanthine and 5FU have lower pKas than the usual bases which is consistent with the requirement of replacing the imino protons of the bases with the metal ion during the formation of M-DNA.
MATERIALS AND METHODS
Nucleic acids
The synthetic DNAs poly(dG)•poly(dC), poly[d(GC)], poly[d(GGCC)], poly(dA)•poly(dT), poly[d(AT)] and poly[d(A5FU)] were synthesised with Escherichia coli DNA polymerase as described previously (16,17). Poly[r(AU)] was transcribed from poly[d(AT)] with E.coli RNA polymerase (20). Calf thymus DNA (CT-DNA) was purchased from Sigma. All other DNAs were synthesised by means of the polymerase chain reaction (PCR). Template DNA for PCR was either λ phage DNA (Amersham Pharmacia Biotech) or a plasmid, 0.54 src-cat, containing the human c-src proto-oncogene (gift from Dr K. Bonham, Saskatoon Cancer Center). Primers for both templates were purchased from the Calgary Regional DNA Synthesis Laboratory. Primers for the λ genome amplified between bases 13 and 509; 496 bp total with a GC content of 54%. The sequences of primers were as follows: λ-13, d(GCGGGTTTTCGCTATTATG); λ-509, d(CAGCGGAGTCTCTGGCATTC).
Primers for the 0.54 src-cat plasmid amplified a 73% GC 516 bp region between bases –793 and –277 of the upstream non-coding sequence of the c-src gene. The sequences of the primers were as follows: C-src-(–793), d(TGAGCAGCTTAGCATGGCGC); C-src-(–277), d(GCAGACGGACGCACGGGAGG).
Standard deoxyribonucleic acid triphosphates (dNTPs) and Taq DNA polymerase were purchased from Amersham Pharmacia Biotech. Tth DNA polymerase was purchased from Roche. Vent DNA polymerase was purchased from New England Biolabs. 5-Methyl-2′-deoxycytidine-5′-triphosphate, 2′-dexoxyuridine-5′-triphosphate and 2′-deoxyinosine-5′-triphosphate were purchased from P-L Biochemicals. 2-Amino-2′-deoxyadenosine-5′-triphosphate, 5-fluoro-2′-deoxyuridine-5′-triphosphate, 5-bromo-2′-deoxyuridine-5′-triphosphate and 7-deaza-2′-deoxyadenosine-5′-triphosphate were purchased from Trilink Biotechnologies.
Substitution of 5-methyl-2′-deoxycytidine-5′-triphosphate for 2′-deoxycytidine-5′-triphosphate was performed with Vent DNA polymerase. Substitution of 2-amino-2′-deoxyadenosine-5′-triphosphate for 2′-deoxyadenosine-5′-triphosphate required Tth DNA polymerase. All other substitutions were performed with Taq DNA polymerase. All PCRs contained 0.25 mM of each dNTP, 15 µM (in phosphates) of template DNA and 9.6 µM of each primer. The appropriate buffer (as suggested by the supplier) was used for each polymerase, and Mg2+ concentrations were optimised separately for each different PCR. Cycling conditions were 30 s each at 94, 45 and 72°C for Taq and Vent DNA polymerase. PCRs with Tth DNA polymerase were cycled at 94°C for 2 min, then 10 cycles of 94°C for 30 s, followed by 50°C for 30 s, followed by 72°C for 45 s. Twenty more cycles followed, with each successive 72°C step being elongated by 5 s and a final 72°C step of 2 min.
All DNAs were purified using the Concert Rapid PCR purification system (Gibco BRL).
Ethidium fluorescence assays
The basic assay has been described previously; B-DNA binds ethidium bromide and fluoresces, M-DNA does not. Addition of EDTA chelates the metal ion and converts any M-DNA back to B-DNA.
Effect of substituted bases
Aliquots of 100 µl of 15 µM DNA (in bases) in 4 mM 2-[N-cyclohexylamino]ethanesulfonic acid, pH 9.0 (CHES; Sigma) with 10 mM NaCl were converted to M-DNA by addition of 0.2 mM ZnCl2 and incubation for 2 h. Following M-DNA formation, 2 ml of ethidium fluorescence buffer (EFB) was added to each sample, as well as to samples of B-DNA, giving a final DNA concentration of 0.71 µM. The EFB contained 10 mM buffer, 0.2 mM ZnCl2 and 0.5 µg/ml ethidium bromide. Control experiments demonstrated that the ethidium did not increase the pHm by more than 0.2 pH units (see Results and Discussion). Six pHs of EFB were used; pH 6.0 with 2-[N-morpholino]ethanesulfonic acid (MES) buffer, pH 7.5, 7.75, 8.0, 8.3 and 8.6 with Tris–HCl buffer. The aliquots were incubated in the EFB for 30 min then the emission at 600 nm was read following excitation at 525 nm in a Hitachi F-2500 fluorescence spectrophotometer. EDTA was added to a final concentration of 1.0 mM following each measurement, and the fluorescence was remeasured. All values are reported as percentage B-DNA normalised against the pH 6.0 reading which is taken as 100% B-DNA.
Comparison of metal ions
Aliquots of 100 µl of 15 µM λ 496mer in 4 mM CHES pH 9 with 10 mM NaCl were converted to M-DNA by addition of 0.2 mM ZnCl2, 0.3 mM NiCl2 or 0.5 mM CoCl2. The aliquots were incubated for 2 h with and without metal ion added. Following M-DNA formation, 100 µl of 25 mM buffer with 10 mM NaCl was added to the incubation, giving a final DNA concentration of 7.5 µM and the metal ion concentration was adjusted to 0.25 mM in all cases. The pH values of the buffers added were 5.0, 5.5 (sodium acetate), 6.0, 6.5 (MES buffer), 7.0 (N-[2-hydroxyethyl]piperazine-N′-[2-ethanesulfonic acid] [HEPES]), 7.5, 8.2, 8.5 (Tris buffer), and 9.0 (CHES buffer). The mixture was allowed to incubate for 10 min, then assayed immediately in EFB, pH 8.3, before and after EDTA addition.
Measurement of reversion of Ni- and Co-M-DNA to B-DNA over time
A 75 µM solution of CT-DNA in 20 mM CHES pH 9.0 with 10 mM NaCl was incubated in the presence of 0.5 mM NiCl2 or CoCl2 for 2 h to form M-DNA. Following this, EDTA was added at concentrations from 0.1 to 1.0 mM. Aliquots (20 µl) were taken over a period of 22 h and the fluorescence read immediately in the EFB, pH 8.3.
Effect of DNA concentration on M-DNA formation
CT-DNA was dissolved in 20 mM Tris–HCl pH 8.5 or 20 mM CHES pH 9.0 with 10 mM NaCl to a concentration of 4.5, 7.5, 15, 45, 75, 150 and 450 µM. ZnCl2, NiCl2 and CoCl2 were added to aliquots of the DNA over a concentration range of 0.1–1.0 mM and incubated for 2 h. Following incubation, aliquots containing 1.3 nmol of DNA were added to 2 ml of EFB and read immediately before and after addition of EDTA. The concentration of metal ion required for 50% M-DNA formation was estimated by interpolation.
Thymidine analogue pKas
The pKa values for 5FU and 5-bromouracil (5BrU) were unavailable in the literature. Uridine, 5-bromouridine and 5-fluorouridine (Sigma) were dissolved to 10 mM and titrated with 1 N NaOH. The pKa values obtained were 9.3, 8.2 and 7.8 for uridine, 5-bromouridine and 5-fluorouridine, respectively. The value of 9.3 for uridine is in agreement with a previous report (21).
Thermal denaturation profiles
Tm measurements were made on a Gilford 600 spectrophotometer equipped with a thermoprogrammer with a DNA concentration of 50 µM (bases). The buffer contained 5 mM NaCl with 10 mM HEPES (pH 7.0) or 10 mM Tris (pH 7.5, 8.0, 8.5) or 10 mM CHES pH 9.0 with 0.2 mM ZnCl2 as appropriate.
RESULTS AND DISCUSSION
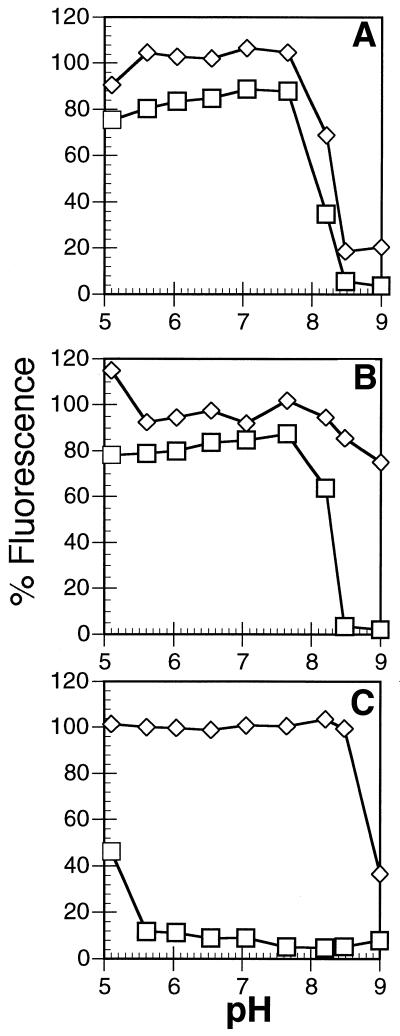
The ethidium fluorescence assay was used to investigate the effects of pH on the conversion of B- to M-DNA and that of M- to B-DNA for all three metal ions with phage λ DNA (Fig. 2). Control experiments showed that no denaturation occurred even at the highest pH. Incubation of B-DNA with 0.25 mM Zn2+ for 10 mins at pH 8.2 is sufficient for partial conversion to M-DNA and nearly complete conversion occurs at pH 8.5. In the opposite direction (i.e. M-DNA to B-DNA) the curve is shifted by ∼0.3 pH units to the left and thus the dismutations show some hysteresis under these conditions. As well, even incubation of M-DNA at pH 6 for 10 min causes the reformation of only ∼80% of the original B-DNA. However, the addition of EDTA at any pH (see below) (or prolonged incubation at low pH) causes the reformation of 100% B-DNA. Therefore, none of the DNA is being denatured and particular sequences may be exceptionally stable in the M-DNA conformation.
Figure 2.
Conversion of phage λ B-DNA to M-DNA (diamonds) and M-DNA to B-DNA (squares) as a function of pH after incubation for 10 min with 0.25 mM metal ion. (A) ZnCl2; (B) CoCl2; and (C) NiCl2. Each point is the average of at least three independent measurements.
In the presence of 0.25 mM Co2+ the conversion of M-DNA to B-DNA is similar to that with Zn2+. However, Co2+ is much less effective at converting B-DNA to M-DNA compared with Zn2+ and complete conversion does not occur under these conditions in 10 min even at pH 9. With Ni2+ the conversion of M-DNA to B-DNA is intermediate between that of Zn2+ and Co2+ but once formed the Ni complex is remarkably stable and reconversion to B-DNA is only observed at pHs below 6.
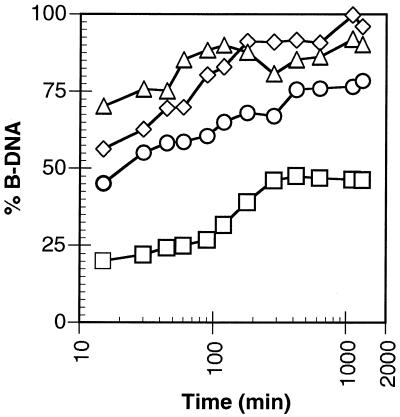
Upon addition of EDTA the metal ion is chelated and M-DNA is converted back to B-DNA as shown in Figure 3 for CT-DNA. For the Zn form of M-DNA the conversion occurs within seconds (data not shown). In contrast, the Ni form and Co form require up to 2 h for the reconversion when 1 mM EDTA is added to 0.5 mM of metal ion. As well, if only 0.5 mM EDTA is added only partial conversion to B-DNA is observed.
Figure 3.
Conversion of CT M-DNA to B-DNA at pH 8.5 after the addition of EDTA. Co-M-DNA with 0.5 mM EDTA (circles) and 1 mM EDTA (triangles). Ni-M-DNA with 0.5 mM EDTA (squares) and 1 mM EDTA (diamonds)
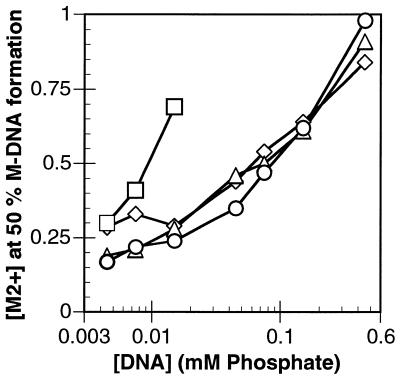
As previously described, increasing the metal ion concentration increases the conversion to M-DNA but as shown in Figure 4 the concentration of CT-DNA also effects the dismutation. At a DNA concentration of 15 µM (in bases) and a pH of 8.5, 50% conversion to M-DNA occurs with 0.25 mM Zn2+ but with 150 µM DNA 0.6 mM Zn2+ is required and for 1.5 mM DNA 50% conversion cannot be achieved at a concentration of ZnCl2 which remains soluble. The Co form of M-DNA is similar to the Zn form but conversion of the Ni complex to M-DNA at pH 8.5 cannot be achieved above a DNA concentration of 10 µM. It is clear that higher DNA concentrations require more metal ion than that which is required to replace the imino protons. A possible explanation is that the negatively charged phosphates on the DNA backbone must be saturated before the metal can occupy sites within the helix. However, at pH 9.0 the Ni form of M-DNA can be prepared readily at much lower concentrations of NiCl2. In addition, the slopes of the plots for NiCl2 are different at pH 8.5 and 9.0 suggesting that the structure of the Ni2+ aquo ion may be important for the formation of M-DNA.
Figure 4.
The metal ion concentration required for 50% conversion of CT B-DNA to M-DNA as a function of the DNA concentration. Diamonds, ZnCl2 at pH 8.5; triangles, CoCl2 at pH 8.5; squares, NiCl2 at pH 8.5; circles, NiCl2 at pH 9.0.
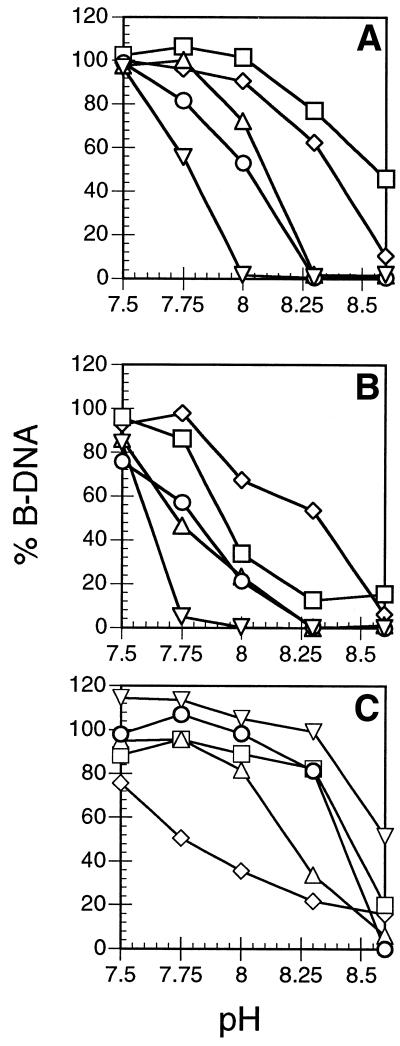
The effect of base substitutions was investigated by incorporating them by PCR into a 500 bp fragment of phage λ DNA. The interconversion of B- and M-DNA was again studied by the ethidium fluorescence assay but the conditions were altered in order to be able to study all the modified DNAs under identical conditions (see Materials and Methods). Therefore, the resulting data of Figure 5 for the Zn form is not directly comparable with that of Figure 2A. It is useful to define a pHm value which is the pH at which 50% M-DNA and 50% B-DNA coexist. Figure 5A shows the conversion of B-DNA to M-DNA for several modifications and the results are summarised in Table 1. For unmodified DNA the pHm value is 8.4 whereas for 5BrU-modified DNA it is 8.1. Other pyrimidine substitutions such as uracil and 5FU also reduce the pHm value whereas incorporation of m5C has little effect (Table 1). In the case of purine substitutions, hypoxanthine-modified DNA has a pHm value that is decreased by ∼0.5 pH units, whereas for z7A the pHm value is 8.2 and for n2A increases to ∼8.6. A double modification was assessed by preparing the 500 bp fragment containing both 5BrU and hypoxanthine. (The yields from PCR of the fragment containing 5FU and hypoxanthine were too low to be studied by the ethidium fluorescence assay.) In this case the pHm value dropped to ∼7.8. Table 1 also lists the pKa for each base and it is clear that lowering the pKa of the base lowers the pHm value of the transition. The pHm value was also measured for the reconversion of M-DNA to B-DNA (Fig. 5B) and in general the values are ∼0.1–0.3 pH units lower than for B-DNA to M-DNA, again demonstrating hysteresis. One exception is n2A-modified DNA for which the difference in pHm value for the forward and back dismutations is ∼0.6 pH units. A 500 bp fragment with a 73% GC content was prepared from the c-src gene promoter region. In this case the pHm value is ∼0.2 units lower (B- to M-DNA) and 0.4 units lower (M- to B-DNA) than for the λ DNA fragment which is 54% GC. Therefore, some GC rich sequences may be exceptionally stable as M-DNA.
Figure 5.
Effect of base substitutions in phage λ DNA on (A) the conversion of B-DNA to M-DNA and (B) the conversion of M-DNA to B-DNA with 0.2 mM ZnCl2. Squares, n2A; diamonds, control; triangles, hypoxanthine; circles, BrU; inverted triangles, BrU and hypoxanthine. (C) The conversion of B-DNA to M-DNA for repeating sequence nucleic acids. Diamonds, poly(dG)•poly(dC); triangles, poly[d(GGCC)]; squares, poly[d(GC)]; circles, poly[d(AU)]; inverted triangles, poly[r(AU)].
Table 1. Effect of base substitutions on the formation and stability of M-DNA with 0.2 mM ZnCl2.
| DNA | pKa | pHm B- to M-DNA | pHm M- to B-DNA |
|---|---|---|---|
| Control 54% GC |
T = 9.9; G = 9.4 |
8.4 |
8.3 |
| c-src 73% GC |
– |
8.2 |
7.9 |
| 2-Aminoadenine |
– |
8.6 |
8.0 |
| 7-Deazaadenine |
– |
8.2 |
8.0 |
| 5-Methylcytosine |
– |
8.5 |
8.2 |
| Hypoxanthine |
H = 8.8 |
8.1 |
7.8 |
| Uracil |
U = 9.3 |
8.3 |
8.1 |
| 5-Bromouracil |
5BrU = 8.2 |
8.0 |
7.8 |
| 5-Fluorouracil |
5FU = 7.8 |
7.9 |
7.7 |
| 5-Bromouracil/hypoxanthine |
5BrU = 8.2/H = 8.8 |
7.8 |
7.6 |
| Poly(dG)•Poly(dC) |
– |
7.8 |
7.6 |
| Poly[d(GGCC)] |
– |
8.2 |
7.8 |
| Poly[d(GC)] |
– |
8.5 |
8.3 |
| Poly(dA)•Poly(dT) |
– |
8.1 |
7.8 |
| Poly[d(AT)] |
– |
8.6 |
8.4 |
| Poly[d(AU)] |
U = 9.3 |
8.4 |
8.1 |
| Poly[r(AU)] | U = 9.3 | 8.5 | 8.1 |
The pHm is defined as the pH at which 50% conversion occurs either for B- to M-DNA or M- to B-DNA. The pKa is for the imino protons of T- or G-type bases.
In order to investigate the effects of the sequence in more detail, several synthetic DNAs were evaluated (Fig. 5C and Table 1). For the conversion of B- to M-DNA poly(dG)•poly(dC) has a pHm value of 7.8 compared with 8.5 for poly[d(GC)] with poly[d(GGCC)] having an intermediate value. For AT sequences the homopolymer poly(dA)•poly(dT) also has a lower pHm value than the alternating polymer poly[d(AT)] (pHm values of 8.1 and 8.6, respectively). Therefore, purine•pyrimidine tracts form M-DNA most readily, presumably because the repeating sequence with all purines on one strand allows for better stacking interactions. Alternatively, purine•pyrimidine tracts tend to be overwound compared with B-DNA (1). M-DNA is also overwound relative to B-DNA so that the increased twist of these sequences might facilitate M-DNA formation (14). Finally, the duplex RNA poly[r(AU)] behaves like poly[d(AT)] and poly[d(AU)] so that the M-conformation is also available to RNA sequences.
The pHm measurements were performed with 0.2 mM metal ion. However, at a lower pH, higher metal ion concentrations can be used before precipitation occurs. For example, at pH 7.4 with 1 mM ZnCl2 the doubly substituted DNA (0.71 µM) is completely converted to M-DNA and at pH 7.1 the 5FU-substituted DNA will form ∼15% M-DNA. Similarly, poly(dG)•poly(dC) is completely converted to the M conformation at pH 7.4 with 0.5 mM ZnCl2.
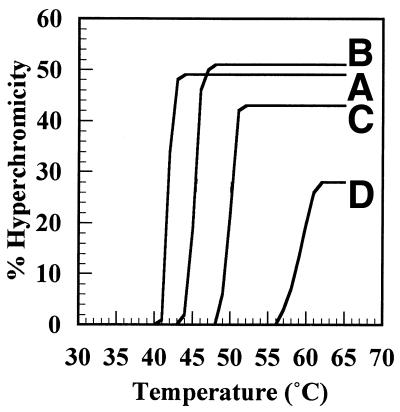
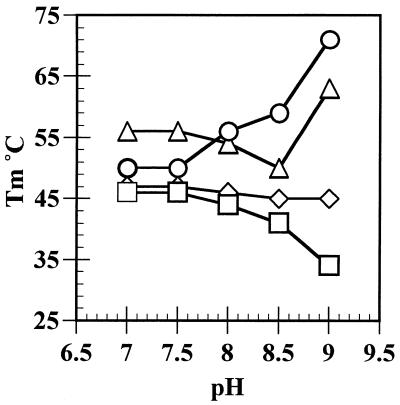
The effect of incorporating 5FU was studied further by preparing poly[d(A5FU)] and measuring thermal denaturation profiles with and without ZnCl2 at pHs between 7 and 9. As shown in Figure 6 at pH 8.5 the Tm value of poly[d(AT)] is increased by 5°C upon addition of 0.2 mM ZnCl2; such an increase is not unexpected since the ionic strength of the buffer is increased and a similar ΔTm is observed upon addition of MgCl2 (22). For the modified polymer the corresponding ΔTm upon addition of Zn2+ is ∼15°C and the unexpectedly large increase is attributed to the formation of M-DNA. The results for all pHs are summarised in Figure 7. In the absence of Zn2+ the Tm of poly[d(A5FU)] decreases as the pH increases reflecting the pKa of 7.8 for 5FU. However, the decrease is small so that incorporation of modified bases does not lead to denaturation of the DNA under the standard conditions. A similar decrease in the Tm value is not observed for poly[d(AT)] since the pKa of T is 9.9. At pH 8 the increased stability of poly[d(A5FU)] in the presence of Zn2+ is ∼10°C and nearly 40°C at pH 9. For poly[d(AT)] an additional increase in the Tm value upon addition of Zn2+ is only observed at pH 9. Therefore, for poly[d(AT)] M-DNA forms at pH 9.0 whereas for poly[d(A5FU)] it occurs 1 pH unit lower.
Figure 6.
Thermal denaturation profiles for poly[d(AT)] and poly[d(A5FU)] with and without 0.2 mM ZnCl2 at pH 8.5. (A), poly[d(A5FU)]; (B), poly[d(AT)]; (C), poly[d(AT)] with 0.2 mM ZnCl2; (D), poly[d(A5FU)] with 0.2 mM ZnCl2.
Figure 7.
The effect of pH on the Tm of poly[d(AT)] and poly[d(A5FU)] with and without 0.2 mM ZnCl2. Diamonds, poly[d(AT)]; squares, poly[d(A5FU)]; triangles, poly[d(AT)] with 0.2 mM ZnCl2; circles, poly[d(A5FU)] with 0.2 mM ZnCl2.
CONCLUSION
The conditions under which M-DNA will form have been explored in detail with an ethidium fluorescence assay. At present this is the only convenient assay to monitor the conversion to M-DNA because the spectroscopic properties and circular dichroism in the UV region are so similar to B-DNA (14). In the visible region, Zn2+ complexes are colourless and the extinction coefficients for the Ni2+ and Co2+ forms of M-DNA are too small to allow accurate measurements. It is clear that M-DNA formation depends on the nature and concentration of the metal ion as well as the pH. Somewhat suprisingly, the DNA concentration is also important even when the metal ion is in vast excess, and places a further and unexpected constraint on the conditions under which M-DNA will form. As a further complication, hysteresis occurs so that M-DNA can remain metastable under conditions in which it will not form. This is particularly true of the Ni form which is very refractive to reconversion to B-DNA (Fig. 3).
The proposed structure of M-DNA (Fig. 1) requires replacement of the imino protons of G and T with the metal ion. The present results are consistent with this model because decreasing the pKa of the base decreases the pHm and increases the thermal stability of the M-DNA. Conversely, modifications to A and C result in smaller changes in the pHm because these bases do not lose a proton. Since hypoxanthine and 5FU are readily incorporated into DNA both chemically or by DNA polymerases, it is now possible to form M-DNA under a wider range of conditions particularly at lower pH. With 1 mM ZnCl2 M-DNA will form at physiological pHs. A reduction in the pHm value of 0.5 pH units allows approximately a 10-fold increase in the metal ion concentration that can be used before precipitation occurs (J.S.Lee and P.Aich, unpublished data). Therefore, structural studies by crystallography and NMR that have proved to be intractable in the past, may now be attempted with greater confidence. As well, the discovery that RNA can form a related metal complex increases the range of applications in the areas of biosensing and DNA/RNA chips.
Does M-DNA have a biological role? Initially this seemed unlikely because of the requirement for such a high pH but the present results suggest that M-DNA might form under special conditions. First, mammalian sperm contain high concentrations of zinc with an internal pH of ∼8.2 (23–25). Since poly(dG)•poly(dC) forms M-DNA at pHs ∼7.4, then this and perhaps other sequences may be in the M-DNA conformation. Secondly, in most cells the concentration of Zn2+ is much lower (26) but the M-DNA helix is more tightly wound than B-DNA (14) so that local regions of positive supercoiling may favour M-DNA formation particularly in G•C tracts. Finally, 5FU is a common agent for cancer chemotherapy and it is converted into nucleosides and nucleotides in vivo. Although the drug inhibits thymidilate synthase, it is also incorporated into RNA and DNA; and the level of incorporation into DNA appears to correlate well with toxicity to the cell (27,28). It is known that incorporation of 5FU alters the conformation of DNA which contributes to its cytotoxicity (29). However, incorporation of 5FU also favours M-DNA formation at pH 7.4 and this too may be detrimental to DNA metabolism.
Acknowledgments
ACKNOWLEDGEMENTS
This work was funded by CIHR and NSERC (Canada) by grants to J.S.L. and by an NSERC graduate scholarship to D.O.W.
REFERENCES
- 1.Dickerson R.E. (1992) DNA structure from A to Z. In Lilley,D.M.J. and Dahlberg,J.E. (eds), Methods in Enzymology. Academic Press Inc., San Diego, Vol. 211, pp. 67–111. [DOI] [PubMed]
- 2.Malinina L., Fernandez,L.G., Huynh-Dinh,T. and Subirana,J.A. (1999) Structure of the d(CGCCCGCGGGCG) dodecamer: a kinked A-DNA molecule showing some B-DNA features. J. Mol. Biol., 285, 1679–1690. [DOI] [PubMed] [Google Scholar]
- 3.Mooers B.H.M., Schroth,G.P., Baxter,W.W. and Ho,P.S. (1995) Alternating and non-alternating hexanucleotides crystallize as canonical A-DNA. J. Mol. Biol., 249, 772–784. [DOI] [PubMed] [Google Scholar]
- 4.Rich A., Nordheim,A. and Wang,A.H.J. (1984) The chemistry and biology of Z-DNA. Annu. Rev. Biochem., 53, 791–846. [DOI] [PubMed] [Google Scholar]
- 5.van de Sande J.H., Ramsing,N.B., Germann,M.W., Elhorst,W., Kalisch,B.W., Kitzing,E.V., Pon,R.T., Clegg,R.C. and Jovin,T.M. (1988) Parallel stranded DNA. Science, 241, 551–557. [DOI] [PubMed] [Google Scholar]
- 6.Soyfer V.N. and Potaman,V.N. (1995) In vivo significance of triple-stranded nucleic acid structures. In Triple-helical Nucleic Acids. Springer, New York, pp. 220–252.
- 7.Chan P.P. and Glazer,P.M. (1997) Triplex DNA: fundamentals, advances and potential applications. J. Mol. Med., 75, 267–282. [DOI] [PubMed] [Google Scholar]
- 8.Thomas R.M., Thomas,T., Wada,M., Sigal,L.H., Shirahata,A. and Thomas,T.J. (1999) Facilitation of the cellular uptake of a triplex-forming oligonucleotide by novel polyamine analogues. Biochemistry, 38, 13328–13337. [DOI] [PubMed] [Google Scholar]
- 9.Frank-Kamentskii M.D. and Mirkin,S.M. (1995) Triplex DNA structures. Annu. Rev. Biochem., 64, 65–95. [DOI] [PubMed] [Google Scholar]
- 10.Plum E.G., Pilch,D.S., Singleton,S.F. and Breslauer,K.J. (1995) Nucleic acid hybridization: triplex stability and energetics. Annu. Rev. Biophys. Biomol. Struct., 24, 319–350. [DOI] [PubMed] [Google Scholar]
- 11.Latimer L.J.P. and Lee,J.S. (1991) Ethidium does not fluoresce when intercalated adjacent to 7-deazaguanine in duplex DNA. J. Biol. Chem., 266, 13849–13851. [PubMed] [Google Scholar]
- 12.Zakian V.A. (1995) Telomeres: beginning to understand the end. Science, 270, 1601–1607. [DOI] [PubMed] [Google Scholar]
- 13.Sen D. and Gilbert,W. (1990) A sodium–potassium switch in the formation of four stranded G4-DNA. Nature, 344, 410–414. [DOI] [PubMed] [Google Scholar]
- 14.Lee J.S., Latimer,L.J.P. and Reid,R.S. (1993) A cooperative conformational change in duplex DNA induced by Zn2+ and other divalent metal ions. Biochem. Cell Biol., 71, 162–168. [DOI] [PubMed] [Google Scholar]
- 15.Olivas W.M. and Maher,L.J.,III (1995) Overcoming potassium-mediated triplex inhibition. Nucleic Acids Res., 23, 1936–1941. [DOI] [PMC free article] [PubMed] [Google Scholar]
- 16.Hampel K.J., Crosson,P. and Lee,J.S. (1991) Polyamines favour DNA triplex formation at neutral pH. Biochemistry, 30, 4455–4459. [DOI] [PubMed] [Google Scholar]
- 17.Lee J.S., Woodsworth,M.L., Latimer,L.J.P. and Morgan,A.R. (1984) Pyr.Pur DNAs containing 5-methylcytosine form stable triplexes at neutral pH. Nucleic Acids Res., 12, 6603–6613. [DOI] [PMC free article] [PubMed] [Google Scholar]
- 18.Aich P., Labiuk,S.L., Tari,L.W., Delbaere,L.J.T., Roesler,W.J., Falk,K.J., Steer,R.P. and Lee,J.S. (1999) M-DNA: a complex between divalent metal ions and DNA which behaves as a molecular wire. J. Mol. Biol., 294, 477–485. [DOI] [PubMed] [Google Scholar]
- 19.Rakitin A., Aich,P., Papadopoulos,C., Kobzar,Y., Vedeneev,A.S., Lee,J.S. and Xu,J.M. (2001) Metallic conduction through engineered DNA: DNA nanoelectronic building blocks. Phys. Rev. Lett., 86, 3670–3673. [DOI] [PubMed] [Google Scholar]
- 20.Hall K., Cruz,P. and Chamberlin,M.J. (1985) Extensive synthesis of poly[r(GC)] using E. coli RNA polymerase. Arch. Biochem. Biophys., 236, 47–51. [DOI] [PubMed] [Google Scholar]
- 21.Saenger W. (1984) Physical properties of nucleotides. In Cantor,C.R. (ed.), Principles of Nucleic Acid Structure. Springer-Verlag, New York, pp. 110–112.
- 22.Eichorn G.L. and Shin,Y.A. (1968) Interaction of metal ions with polynucleotides and related compounds XII. J. Am. Chem. Soc., 90, 7323–7328. [DOI] [PubMed] [Google Scholar]
- 23.Henkel R., Bittner,J., Weber,R., Huther,F. and Miska,W. (1999) Relevance of zinc in human sperm and its relation to motility. Fertil. Steril., 71, 1138–1143. [DOI] [PubMed] [Google Scholar]
- 24.Lindsay L.L and Clark,W.H. (1992) Preloading of micromolar intracellular Ca2+ during capitation of Syyonia ingentis sperm. J. Exp. Zool. , 262, 219–229. [DOI] [PubMed] [Google Scholar]
- 25.Harraway C., Berger,N.G. and Dubin,N.H. (2000) Semen pH in patients with normal versus abnormal sperm characteristics. Am. J. Obstet. Gynecol., 182, 1045–1047. [DOI] [PubMed] [Google Scholar]
- 26.Rennert O.M. and Chan,W.Y. (1984) Genetic diseases: models for the study of trace metals. In Metabolism of Trace Metals in Man. CRC Press, Boca Raton, Vol. 2, pp. 133–140.
- 27.Chu E., Lai,G.M., Zinn,S. and Allegra,C.J. (1990) Resistance of a human ovarian cancer line to 5-fluorouracil associated with decreased levels of 5-fluorouracil in DNA. Mol. Pharmacol., 38, 410–417. [PubMed] [Google Scholar]
- 28.Schuetz J.D., Wallace,H.J. and Diasio,R.B. (1984) 5-fluorouracil incorporation into DNA of CF-1 mouse bone marrow cells as a possible mechanism of toxicity. Cancer Res., 44, 1358–1363. [PubMed] [Google Scholar]
- 29.Kremer A.B., Mikita,T. and Beardlsley,G.P. (1987) Chemical consequences of the incorporation of 5-fluorouracil into DNA as studied by NMR. Biochemistry, 26, 391–397. [DOI] [PubMed] [Google Scholar]


