

Abstract
Anatomical and physiological evidence indicates that, in addition to area MT, much of the cortex in the caudal superior temporal sulcus (STS) of the macaque has visual functions. Yet the organization of areas outside of MT remains unclear, and there are even conflicting data on the boundaries of MT itself. To examine these issues, we recorded from neurons throughout this region in three monkeys. Anterograde or retrograde tracers were injected into MT at the conclusion of recording to identify its projection fields. Based on differences in their visuotopic organization, neuronal properties, receptive field size, myeloarchitecture, and pattern of connections with MT, several visual areas were distinguished within the caudal STS.
Area MT, defined as the heavily myelinated portion of the striate (VI) projection zone in STS, contained a systematic representation of only about the central 30°–40° of the contralateral field. The far peripheral field was represented medial to MT in MTp, which we had previously found receives projections from far peripheral V1 and V2 (Ungerleider and Desimone: J. Comp. Neurol. 248:147–163, 1986). Like MT, MTp contained a high proportion of directionally selective cells, and receptive field size in MTp was the size expected of MT fields if the latter were to extend into the periphery.
Areas MST (medial superior temporal) and PP (posterior parietal) were found medial to MT and MTp. Both MST and PP had a high proportion of directionally selective cells, but only MST received a direct projection from MT. Cells in MST had larger receptive fields than those in either MT or MTp but nonetheless displayed a crude visuotopic organization. Receptive fields of cells in PP were even larger, some including the entire contralateral visual field. Furthermore, unlike cells in MST, some in PP responded to auditory or somesthetic stimuli in addition to visual stimuli.
Area FST, which has a distinctive myeloarchitecture, was found anterior to MT in the fundus of the STS, for which it is named. FST received a direct projection from MT, but only about a third of its cells were directionally selective. Receptive fields of cells in FST were large, often included the center of gaze, and often crossed into the ipsilateral visual field.
Area V4t (transitional V4) and a portion of V4 were found lateral to MT within the STS, and both received direct projections from MT. V4t has a distinctive, light myelination. Both areas had a low incidence of directionally selective cells, and both contained coarse representations of the lower visual field.
The neuronal properties of areas in the caudal STS suggest that MT, MTp, MST, and PP, together with the superior temporal polysensory area, constitute a cortical system for motion analysis. At successive stages in this system, neurons appear to integrate motion information over an increasingly large portion of the retina, respond selectively to more complex types of motion, and respond to inputs from additional sensory modalities.
Keywords: visual system, extrastriate cortex, area MT, parietal lobe, motion
In tracing the visual pathway from striate to extrastriate cortex through area MT, we and others have found that MT in the macaque supplies inputs to a large cortical region surrounding it within the caudal superior temporal sulcus (Ungerleider et al., ’82; Maunsell and Van Essen, ’83a; Ungerleider and Desimone, ’86b). Yet the visual organization of the cortex surrounding MT within the superior temporal sulcus (STS) remains almost completely unknown. Some of the cortex outside of MT has been reported to contain directionally selective cells (Van Essen et al., ’81; Sakata et al., ’83; Saito et al., ’84), but it is not known how much of the cortex beyond MT is directionally selective, whether it is visuotopically organized, how many discrete visual areas it contains, or how the properties of areas that receive direct MT projections compare to those of surrounding areas that do not. Even the borders of MT have been uncertain, as some report that MT extends beyond the heavily myelinated zone in the STS (Gattass and Gross, ’81), while others report that it ends precisely at the borders of the heavily myelinated zone (Van Essen et al., ’81).
To increase our understanding of the organization of the caudal STS, we recorded from neurons throughout this region in three monkeys. At each recording site, the receptive field was mapped, and the cells were tested for both directional selectivity and the modality of sensory inputs. To facilitate identification of MT’s projection fields, anterograde or retrograde tracers were injected into MT in all three monkeys at the conclusion of recording.
Although we found that the cortex in the caudal STS did not contain precise maps of the visual field, it could be divided into a number of separate areas on the basis of a combination of factors, including visuotopic organization, neuronal properties, receptive field size, myeloarchitecture, and pattern of connections with MT. Based on these and other considerations, we propose that MT may be the source of inputs to a hierarchical system for motion analysis that includes several different visual areas.
METHODS
Three Macaca fascicularis weighing 2.7, 3.4, and 4.5 kg were used. We recorded from each animal six or seven times over a period of 3–4 weeks. At the end of the recording period, two of the animals (cases 1 and 2) received a unilateral injection of tritiated amino acids into MT, and the third animal (case 3) received unilateral injections of two fluorescent dyes, fast blue (FB) and diamidino yellow (DY), which were placed at different sites in MT. In the present paper, the description of the anatomical results is limited to findings that relate to our physiological results in the STS; the complete anatomical results from cases 1 and 3 are presented in the following paper (Ungerleider and Desimone, ’86b: see cases 6 and 7, respectively). As most of the physiological, anatomical, and histological procedures have been described in detail either previously (Desimone and Gross, ’79; Ungerleider et al., ’84) or in the two companion papers (Ungerleider and Desimone, ’86a,b), only new methods will be described here.
During the recording session, the animal was initially anesthetized with halothane, paralyzed with pancuronium bromide, and then maintained under 70% nitrous oxide and 30% oxygen anesthesia. End-tidal CO2 and body temperature were continuously monitored. In each case, 35–62 electrode penetrations were made in a grid. Penetrations were made in a plane angled 20° from the stereotaxic frontal plane in order to intersect the STS roughly perpendicularly. Rows of penetrations were made laterally to medially across the STS, and all penetrations within a row were completed within the same recording session. Penetrations within a row were spaced 0.5–2.0 mm apart, and rows were spaced a minimum of 2 mm apart. In previous recordings, we found that if rows were spaced less than 2 mm apart, a row of penetrations from one recording session could intermix with a row from a previous session, due to shifts of the brain resulting from damage to the cortical surface, infarcts, etc. A small lesion (4 μA, 20 seconds) was made at the end of each penetration to facilitate later identification.
Action potentials from several neurons or “multi units” were recorded with varnish-coated tungsten microelectrodes with exposed tips of 20–30 μm. The receptive field, directional specificity, and modality specificity of the neurons at each site were assessed at a minimum of 0.5-mm intervals along each penetration. Receptive fields were plotted on an 85-cm-diameter translucent plastic hemisphere. The length, width, orientation, and location of each receptive field were entered into a PDP-11 computer, which graphically displayed the receptive field sequence along each row of penetrations. The results, both physiological and anatomical, were plotted onto two-dimensional reconstructions of the STS, as described in the preceding paper (Ungerleider and Desimone, ’86a).
Visual stimuli were slits or spots of light or, occasionally, three-dimensional objects moved along the surface of the hemisphere. All stimuli ranged from 0.25° to 20° in length and width. Responses were evaluated by using an audio monitor of cellular activity. Cells were classified as directionally selective if two opposite directions of motion elicited a reliable difference in response, as judged by ear. If a cell did not respond to stimuli moved along the surface of the hemisphere, we tested it with expanding and contracting spots of light or with objects moving toward or away from the monkey’s eye (movement in depth). Receptive fields were plotted by using the optimal stimulus derived for each cell. Somesthetic stimuli consisted of gentle strokes to the skin and hair, and auditory stimuli consisted of clicks, tones, and human vocalizations.
RESULTS
Distribution of receptive field properties in STS
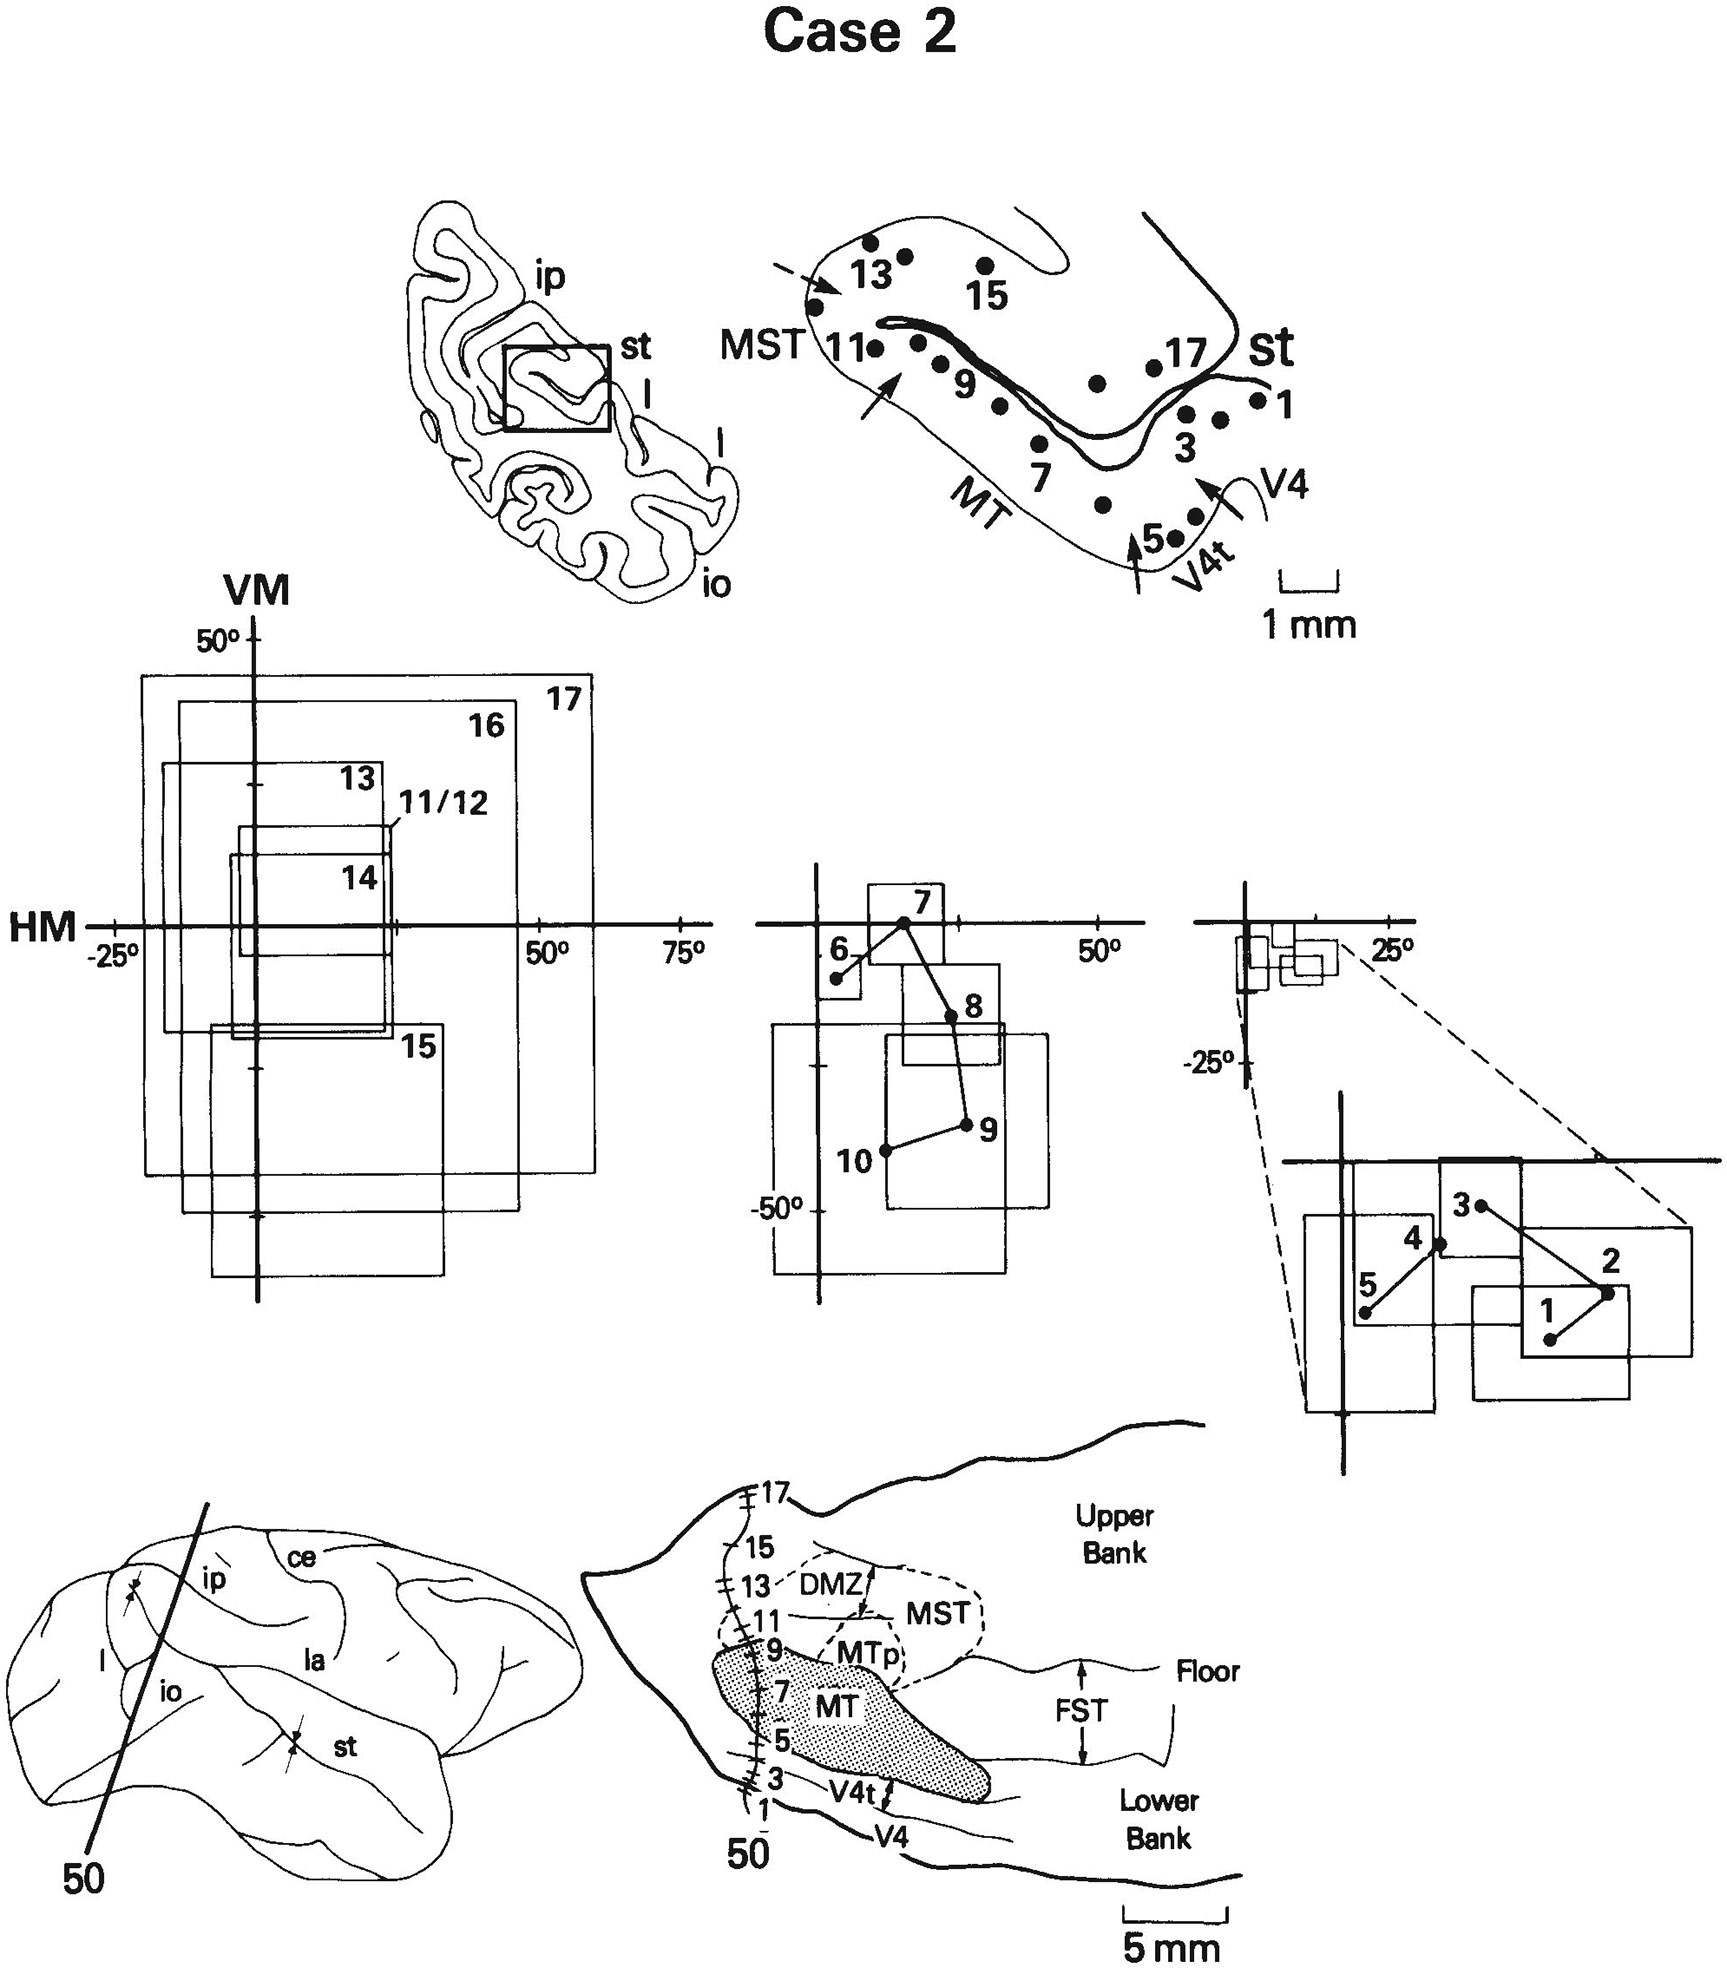
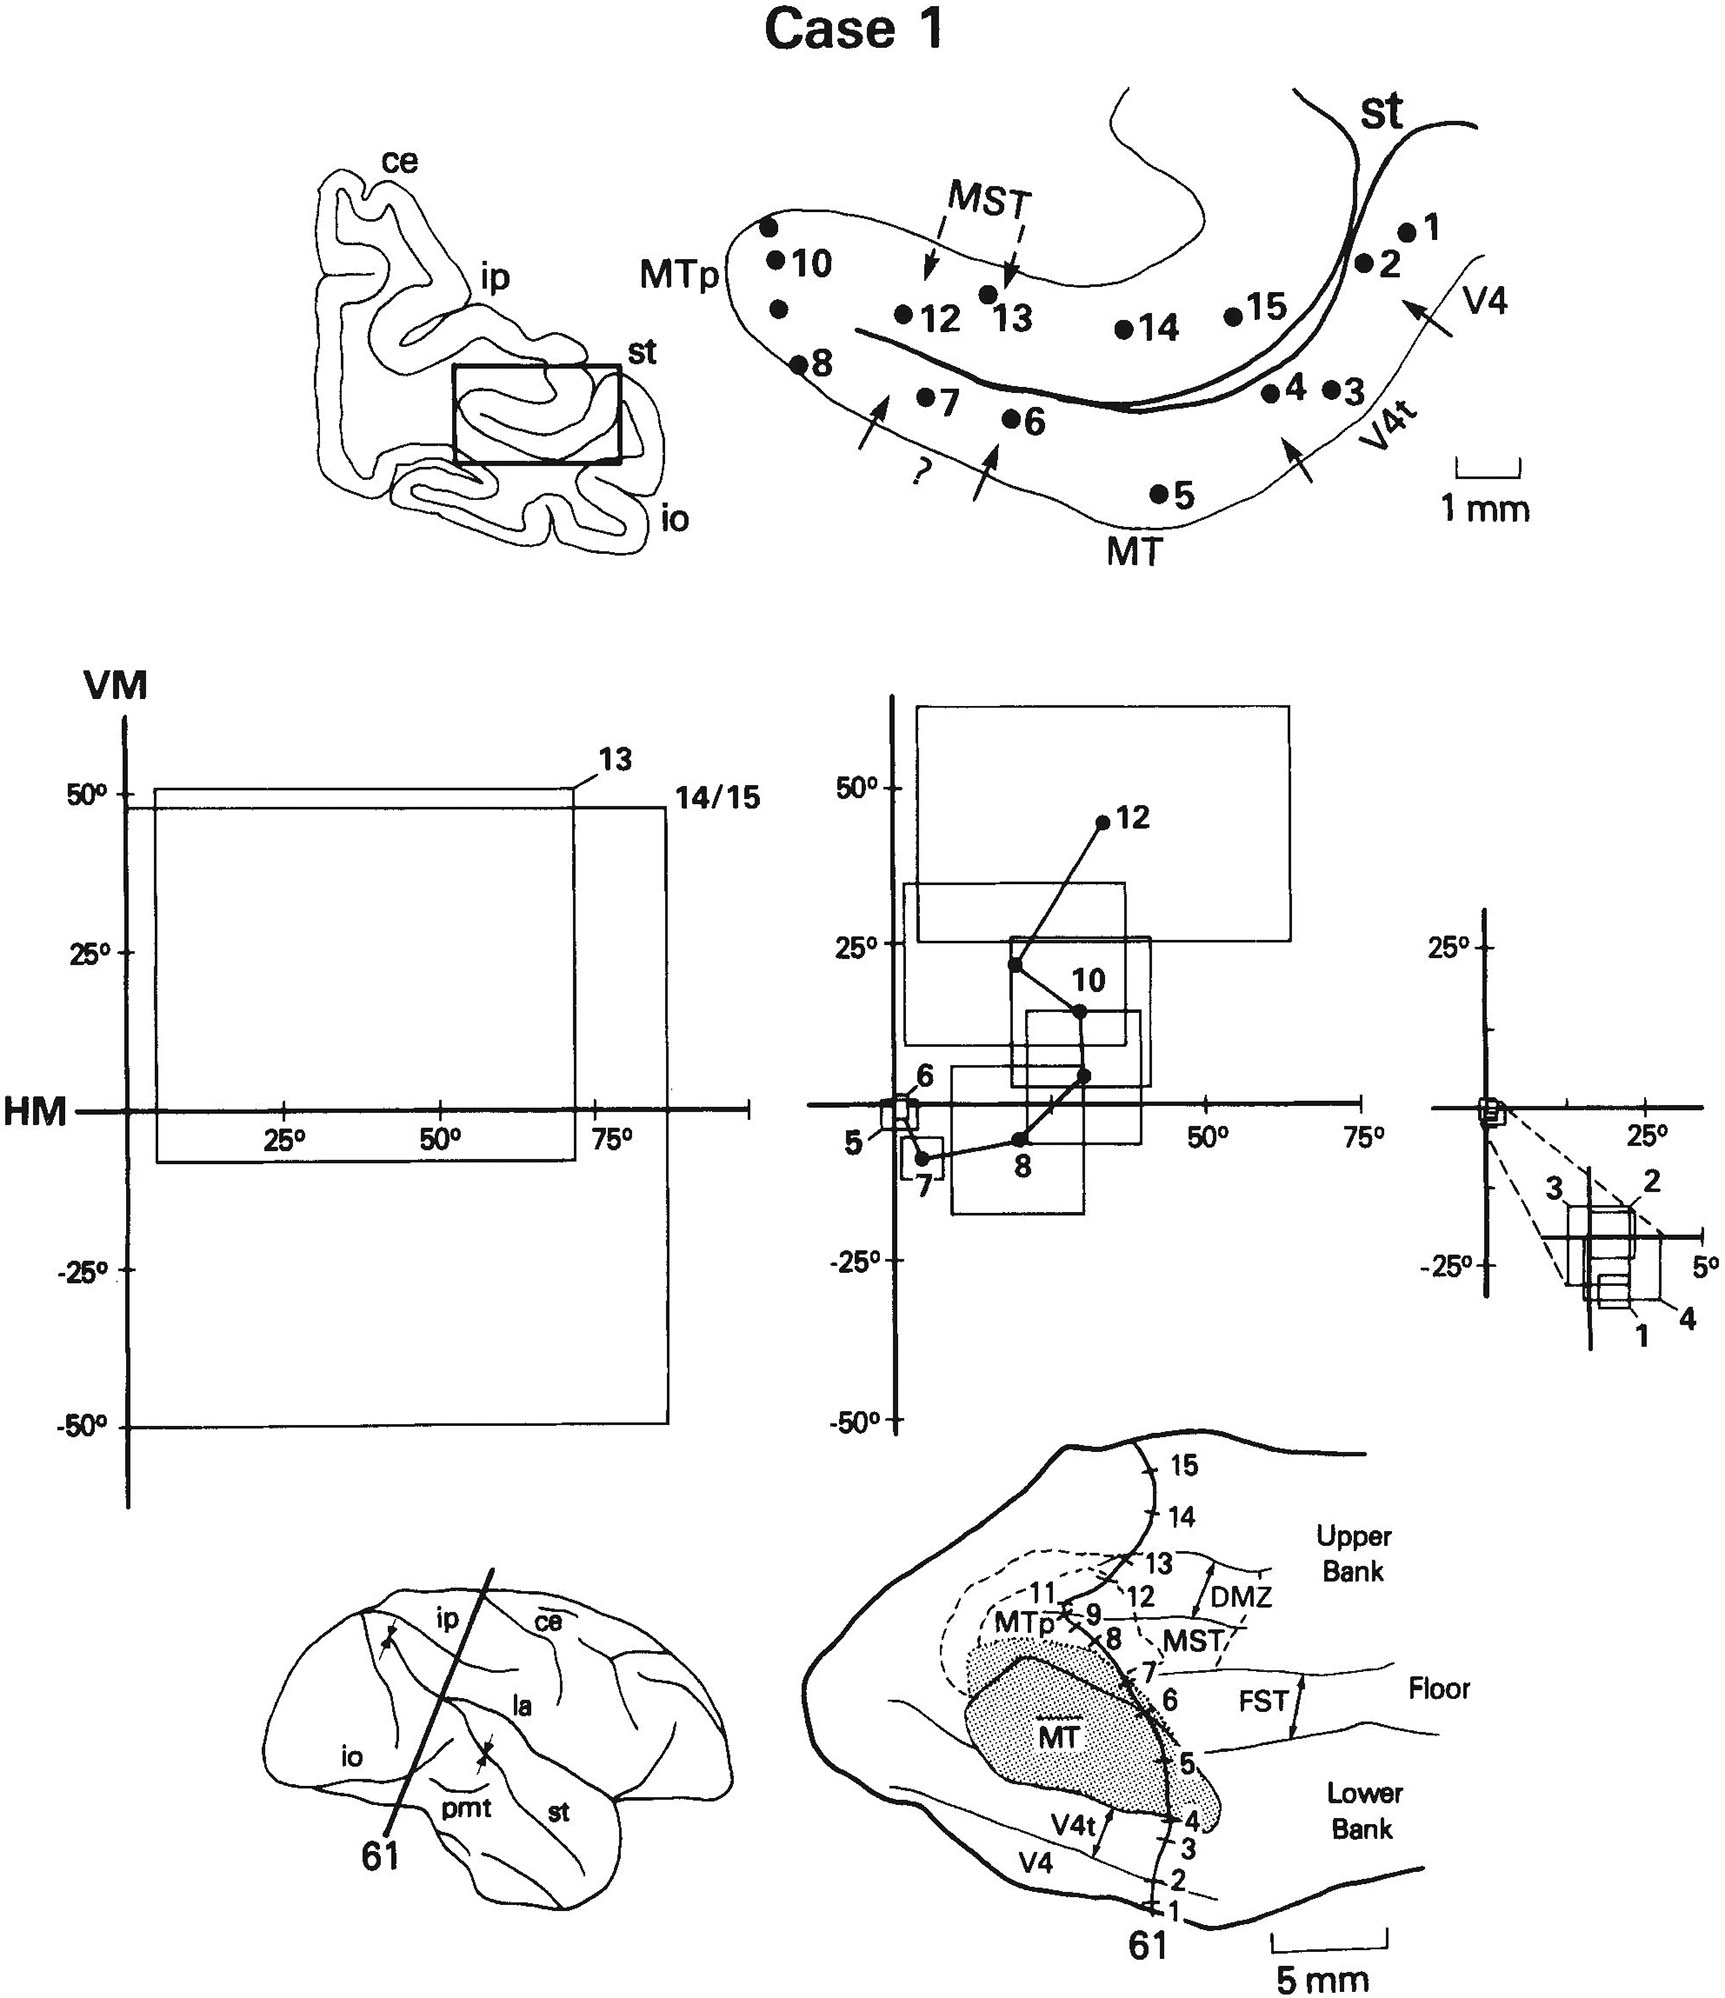
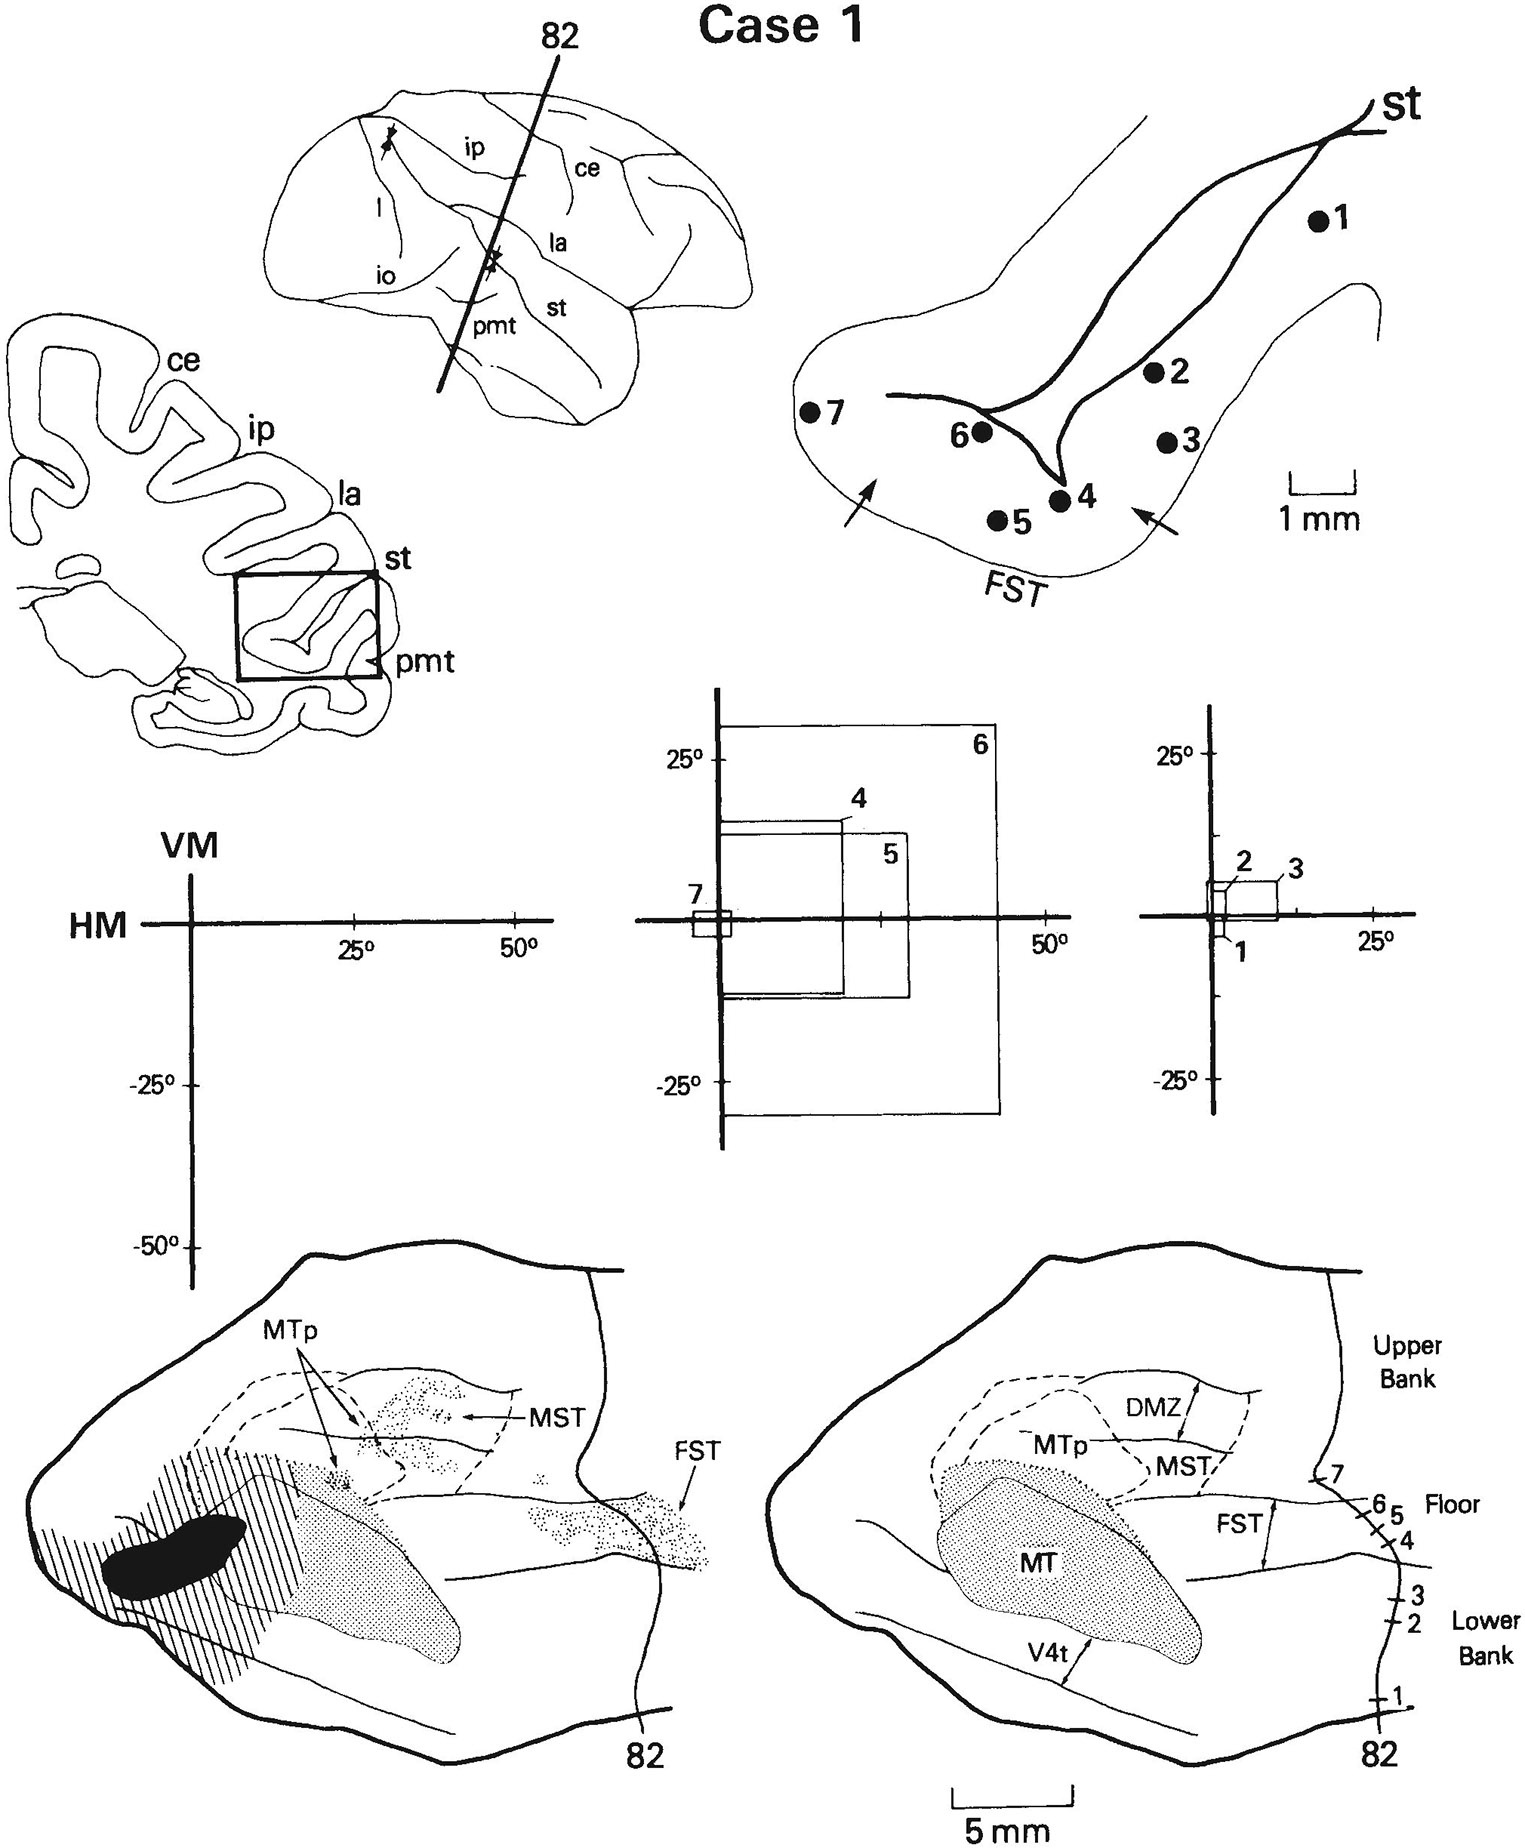
A total of 533 visually responsive sites on 158 penetrations through MT and the surrounding cortex were recorded in the three cases. We have defined MT to be the heavily myelinated portion of the striate (V1) projection field in the STS and MTp to be the less heavily myelinated portion of the projection field (Ungerleider and Desimone, ’86a). MT projects into virtually all of the cortex surrounding it in the STS (Maunsell and Van Essen, ’83a; Ungerleider and Desimone, ’86b), but within this cortical region we could distinguish several different areas on the basis of differences in visuotopic organization, neuronal properties, and myeloarchitecture. The areas include V4, V4t, FST, and MST. Figure 1 shows for each case the location of these areas on two-dimensional reconstructions of the caudal STS. In case 1, the medial boundary of MT was not as sharp as in the other cases, in that there appeared to be a small zone with myelination of intermediate density just medial to the most heavily myelinated zone. To be conservative, we have included this region with myelination of intermediate density in MT (see Fig. 1).
Fig. 1.
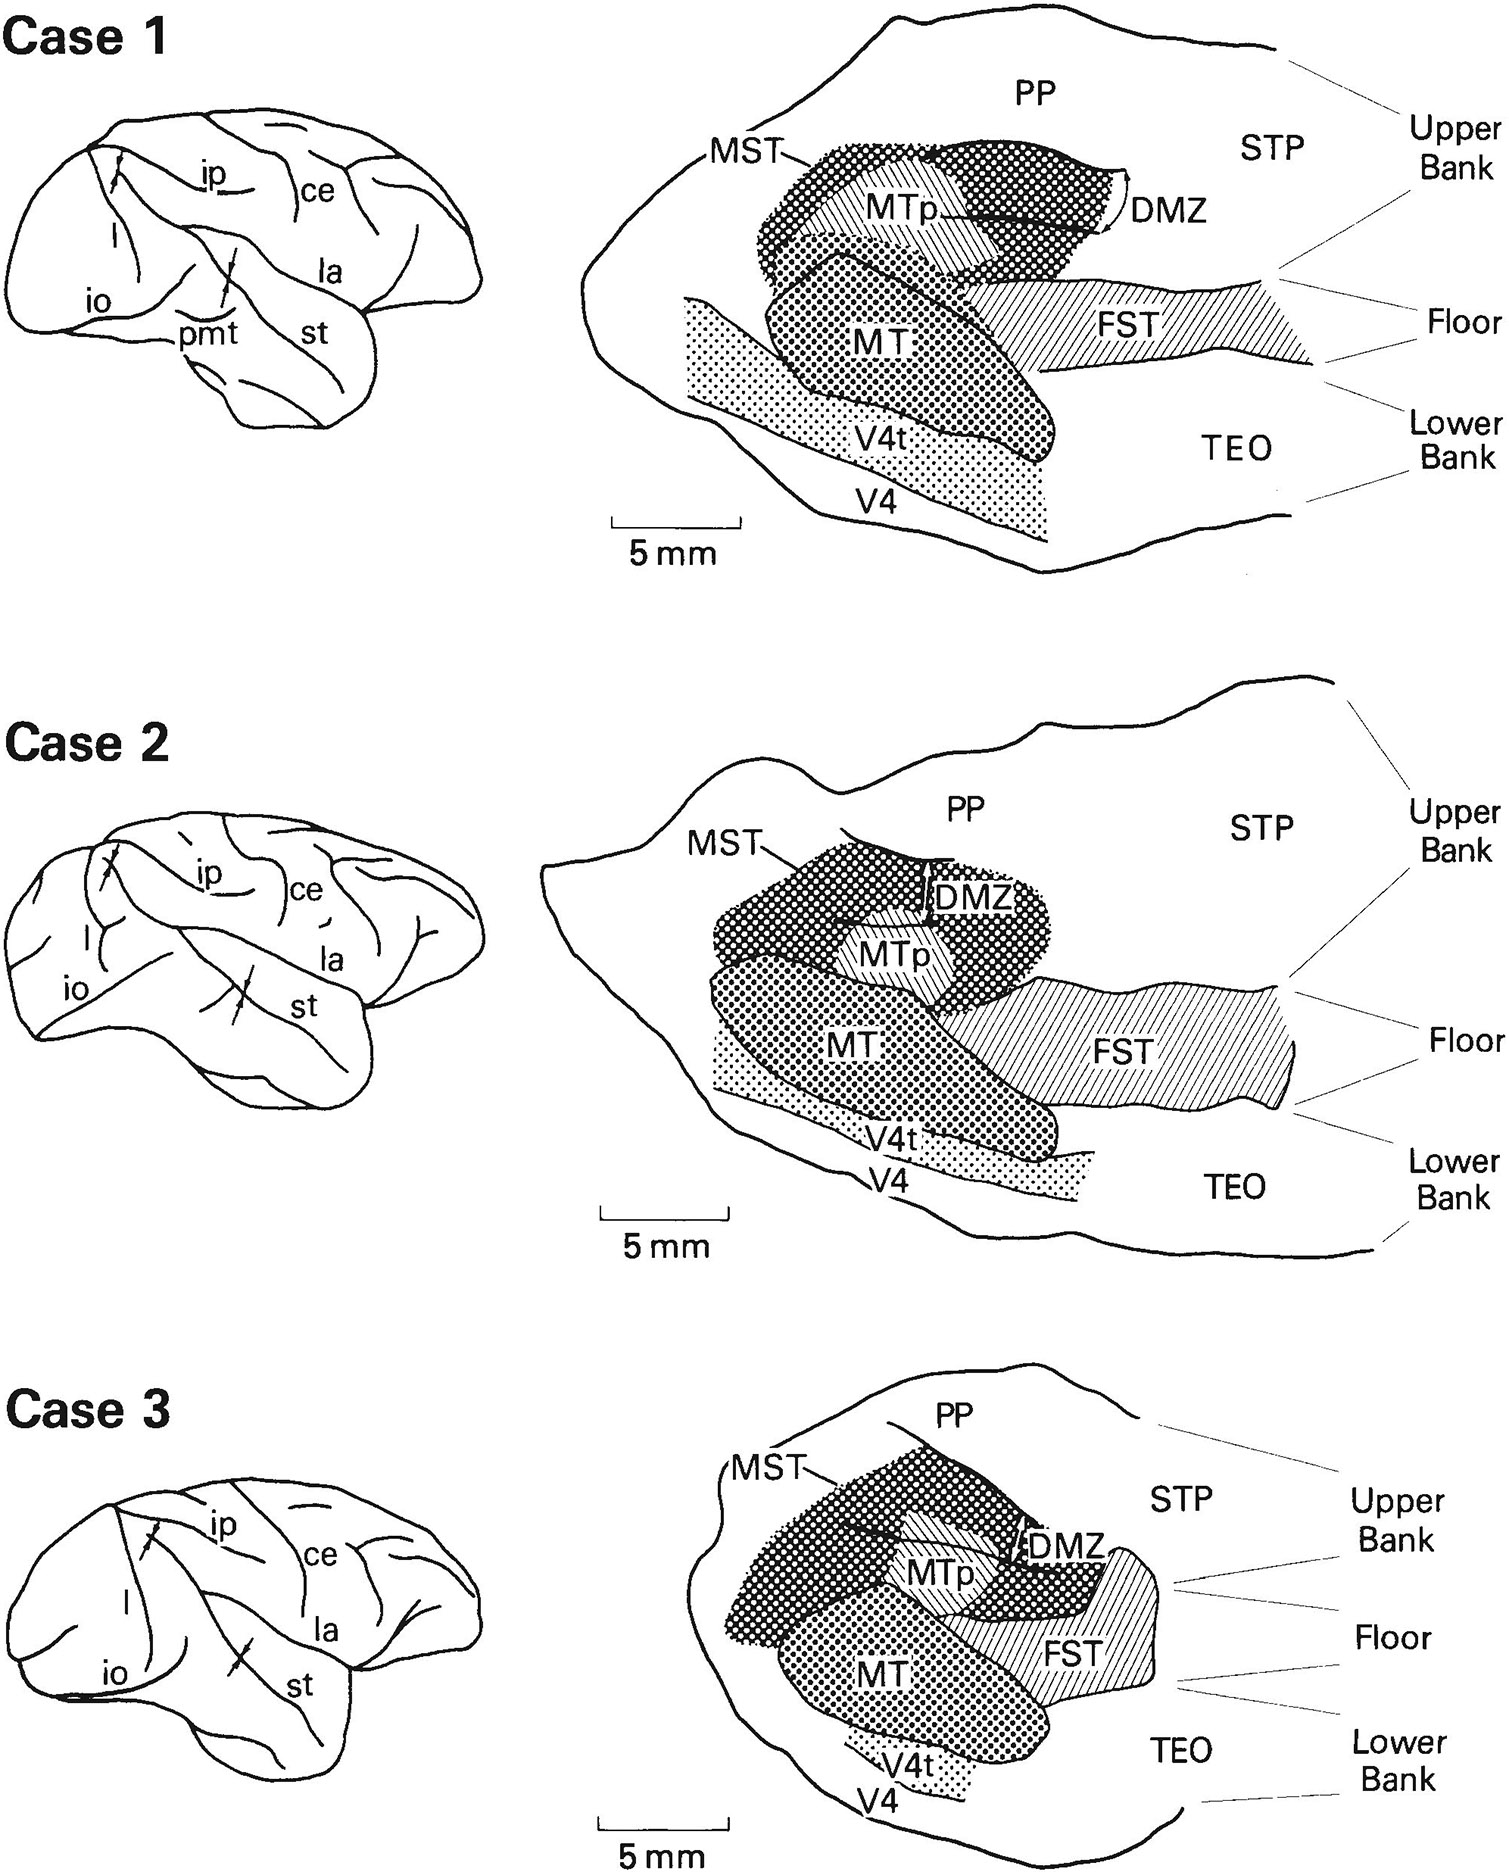
Location of visual areas in the caudal superior temporal sulcus (STS) shown on two-dimensional reconstructions of the sulcus. The portion of the sulcus reconstructed in the three cases is indicated by arrows on the brain drawings on the left. The borders of MT, V4t, and FST were based on myeloarchitectural criteria, whereas the borders of MST and MTp are estimates based on both the distribution of receptive field properties and the limits of MT projections found in our anatomical cases (Ungerleider and Desimone, ’86b). DMZ is a densely myelinated zone located predominantly within MST on the upper bank of STS. In case 1, we have included within MT a small zone of intermediate-density myelination (dotted line) just medial to the heavily myelinated zone of MT. Abbreviations: ce, central sulcus; io, inferior occipital sulcus; ip, intraparietal sulcus; l, lunate sulcus; la, lateral sulcus; pmt, posterior middle temporal sulcus; st, superior temporal sulcus.
The distribution of receptive field properties and their relationship to the visual areas in the STS are shown in Figure 2. We will first describe the overall distribution of neuronal properties in the STS and then describe each of the areas in detail. Myeloarchitectural differences among the areas are illustrated and described in detail in two companion papers and are only summarized here.
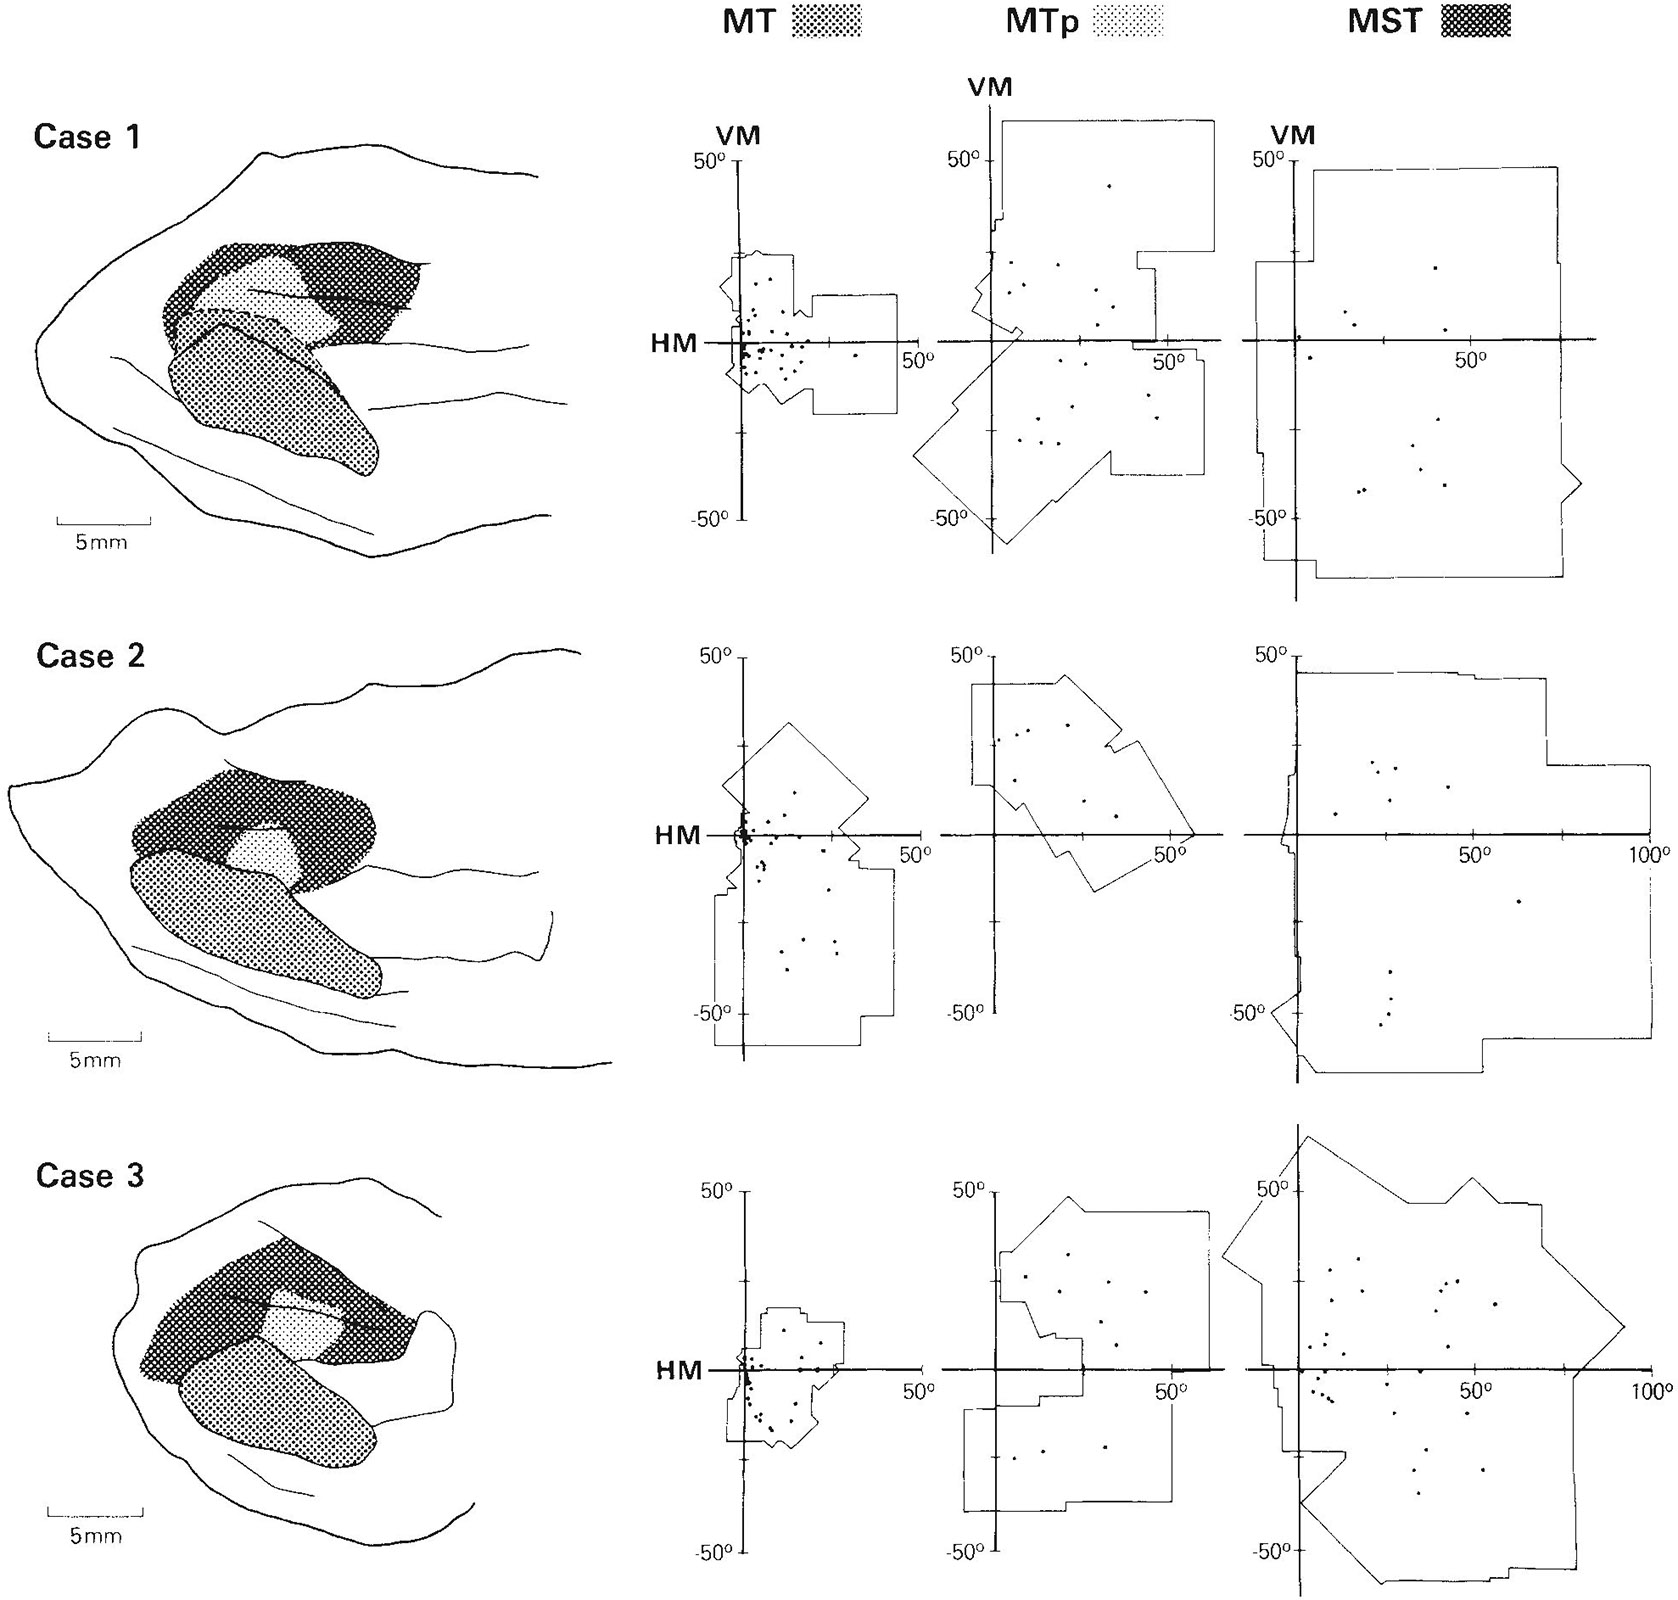
Fig. 2.
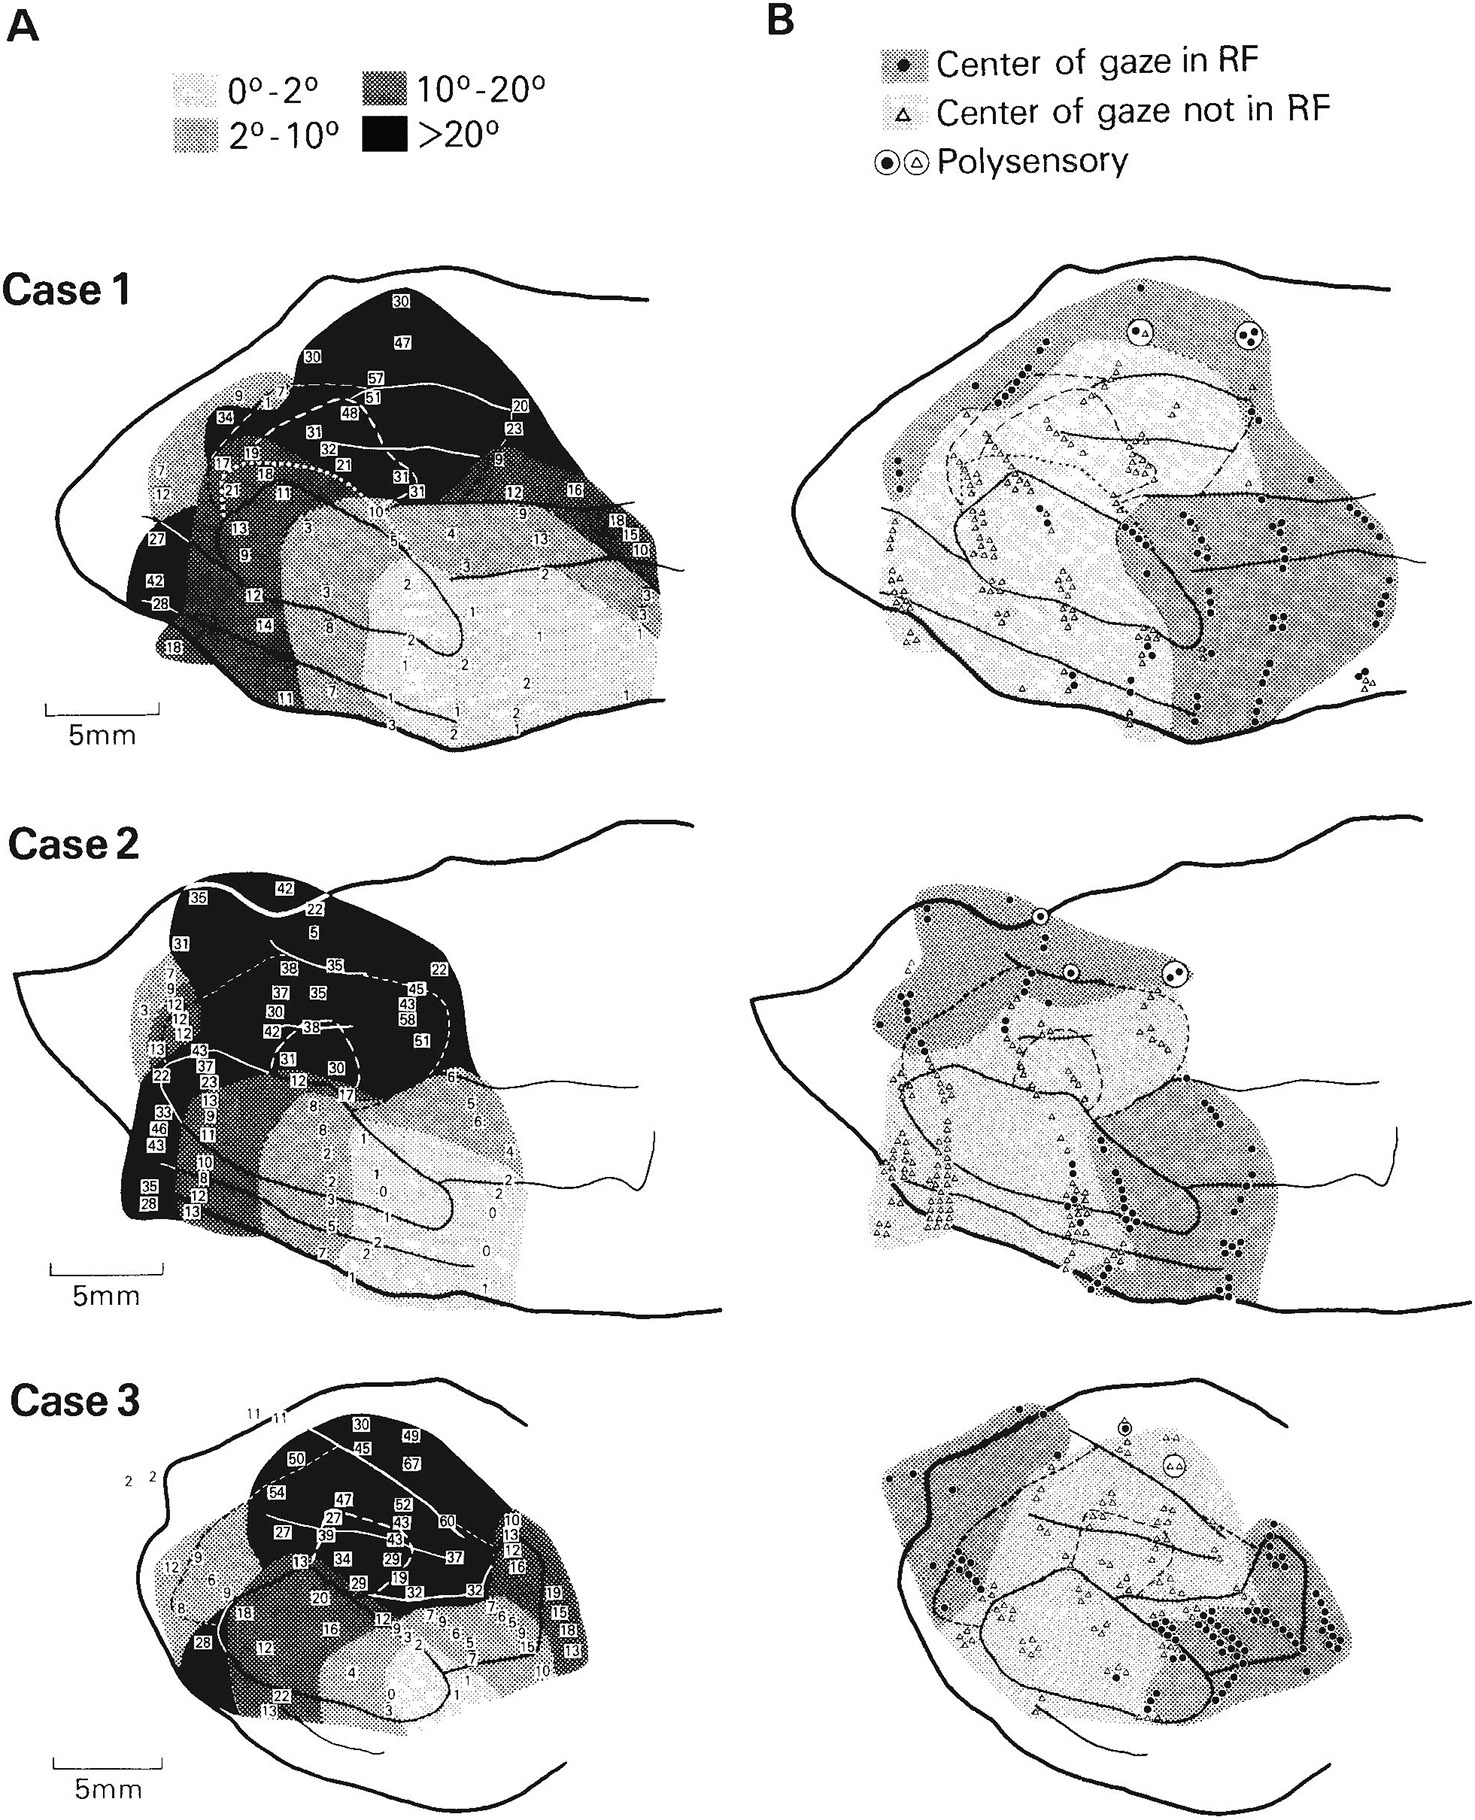
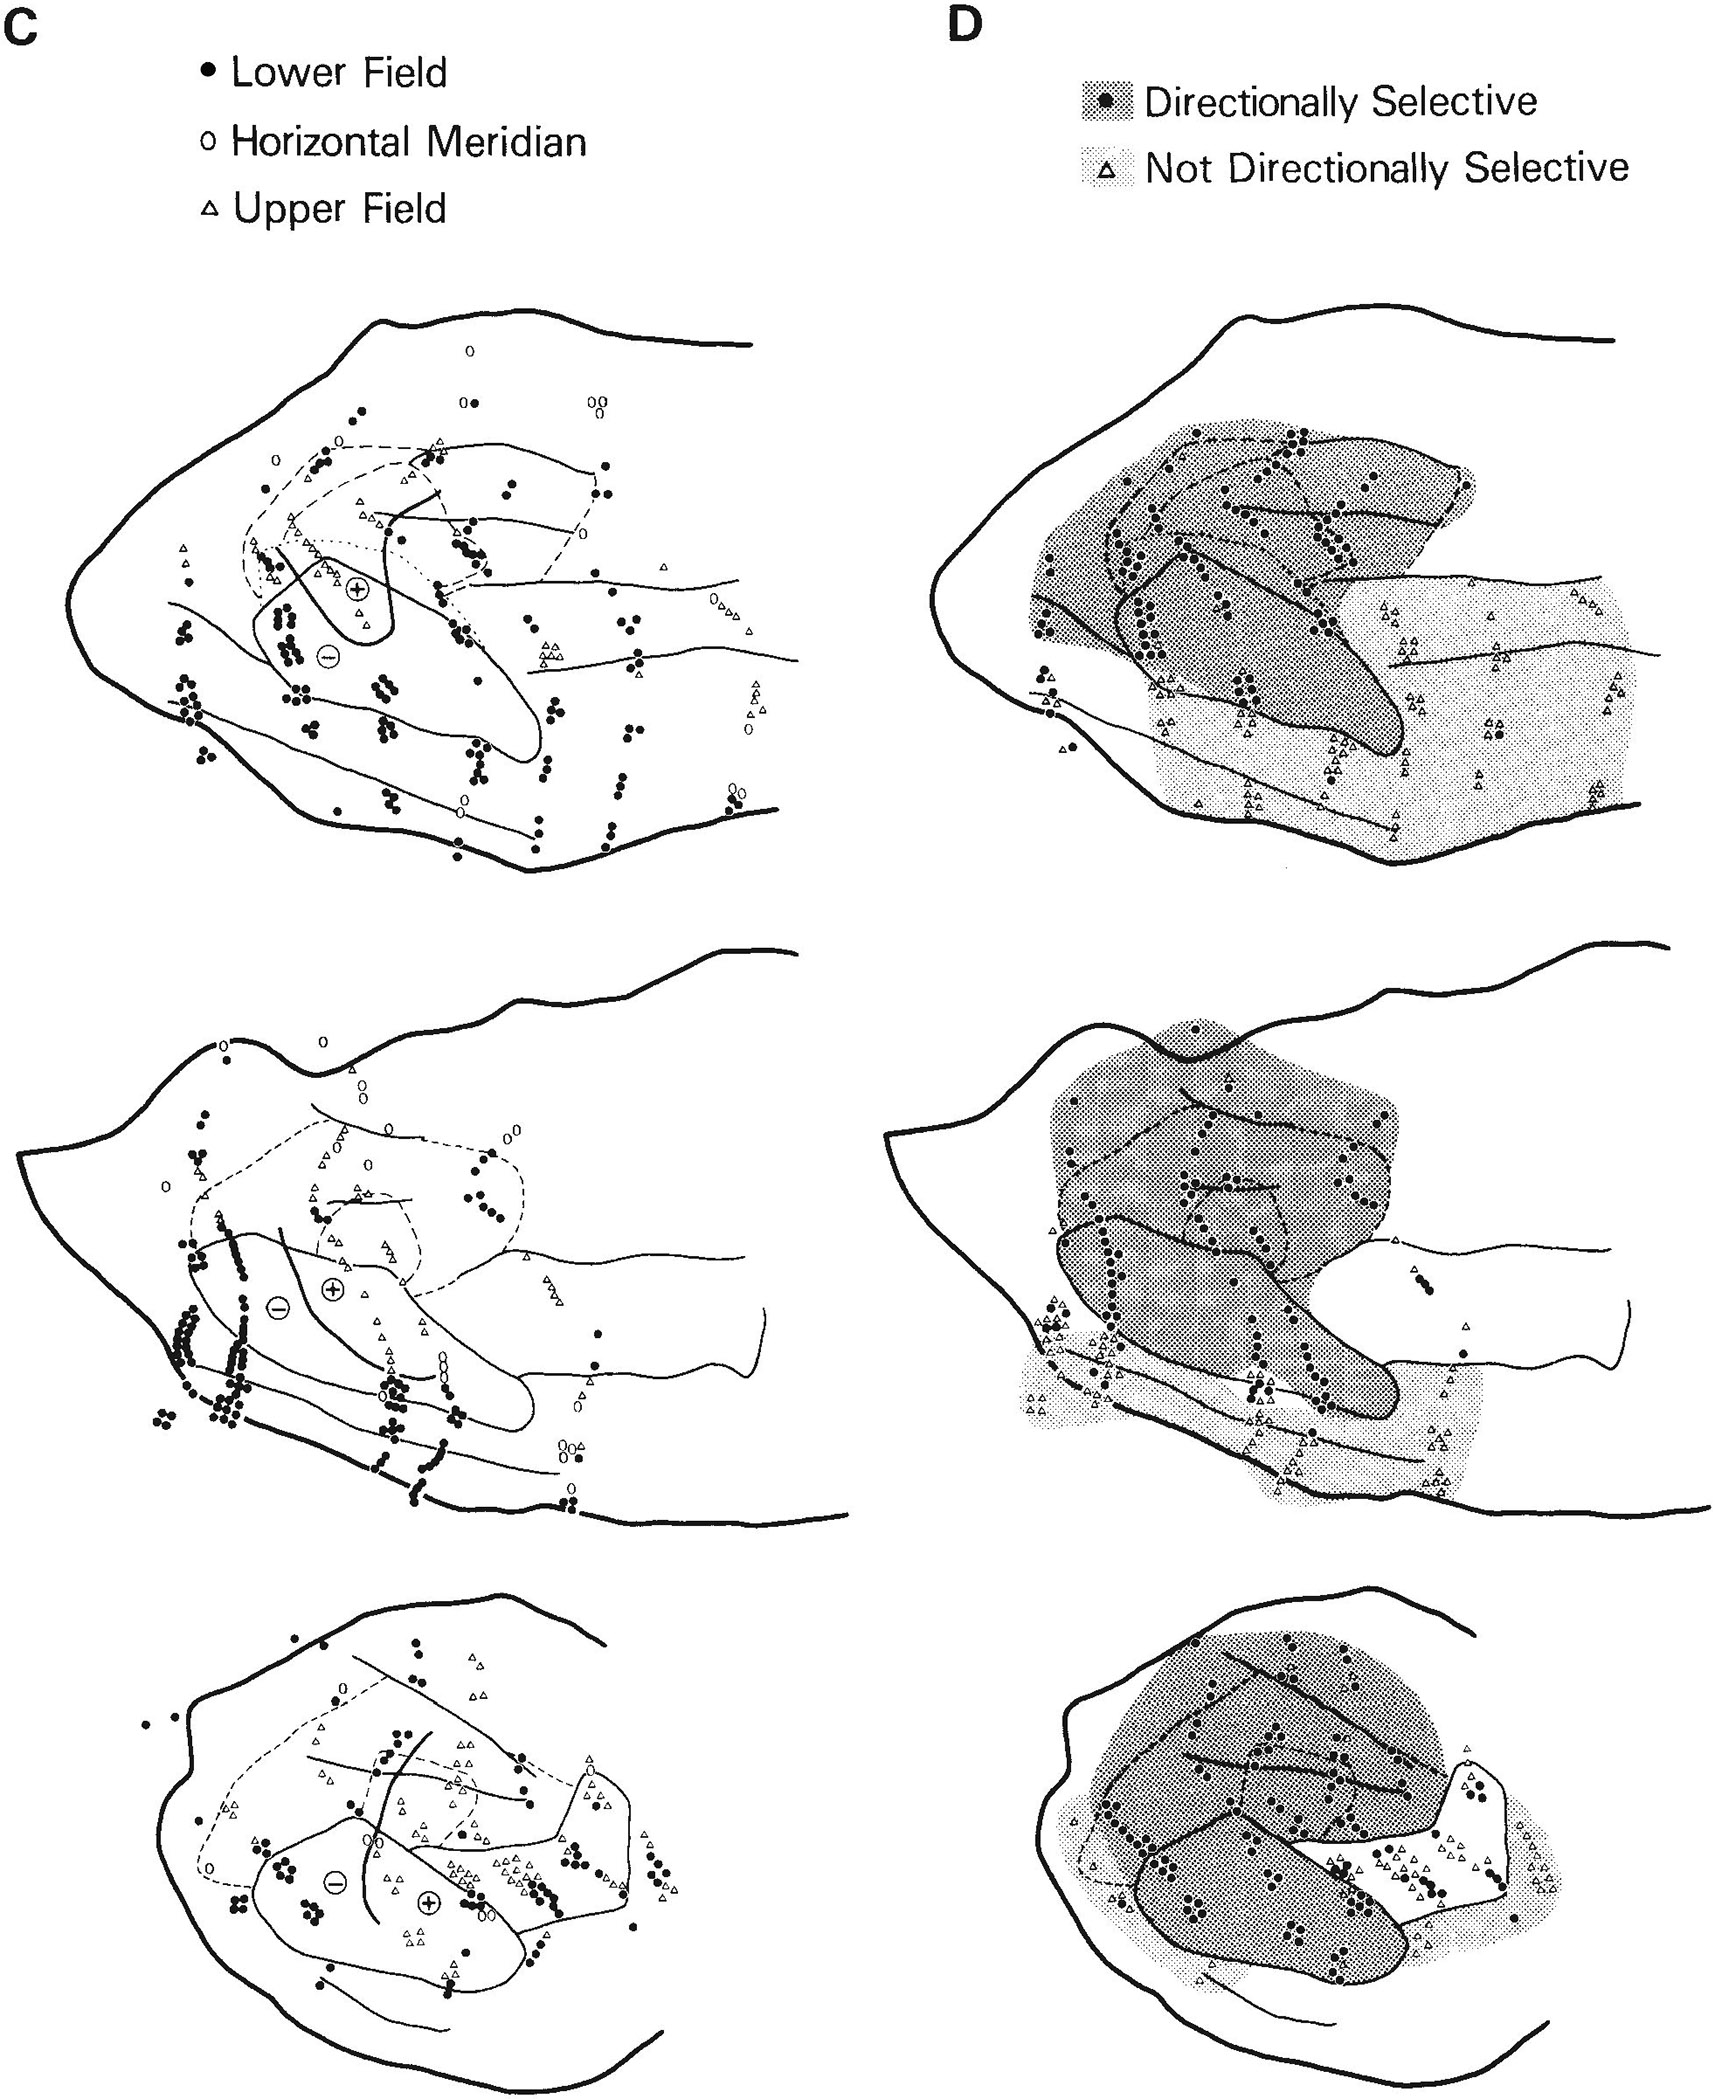
Visuotopic organization and distribution of receptive field (RF) properties of cells in the caudal STS. Solid lines are myeloarchitectural borders of areas shown in Figure 1; dashed lines are the estimated borders of MTp and MST. A. Eccentricity of receptive field centers. For clarity, some of the numbers shown represent the average eccentricity of several receptive fields of cells at nearby locations. Note that cells with receptive fields centered in the central visual field are concentrated anterolaterally, toward the temporal lobe, whereas cells with receptive fields centered in the peripheral field are concentrated posteromedially, nearer the parietal lobe. Zones of similar eccentricity appear to form curved bands, running continuously across several areas. B. Distribution of cells with receptive fields that include the center of gaze within or on their borders, and distribution of poly sensory cells (circled symbols). Many large receptive fields of cells along the dorsal rim of the upper bank of STS include the center of gaze even though their centers are in the peripheral field. C. Distribution of cells with receptive fields centered in the upper visual field, lower visual field, or on the horizontal meridian. The heavy line roughly divides the representations of the upper (+) and lower (−) field in MT and the medially adjacent cortex. D. Distribution of directionally selective cells. Directionally selective cells are concentrated in MT and medial to MT near the parietal lobe.
Based on the eccentricity of receptive field centers (Fig. 2A), there appears to be a gross visuotopic organization in the caudal STS that encompasses several areas. With the exception of a small representation of the central visual field near the posterior end of the sulcus, cells with receptive fields centered in the central visual field were found anterolaterally in the STS, near the temporal lobe, while cells with receptive fields centered in the peripheral field were found posteromedially in the STS, within or near the parietal lobe. Zones of similar eccentricity appeared to form curved bands, running continuously through V4, V4t, MT, MTp, and into areas MST and FST.
Although the peripheral visual field was emphasized in the parts of the STS nearest the parietal lobe, the representation of the central field was not excluded from this region. Some of the cells in the upper bank and floor of the STS had receptive fields that were very large and included the center of gaze, even though the geometric centers of these fields were in the periphery. This is illustrated in Figure 2B, which shows that the center of gaze was included within the receptive fields of cells along both the dorsal rim and floor of the STS.
Figure 2C shows the representations of the upper and lower visual fields in the STS. Cells with receptive fields centered in the lower visual field were most highly concentrated posterolaterally in MT and in the adjacent cortex lateral and anterior to MT. In cases 2 and 3, cells with receptive fields centered in the upper visual field were concentrated within the anterior part of MT and the adjacent cortex anteromedial to MT. In case 1, cells with receptive fields centered within the upper visual field were displaced posteriorly from those in cases 2 and 3 in both MT and the adjacent cortex.
Figure 2D shows the distribution of directionally selective sites in the STS. Directionally selective cells were found predominantly within MT and medial to MT on the upper bank of the STS. This region of directionally selective cells spanned all isoeccentricity bands and, thus, included a representation of the entire contralateral field.
At a few sites, cells responded to auditory or somesthetic stimuli in addition to visual stimuli. These sites were all located on the upper bank of the STS within PP (Fig. 2B).
In summary, there is an overall trend to the distribution of receptive field properties in the STS. As one moves posteromedially in the STS, toward the parietal lobe, receptive fields increase in size, the peripheral visual field is emphasized, and directional selectivity becomes predominant. As one moves anterolaterally in the STS, toward the temporal lobe, receptive fields become smaller, the central visual field is emphasized, and directional selectivity becomes less common. Within this overall organization, a number of separate visual areas can be distinguished in the STS, which are described in the next section.
Organization of MT and the areas to which MT projects
MT and MTp.
MT in the macaque lies in the lateral bank and floor of the caudal STS (Zeki, ’69, ’71, ’76; Ungerleider and Mishkin, ’79; Montero, ’80; Gattass and Gross, ’81; Van Essen et al., ’81; Weller and Kaas, ’83; Fig. 1). In a previous study, we defined MT to be the heavily myelinated portion of the V1 projection zone in the STS (Ungerleider and Desimone, ’86a). The central field representations of V1 and V2 project to MT, while the far peripheral representations of V1 and V2 project medial to MT, to a region we have termed MTp (see below). MT and MTp are together required to process the complete outputs of V1 within the STS and, therefore, should probably be regarded as two distinctive parts of a single visual area. Since the boundaries of MTp cannot be determined on the basis of myeloarchitecture, we have estimated the boundaries in each case on the basis of physiological evidence that is presented later in the Results. Both MT and MTp have a high proportion of directionally selective cells. Cells at 89% of the recording sites within MT (total tested [n] = 114) were directionally selective (Fig. 2D), confirming prior reports (Zeki, ’74; Van Essen et al., ’81; Maunsell and Van Essen, ’83b; Albright, ’84; Albright et al., ’84), as were cells at 100% of the recording sites (n = 49) in MTp.
It was not our aim in the present study to re-map in detail the visuotopic organization of MT, but our data were sufficient to provide an overview of MT which is consistent in many ways with the maps described previously by Gattass and Gross (’81) and Van Essen et al. (’81). As shown in Figure 2A and 2B, the fovea was represented anterolaterally in MT and the peripheral visual field was represented posteromedially. In cases 1 and 3, the eccentricity of receptive field centers did not extend more than about 20° into the upper or lower visual fields. In case 2, receptive field centers extended out to about 40° in the lower visual field but only to about 10° in the upper field (Fig. 2A,C). Receptive fields of cells recorded at the MT border, especially the lateral border, were commonly located near the representation of the vertical meridian. Although there were not enough recording sites within MT to localize the representation of the horizontal meridian, we were able to make a rough division between the upper and lower visual fields (Fig. 2C). In cases 2 and 3, the upper visual field was represented anteromedially in MT and the lower visual field was represented posterolaterally, which is the most common organization found in MT (Gattass and Gross, ’81; Van Essen et al., ’81). In case 1, the lower field representation was distorted and occupied both the anterior and posterior portions of MT. Similar visuotopic distortions in MT have been reported previously in individual animals (Van Essen et al., ’81). In all three of our cases, the dividing line between upper and lower fields was curved medially, away from the long axis of MT. Later in the Results we consider the relationship between the visual field representation of MT and that of MTp.
Areas V4t, V4, and TEO.
V4t, V4, and TEO lie in the lateral bank of the STS both lateral and anterior to MT (Fig. 1). Whereas V4t is confined to the STS, V4 has been shown to extend onto the prelunate convexity (Van Essen and Zeki, ’78; Maguire and Baizer, ’84) and inferior occipital gyrus (Ungerleider et al., ’83; Gattass et al., ’85; Ungerleider, ’85), and TEO extends into the posterior inferior temporal region (Bonin and Bailey, ’47; Iwai and Mishkin, ’69; Fenstemaker et al., ’85). V4t is characterized by light myelination in all cortical layers, while V4 and TEO are more heavily myelinated and have more prominent outer and (especially) inner bands of Baillarger (see Ungerleider and Desimone, ’86b: Fig. 4). At present, it is not possible to distinguish between V4 and TEO on the basis of myeloarchitecture. Areas V4 and V4t were both originally considered by Zeki (’77) to be parts of the “V4 complex,” but we believe it is useful to distinguish between them because of the difference in myelination and because the portion of the visual field represented in V4t is re-represented within V4 (see below). The distinctive myelination of V4t commonly borders the full length of MT laterally, but in case 3 it was atypically short.
Fig. 4.
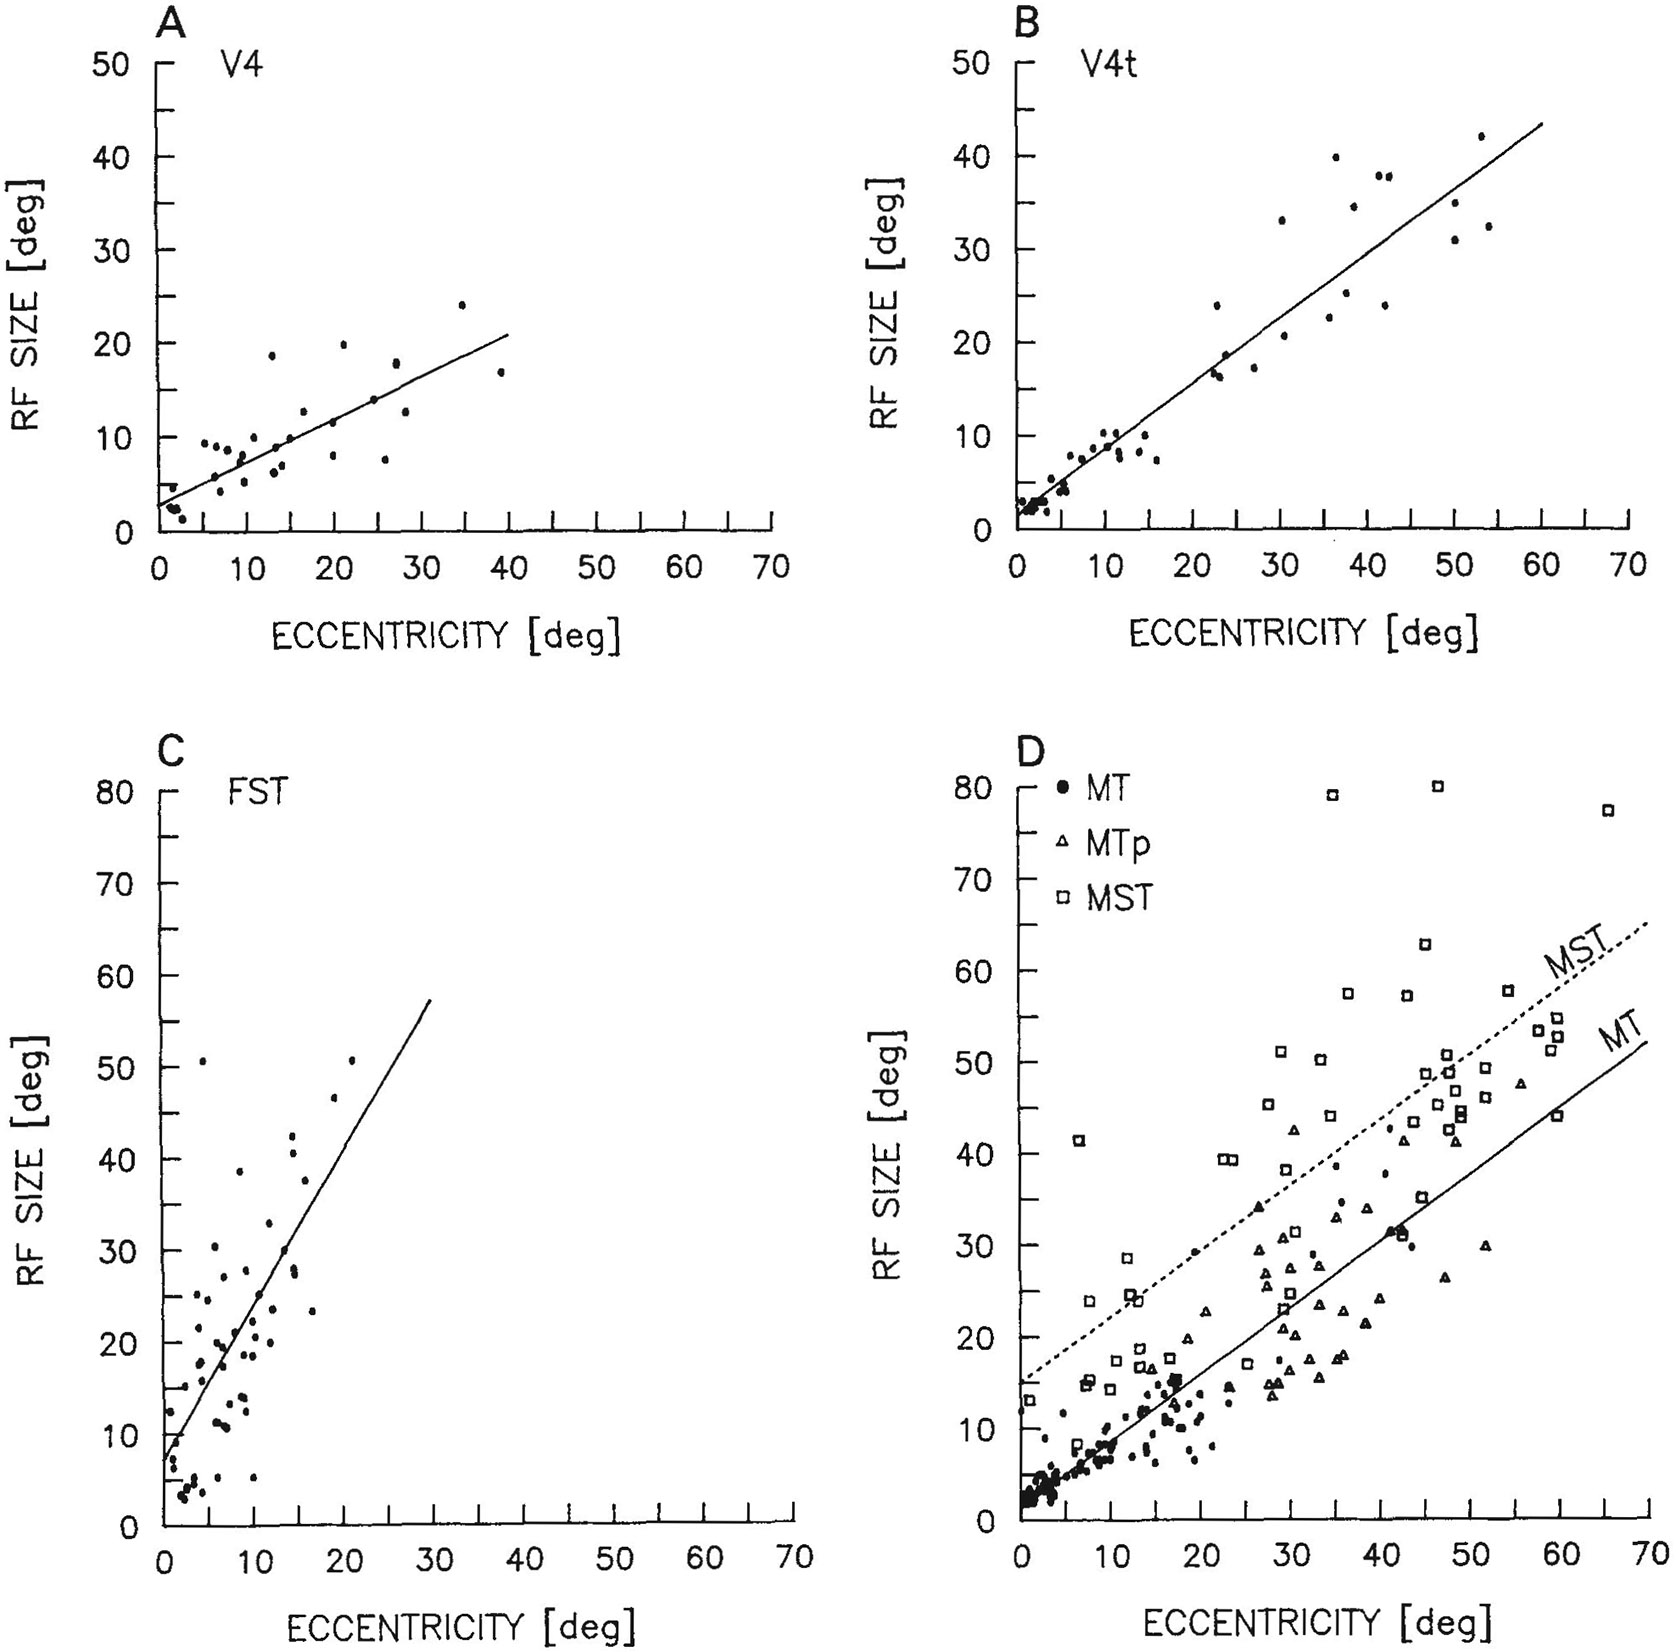
Receptive field size (square root of receptive field area) as a function of eccentricity of cells in V4 (A), V4t (B), FST (C), and MT, MTp, and MST (D). The lines describing size and eccentricity in each graph were calculated by linear regression. See text for the equations of the regression lines shown.
Both V4t and the portion of V4 located in the STS contained representations of the lower visual field that paralleled the one in MT, in that the fovea was represented anteriorly, adjacent to the fovea of MT, and the periphery was represented posteriorly, adjacent to the periphery of MT (Fig. 2A,B). There was no obvious anterior boundary for the foveal representation in V4. At successively more rostral sites along the lateral bank of the STS, receptive fields of cells remained at the center of gaze but gradually increased in size, as described previously by Desimone and Gross (’79).
There was a tendency for receptive fields of cells at the medial border of V4t (the V4t/MT border) to lie on the vertical meridian and for those at the lateral border of V4t (the V4t/V4 border) to lie on or close to the horizontal meridian (e.g., see Fig. 9, sites 3 and 5). Thus, V4t, or “transitional V4,” may provide a visuotopic transition between a representation of the horizontal meridian at the border of V4 and the vertical meridian at the border of MT, as suggested previously by Maguire and Baizer (’84). Recently, Gattass et al. (’85) have confirmed this visuotopic transition within at least part of V4t.
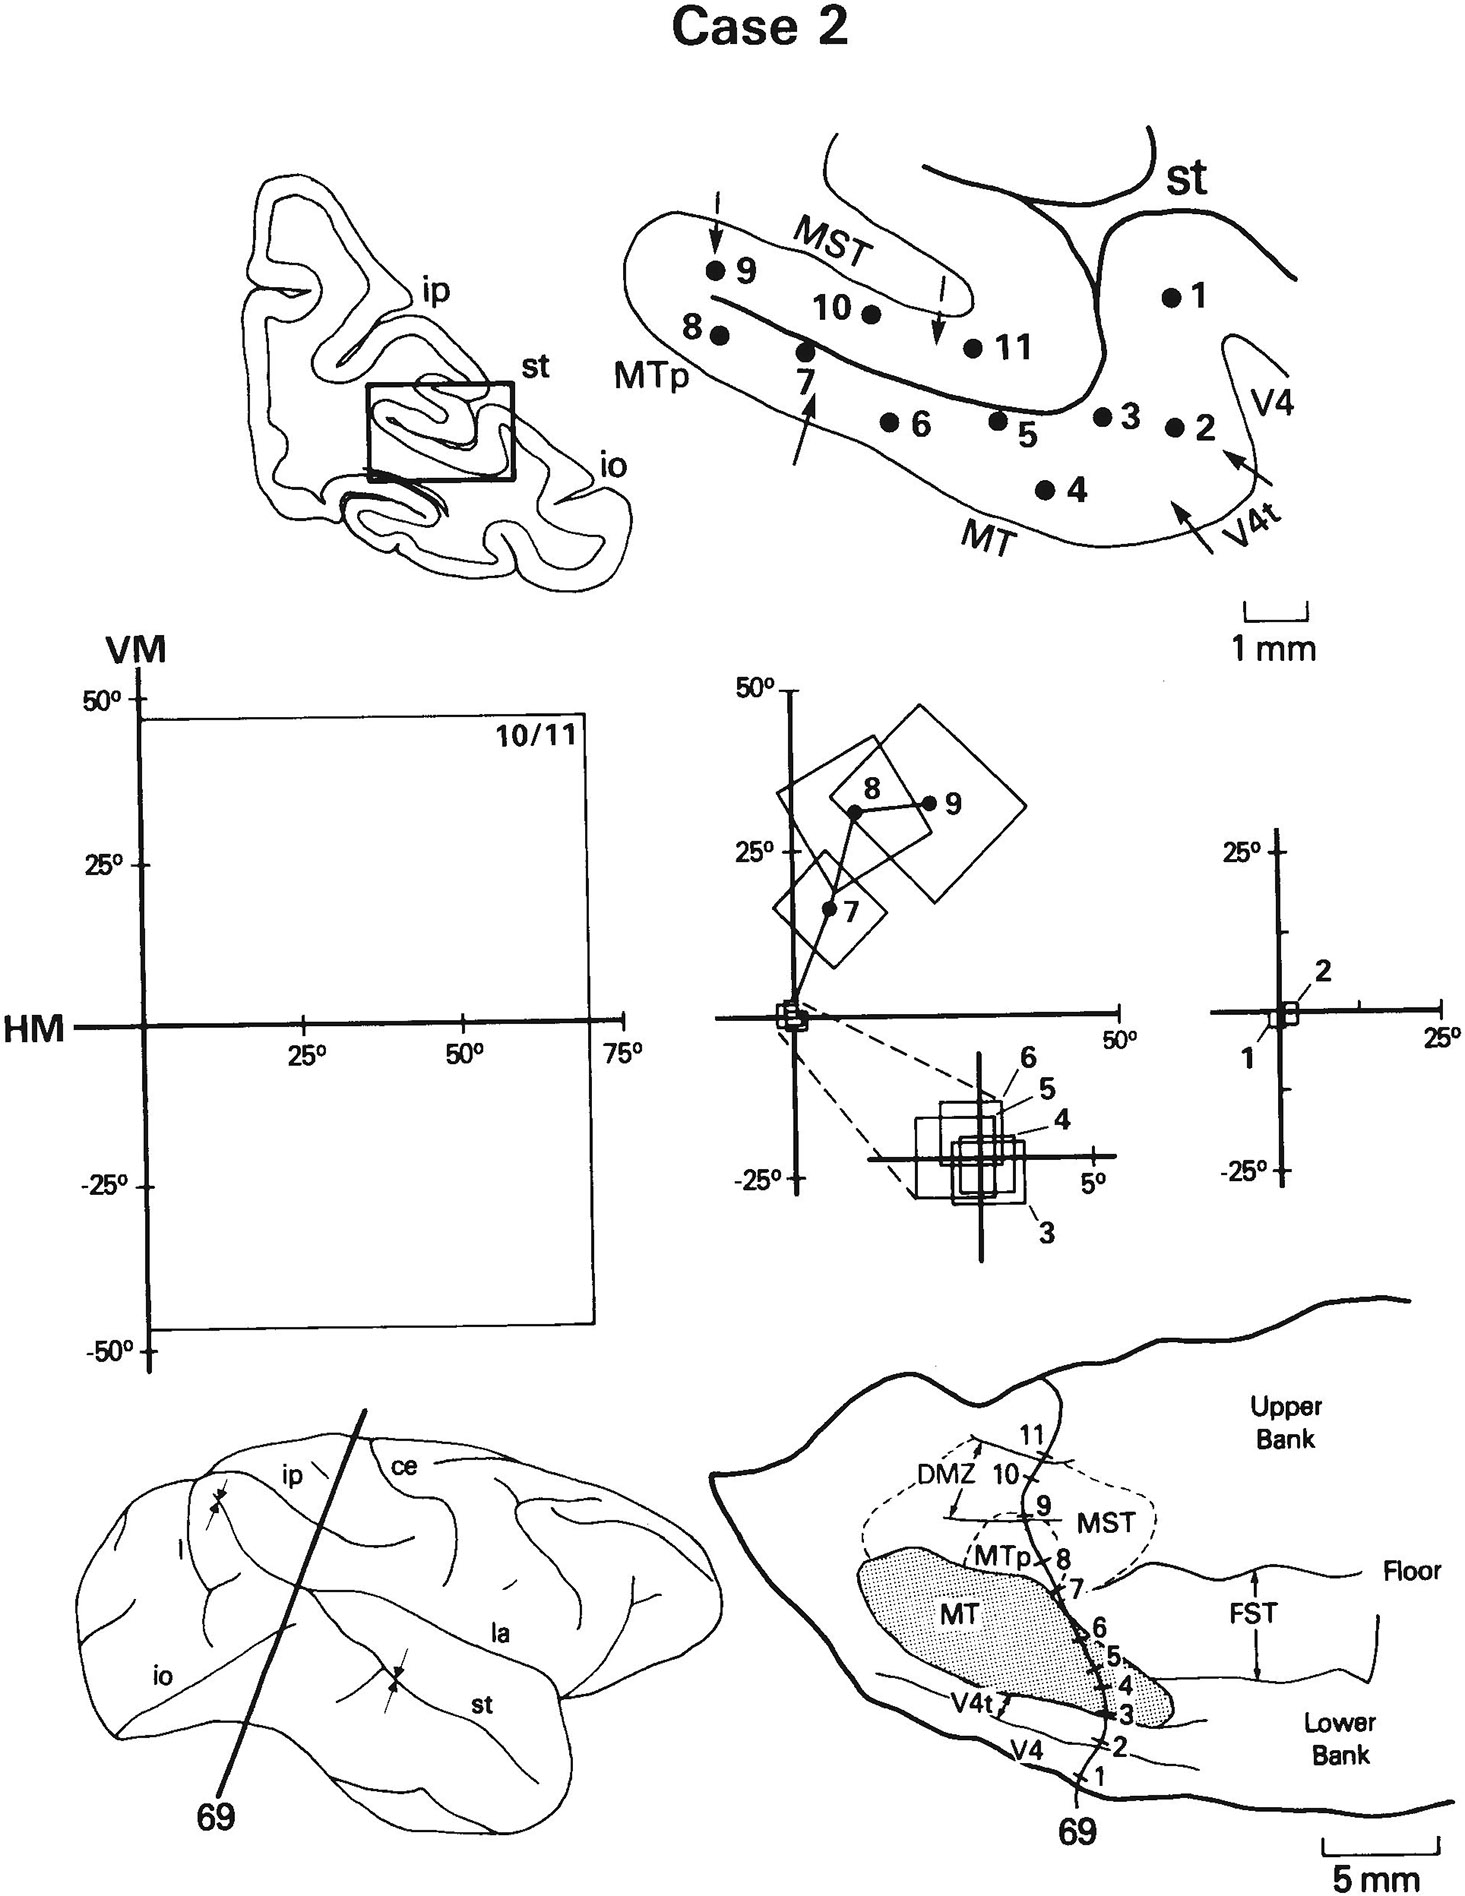
Fig. 9.
Case 2: Receptive Fields of cells recorded on a row of penetrations through the posterior portion of MT and the adjacent cortex in the caudal STS. Receptive fields shown are representative of a larger number of fields of cells recorded on the penetrations. In this figure and Figures 10-15, the locations of the recording sites are shown on both a coronal section and a flattened map of STS; the lateral view of the hemisphere indicates the level of the coronal section (heavy line) and the portion of STS from which the map was reconstructed (arrows). The boundaries of V4t and MT (derived from myeloarchitecture) are indicated by solid arrows on the section and by solid lines on the flattened map. The estimated borders of MST and MTp are indicated by dashed arrows on the section and by dashed lines on the map. The densely myelinated zone (DMZ) within MST, which is only shown on the flattened map, is indicated by solid lines. Receptive fields are shown as best-fitting rectangles. Note that at this level in STS there is a clear visuotopic boundary between MT and MST. For abbreviations, see Figure 1.
Figure 3 shows the portion of the visual field covered by the receptive fields and the receptive field centers for cells recorded in V4t and the part of V4 located within the caudal STS, summed across all animals. Because it was not possible to determine the anterior border of V4 in the STS, to be conservative, we excluded from V4 all receptive fields of cells recorded anterior to MT. Interestingly, even though our recording sites were limited to the STS portion of V4 (except for a few sites on the prelunate gyrus near the lip of the sulcus), receptive fields of the cells in V4 collectively covered the lower visual field out to an eccentricity of about 35°. The visual field representation in V4t was redundant with that in V4, as receptive fields in V4t also covered the lower visual field, out to an eccentricity of about 60°.
Fig. 3.
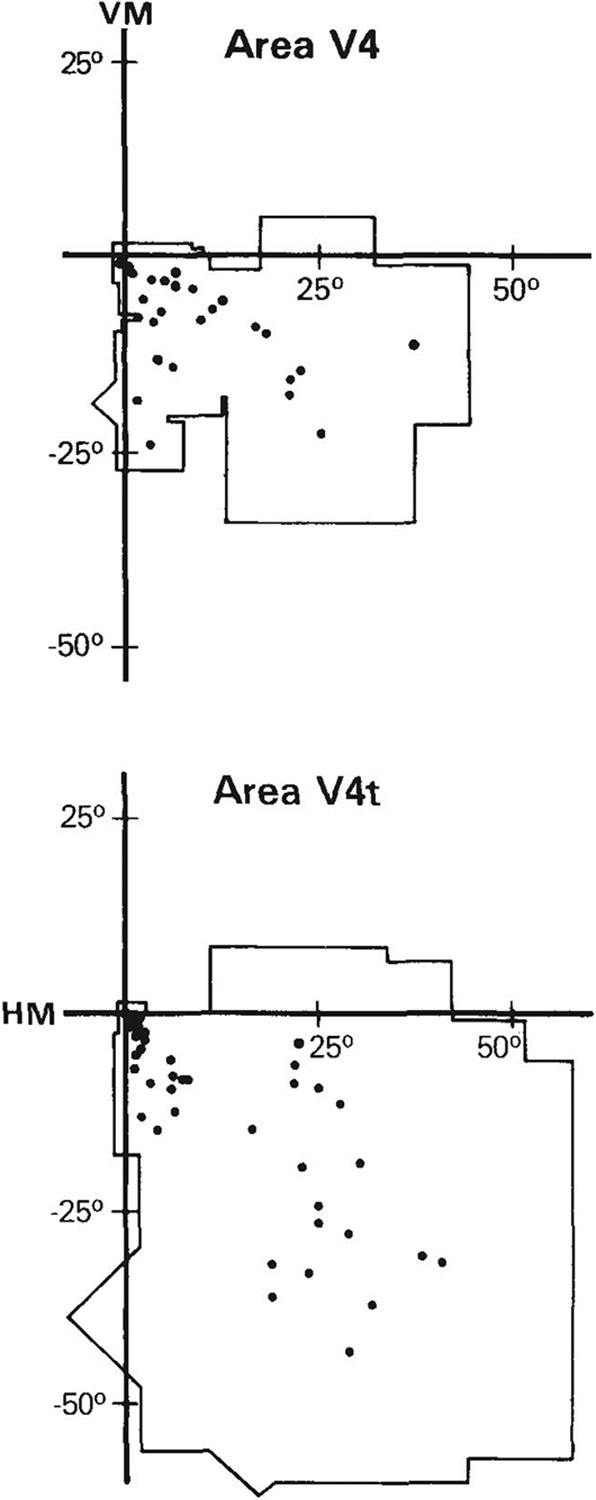
Portion of the visual field covered by receptive fields and receptive field centers (dots) of cells in the STS portion of V4 (top) and in V4t (bottom), summed across all animals.
The relationships between receptive field size (square root of length times width) and eccentricity in V4 and V4t are shown in Figure 4. The regression line relating size and eccentricity in V4 was S = 0.45e + 2.80 (r = .95). By contrast, the regression line in V4t was S = 0.70e + 1.58 (r = .83), which was steeper than that found in V4 but was very similar to that found in MT (see below).
We found no representation of the upper visual field in V4t. If there is such an upper field representation for this area, it must be separated from the lower field representation. One possibility is that, like the upper field representation in V4 (Ungerleider et al., ’83; Gattass et al., ’85; Ungerleider, ’85), the upper field representation in V4t is located on the ventral aspect of the hemisphere.
The overall visuotopic organization of V4t and V4 derived physiologically in the present study is consistent with the results of our anatomical cases, which have shown that the foveal representation of MT projects anteriorly in V4t and V4 while the peripheral representation projects posteriorly (Ungerleider and Desimone, ’86b). We have no evidence that MT projects anterior to V4t and V4 into TEO.
In contrast to the high percentage of directionally selective receptive fields in MT (89%), only 25% of the fields in V4t (n = 49), 15% of the fields in V4 (n = 58), and 4% of the fields in TEO (n = 54) were directionally selective.
Area FST.
FST lies anterior to MT in the fundus of the STS (Fig. 1), for which it is named. In myelin-stained sections, FST is characterized by thick radial fiber bundles running from the white matter into the supragranular layers (see Ungerleider and Desimone, ’86a: Figs. 4, 9). The posterior boundary of this distinctive myeloarchitectural region is coincident with the boundary of MT, but the anterior boundary is difficult to discern in some cases. In cases 1 and 2, for example, the characteristic appearance of FST gradually fades as the STS loses its broad floor in more anterior coronal sections.
Figure 5 shows that the portion of the visual field covered by the receptive fields of cells recorded in FST was limited to the central 30°–40°. Curiously, receptive fields of cells in FST resembled those in inferior temporal cortex (Desimone and Gross, ’79), in that they were large, often included the center of gaze, and often crossed into the ipsilateral visual field. As shown in Figure 4, the average receptive field size of cells in FST was nearly twice the eccentricity of the receptive field center, so that even receptive fields with centers in the peripheral visual field were commonly wide enough to encompass the center of gaze within their borders. The equation for the regression line was S = 1.66e + 7.25 (r = .47). The median size of receptive fields of cells in FST (n = 69) was 20° × 20°; 89% included the center of gaze either within the field or at a border of the field; and 49% were clearly bilateral in that they crossed more than 3° into the ipsilateral visual field. In two of the animals (cases 2 and 3), approximately 25° of the ipsilateral field was represented within FST (Fig. 5). Interestingly, the portion of the contralateral visual field represented in FST was similar to that represented in MT, in that the far peripheral field was excluded, suggesting that FST may have a special relationship to the heavily myelinated portion of the V1 projection zone.
Fig. 5.
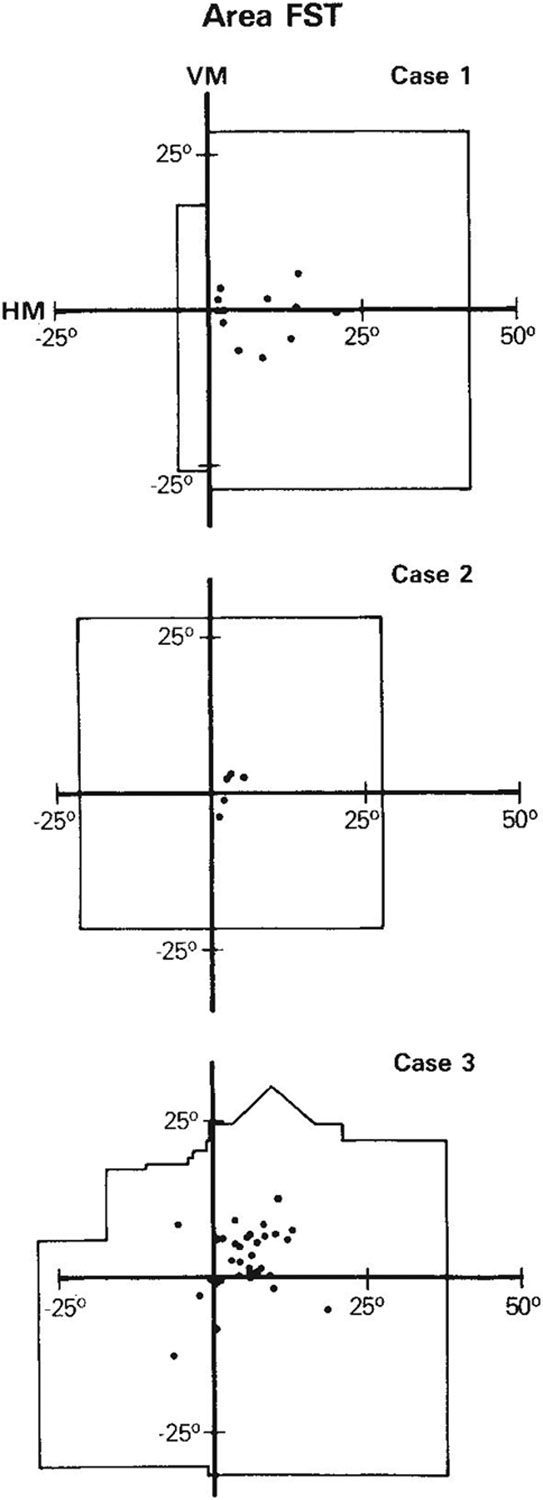
Portion of the visual field covered by receptive fields and receptive field centers (dots) of cells in FST in the three cases.
There was little evidence of visuotopic organization within FST, except that the receptive field centers of cells in the anterior portion of FST tended to be located more peripherally in the visual field than those in the remainder of the area (Fig. 2A). In addition, in case 3, receptive field centers of cells in the medial portion of FST tended to be located more often within the upper visual field than those in the lateral portion (Fig. 2C). Although only 32% of the multiunit sites in FST were directionally selective, neurons at many other sites could only be driven well by complex motion (e.g. rotation) of three-dimensional objects, indicating that FST might constitute a stage in motion analysis beyond that of MT.
Each of the MT injection cases in both the present and following studies resulted in widespread label within FST. It will be shown in a later section of the Results that label in FST was concentrated in regions where FST receptive fields overlapped the receptive field recorded at the MT injection site.
MST and the posterior parietal cortex.
MST (medial superior temporal area) occupies most of the bottom half of the upper bank of the caudal STS and a small portion of the adjacent floor (Fig. 1). It is defined by the limits of the MT projection field in the upper bank of the STS, excluding MTp. Although Maunsell and Van Essen (’83a) appear to have included FST within MST, we distinguish between the two areas because each receives a separate projection from MT (Ungerleider and Desimone, ’86b) and they differ in myeloarchitecture, visuotopic organization, and neuronal properties, as will be described below.
The myeoloarchitecture of MST is heterogeneous and cannot be used to define most of its boundaries. A large part of the region is occupied by a densely myelinated zone in the upper bank of the STS that we term DMZ (see Ungerleider and Desimone, ’86a: Figs. 4, 9), while the remainder is less heavily myelinated. The functional significance of the densely myelinated zone is unclear at present, but it provides a convenient landmark within the upper bank of the STS that can be used to relate anatomical and physiological data across animals and studies. The dorsal boundary of MST may coincide with the dorsal boundary of the DMZ, as projections from MT did not extend significantly beyond it (Ungerleider and Desimone, ’86b). Posteriorly, MST borders both MTp and MT. Anteriorly, where MT no longer occupies the fundus of the sulcus, the lateral boundary of MST is coincident with the medial boundary of FST. We have estimated the other borders of MST only roughly from the limits of MT projections found in our anatomical cases.
MST, like MT, contains a very high proportion of directionally selective cells (Fig. 2D). Cells at 95% of the recording sites in MST (n = 66) exhibited directional selectivity. For 11% of these directionally selective sites, we were only able to drive the units with motion directed either toward or away from the animal’s eye (motion in depth). Other cells in MST may also have responded selectively to a direction of motion in depth, but we only tested cells for responses to motion in depth if we failed to drive the cells with motion in the tangent plane. Like cells in MT, MTp, V4t, V4, and FST, none of the cells in MST responded to nonvisual stimulation.
Cells in MST differed in a number of ways from cells in cortex closer to the lip of the sulcus. We tentatively include the cortex between MST and the dorsal lip of the STS within posterior parietal cortex, PP, although we do not wish to imply that posterior parietal cortex is a single area. There may be no sharp distinction between the anterior portion of PP in the STS and the posterior portion of the superior temporal polysensory area, or STP (Desimone and Gross, ’79; Bruce et al., ’81), since receptive fields within both regions are large and both contain polysensory cells. While cells in MST were strictly visual, 21% of the PP sites (n = 56) responded to auditory or somesthetic stimuli in addition to visual stimuli (see Fig. 2B) and 5% responded only to auditory stimuli. Moreover, 31% of the receptive fields recorded in PP included virtually the entire contralateral visual field, but this was true of only one site recorded in MST (see Fig. 10). Cells at only 45% of all visually responsive sites in PP were classified as directionally selective; however, the PP cells habituated rapidly, and at most other sites it was not possible to determine if they were directionally selective or not. Cells at 36% of the directionally selective sites in PP responded only to movement in depth.
Fig. 10.
Case 1: Receptive fields of cells recorded on a row of penetrations through the anterior portion of MT and the adjacent cortex in STS. The medial myeloarchitectural boundary of MT was not sharp in this case, and a small zone of uncertainty is indicated in both the coronal section (“?”) and the flattened map (dotted line). Note that although there is a continuous progression rather than a discontinuity in visuotopic organization as one moves from MT into MTp, receptive fields dip unexpectedly into the lower visual field. See also Figure 1 for abbreviations and Figure 8 for conventions.
There was evidence for crude visual topography within MST, in that the central visual field was represented near the posterior end of the region, whereas the peripheral field was represented further anteriorly (Fig. 2A). Each of the MT injection cases resulted in label within MST, and, as was true in FST, the label was concentrated where receptive fields overlapped the receptive field recorded at the MT injection site (see below). There was no label within PP, since PP was excluded from MT projection field by definition.
Does MTp contain the missing peripheral field of MT?
We found previously that the central field representations of V1 and V2 projected to MT, whereas the far peripheral representations projected to a region we termed MTp (Ungerleider and Desimone, ’86a). In the present study, we asked whether the visual field representation of MT, determined physiologically, was indeed incomplete and, if so, whether MTp contained the missing representation.
Figure 6 shows the portion of the visual field covered by the receptive fields and the receptive field centers for cells recorded in MT in the three cases. The portion of the visual field covered is almost certainly an underestimate, since our recording sites did not include all parts of MT. Nonetheless, the sites in each animal came close to the posterior end and dorsomedial aspect of MT, where the periphery is represented, and therefore any underestimation of the periphery is likely to be small. In cases 1 and 3, the representations of the upper and lower visual fields within MT were limited to about the central 25°. In case 2, the representation of the upper field was similarly limited to about the central 25°, but the representation of the lower visual field was nearly complete. Together, the results from the three cases are consistent with both our own anatomical finding that only the central 20°–40° of V1 and V2 project to MT and the electrophysiologial result of Gattass and Gross (’81) that only the central 10°–30° is represented within the heavily myelinated zone. In addition, our physiological results are consistent with the results of Van Essen et al. (’81), who reported a limited representation of the upper visual field within the heavily myelinated zone and apparently found a limited representation of the lower visual field in at least some animals (see their Fig. 11).
Fig. 6.
Portion of the visual field covered by receptive fields and receptive field centers (dots) of cells in MT, MTp, and MST in the three cases. The estimated limits of MTp and MST are shown on the brain drawings on the left.
Fig. 11.
Case 2: Receptive fields of cells recorded on a row of penetrations through the anterior portion of MT and the adjacent cortex in STS. Note the large shift in receptive field position as one moves from MT into MTp. Compare results to those in Figure 10. See also Figure 1 for abbreviations and Figure 8 for conventions.
After determining that the visual field representation in MT was incomplete, we searched within the cortex immediately medial to MT for the missing portion of the visual field. Although we did not have an anatomical marker for MTp, we examined the receptive fields recorded within the region of the STS where we had found projections from the peripheral representations of V1 and V2 in our anatomical cases (Ungerleider and Desimone, ’86a). In each recording case, we were able to find a representation of the far peripheral field within a small region of cortex located medial to MT, which we took to be MTp. Outside of this region, and thus outside of the estimated projection zone of the far peripheral representations of V1 and V2, some of the receptive fields also included the far periphery, but they were either very large or redundant with fields inside this region and were therefore excluded from MTp. Like the far peripheral projection zones of V1 and V2 in the STS, the physiologically estimated MTp began at the border of MT and continued into the upper bank of the sulcus, a short distance into the DMZ. A comparison of the location of the estimated MTp in the three physiological cases with the location of the far peripheral projection zones of V1 and V2 found in our anatomical cases is illustrated in Figure 7.
Fig. 7.
Comparison between the location of the estimated MTp in the three physiological cases and the location of projections observed in five anatomical cases with injections in the far peripheral field representations of V1 or V2 (Ungerleider and Desimone, ’86a). Solid lines indicate superimposed drawings of MT from all cases, which were adjusted in size to overlap. The dotted line outlines the region medial to MT in which projections were located in the anatomical cases. The gray area indicates the portion of the projection in one V2 case that we consider to be within area V4. The dashed lines indicate the location of the estimated MTp in the three physiological cases. Note the correspondence between the hypothesized MTp and the far peripheral projection fields of V1 and V2, despite variability among animals.
Figure 6 shows that receptive fields of cells recorded in MTp filled in much of the far peripheral field that was missing from the representation in MT. In cases 1 and 3, MTp receptive fields extended to the limits of the animal’s vision in the upper and lower visual fields, i.e., roughly 50° above and below the horizontal meridian with the eyes fixed straight ahead. In case 2, MTp fields were confined to the upper visual field; however, the representation of the lower visual field in MT in this case was nearly complete. In all three cases, MTp fields fell short of the representation of 90° eccentricity along the horizontal meridian, suggesting that our boundaries for MTp may have been overly conservative or that we sampled too few sites.
In cases 1 and 2, there was substantial overlap of the receptive field borders, but not of the receptive field centers, of cells in MT and MTp, whereas in case 3 there was little overlap between either receptive field borders or centers. Receptive fields of cells in MST collectively covered the complete contralateral visual field. Unlike receptive field borders, receptive field centers of cells in MST did not extend to the far periphery, probably because the fields of MST cells were so large.
If the cortex we estimated to be MTp physiologically did indeed receive a projection from the far peripheral field representations of V1 and V2, then we would expect receptive field properties of cells in MTp to be more similar to those in MT than to those in MST. We compared, therefore, receptive field size in MTp to that in both MT and MST.
Figure 4 shows receptive field size as a function of eccentricity in MT, MTp, and MST. The regression line relating size and eccentricity in MT was S = 0.72e + 1.35 (r = .89), and in MST it was S = 0.71e + 14.99 (r = .78). Figure 6 shows that although the fields of MTp cells were located only in the periphery, they appeared to follow the MT regression equation; that is, MTp fields appeared to be about the size expected of MT fields if the latter were to extend into the periphery. Receptive fields of MST cells were located throughout the visual field and were about 14° larger than those of MT or MTp cells at all eccentricities. An additional difference between MST and MTp was that all of the cells found to be selective for motion in depth were located exclusively within MST.
Figure 8 shows the results of a direct comparison of receptive field size in MTp relative to MT and MST. For each receptive field recorded in MTp, we computed the ratio of the observed field size to the size that would be expected if MTp fields followed either the MT or MST regression equations. The distribution of MTp:MT ratios was centered nearly on 1.0 (mean = 0.98, median = 0.92; see Fig. 8B); that is, receptive field size in MTp was close to that predicted by the MT regression equation. By contrast, the distribution of MTp:MST ratios was centered on 0.6 (mean = 0.62, median = 0.57; see Fig. 8D); that is, MTp fields were much smaller than predicted by the MST regression equation. Shown for comparison are the MT:MT and MST:MST ratios, which, by definition, were both normally distributed about 1.0 (Fig. 8A,C). There was some evidence that the MTp fields were more heterogeneous in size than the MT fields, since the distribution of MTp:MT ratios was flatter than the distribution of MT:MT ratios. This heterogeneity in MTp:MT ratios may be due to either an inaccurate sample of MTp fields or simply to a greater variance in receptive field size within the peripheral as compared to the central visual field.
Fig. 8.
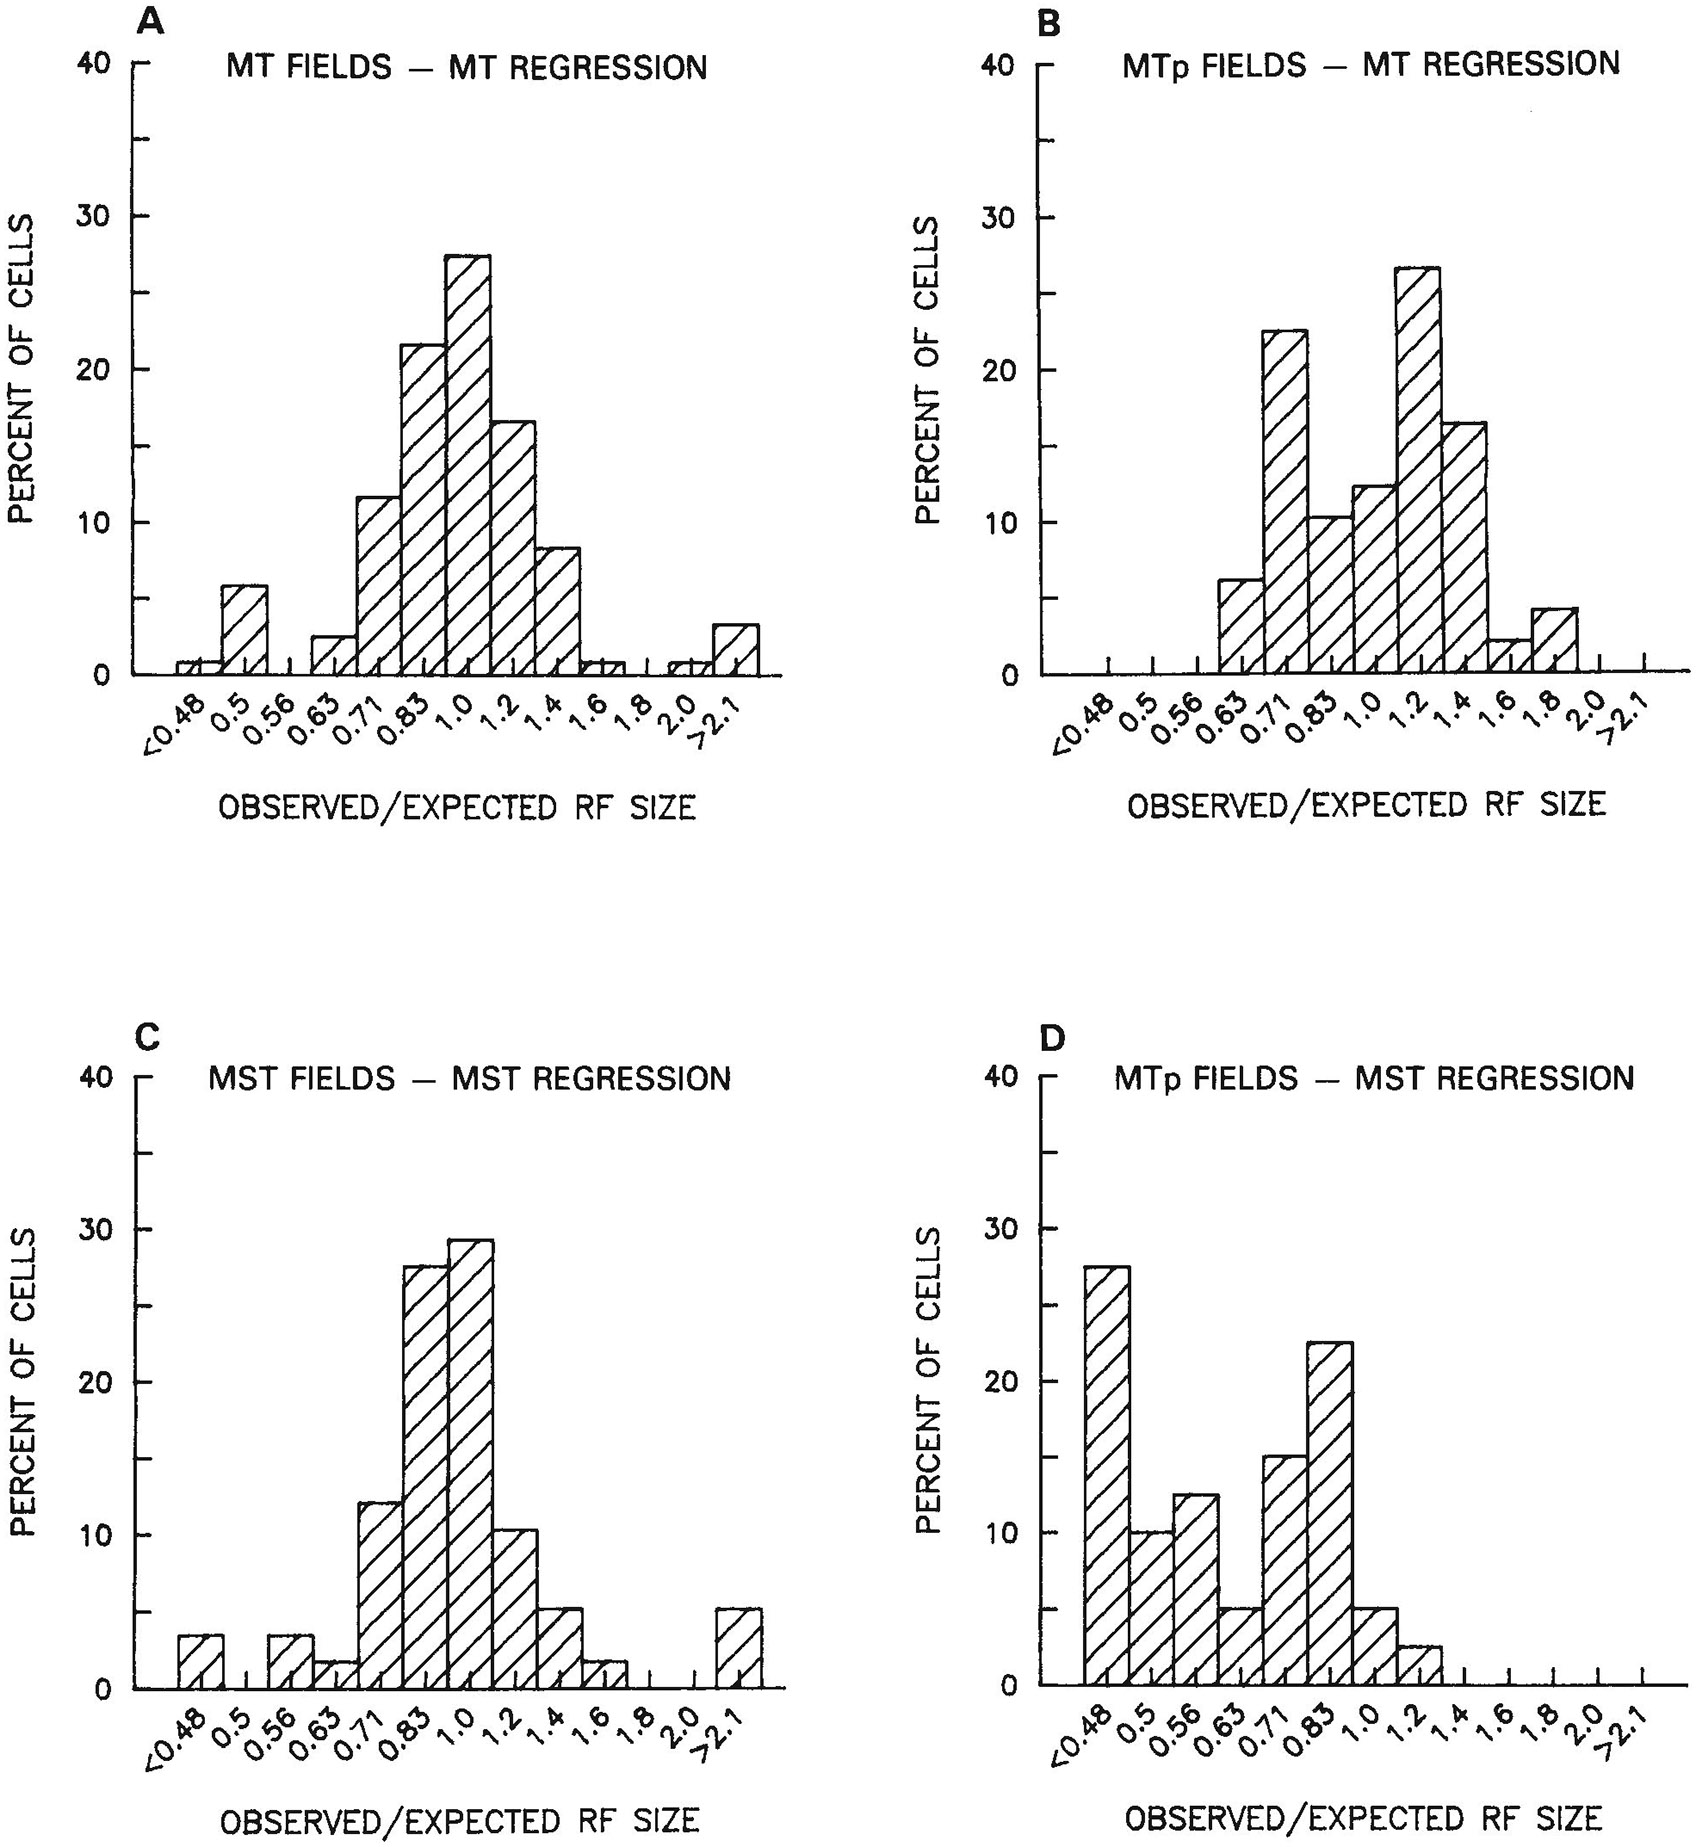
Distribution of ratios of observed receptive field size to expected receptive field size. A. Ratios of observed receptive field size of cells in MT to the size expected from the MT regression equation. As expected, the distribution of ratios is centered on 1.0. B. Ratios of observed receptive field size of cells in MTp to the size that would be expected by the MT regression equation. Although the distribution is now normal, it is centered nearly on 1.0. Thus, MTp fields are the size that would be predicted of MT fields, if MT fields were to extend into the periphery. C. Ratios of observed receptive field size of cells in MST to the size expected from the MST regression equation. As expected, the distribution is normally distributed about 1.0. D. Ratios of observed receptive field size of cells in MTp to the size that would be expected by the MST regression equation. The distribution of ratios is centered on 0.6. Thus, MTp fields are smaller than MST fields, taking eccentricity into account.
In summary, receptive fields of cells in MT and MTp collectively covered most of the contralateral visual field. In addition, throughout this combined region, receptive fields were directionally selective and a single function described the relationship between receptive field size and eccentricity. Based on both these physiological similarities and the fact that MT and MTp together are required to process the full outputs of V1 within the STS, we regard MT and MTp as two parts of a single visual area. Nevertheless, because of the difference in myelination and because of evidence described below for discontinuities in the visual field representation at the border between MT and MTp, it is useful to maintain some distinction between the two regions.
Representative receptive field sequences through MT and adjacent areas
The visuotopic organization of the multiple areas in the STS is illustrated in Figures 9-11, which show receptive fields of cells recorded on rows of penetrations through the sulcus. The receptive fields shown are representative and do not include those from all of the cells recorded.
Figure 9 illustrates the results from a row of penetrations in case 2 through the posterior portion of the caudal STS, where the lower peripheral field representation of MT is bordered laterally by the lower peripheral field representation of V4t and medially by the central field representation of MST. Receptive fields of cells at the V4t/MT border are located on the vertical meridian (sites 5, 6), and receptive fields of cells near the V4t/V4 border are located closer to the horizontal meridian (sites 3, 4). Although this tendency for receptive fields near the V4t/V4 border to lie closer to the horizontal than to the vertical meridian was noted on other rows of penetrations through V4t, it is difficult to be certain of any organization because of the narrow width of V4t and the large receptive field size and scatter within this region.
As one traverses MT at this level, one finds a systematic progression through the representation of the lower visual field periphery (sites 6–10). Just medial to MT, within what we would consider to be MST, receptive fields shift abruptly from the peripheral to the central visual field (sites 11, 12). Thus, at this posterior level, there is a clear visuotopic boundary between MT and MST. We found projections from MT into this portion of MST in our anatomical cases—especially, but not exclusively, in those cases involving the central visual field of MT (see Ungerleider and Desimone, ’86b: Figs. 5, 12). The border between MST and the posterior parietal cortex, or PP, is more problematic. We estimated the medial border of MST to be at site 12 in this section because we did not see MT projections further medial than this location in our anatomical cases. Some of the receptive fields of cells recorded beyond the hypothesized MST border are extremely large, including nearly the entire contralateral visual field (sites 16, 17).
Fig. 12.
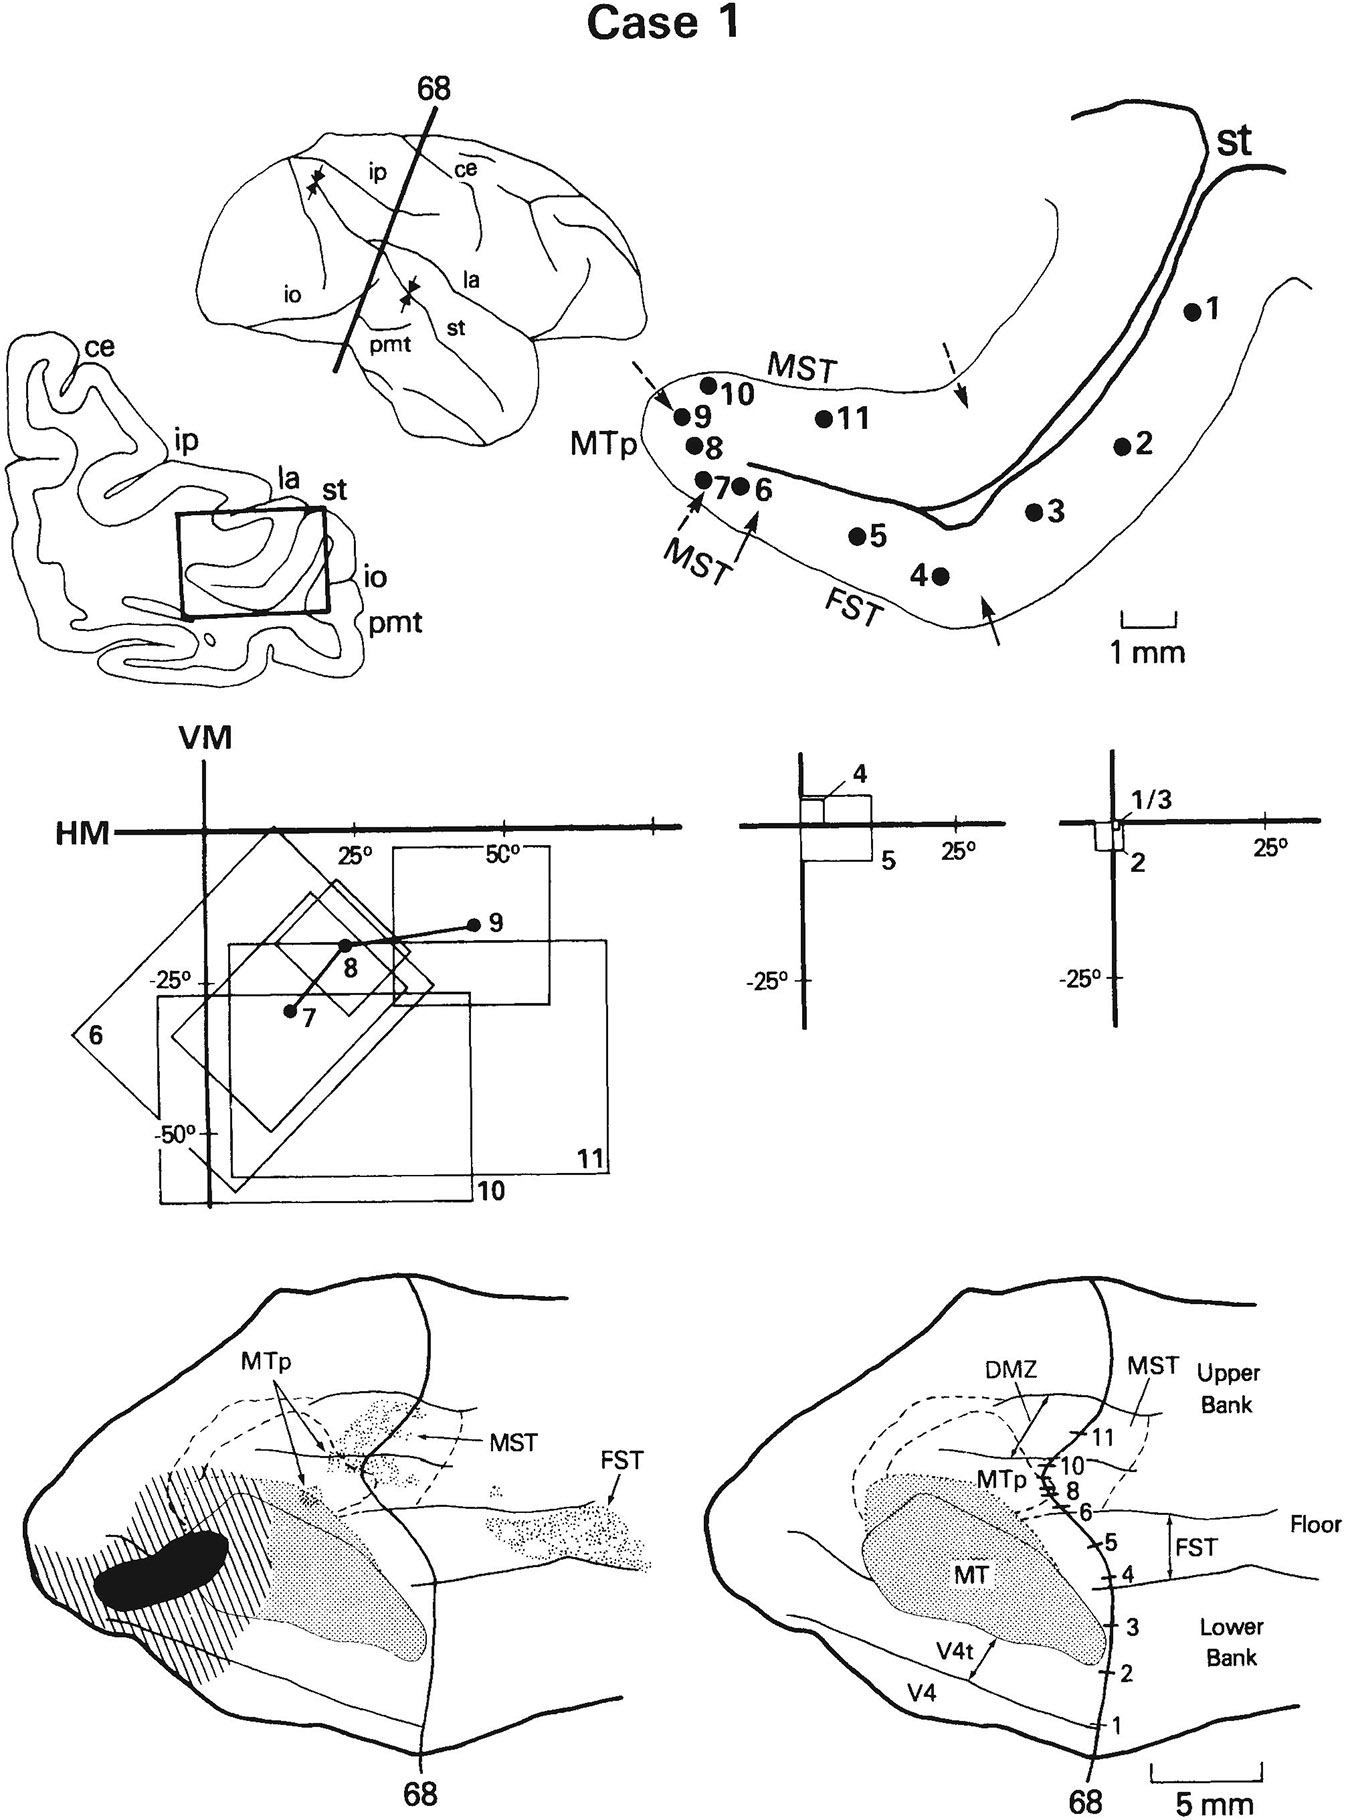
Case 1: Receptive fields of cells recorded on a row of penetrations anterior to MT and their relationship to the projection fields of MT. An injection of tritiated amino acids was placed on the MT border at an eccentricity of 34°; the receptive field of cells recorded at the injection site is shown in Figure 13. The injection site is shown in black, the halo surrounding the injection as well as nonspecific internal connections are indicated by hatching, and transported label resulting from the injection is indicated by dots. Note that cells recorded in MST are located within the projection field (sites 10, 11) and have receptive fields that overlap the field recorded at the injection site (see Fig. 13 for comparison). See also Figure 1 for abbreviations and Figure 8 for conventions.
At more anterior levels, any visuotopic boundaries between MT and the areas either medial or lateral to it are more subtle. Examples are shown from cases 1 and 2 in Figures 10 and 11, respectively. In both cases, receptive fields of cells lateral to MT, in V4t and V4, and within MT are located at the center of gaze, with no clear visuotopic organization (sites 1–6, Figs. 9, 10). MT can be distinguished from V4t, however, not only myeloarchitecturally but also by the high incidence of directionally selective cells in MT and the paucity of such cells in V4t (Fig. 2D).
Medial to the heavily myelinated border of MT in these sections, within what we would consider to be MTp, most receptive fields are located in the upper visual field periphery. The representation of the upper peripheral field was missing from MT itself, consistent with the hypothesis that a single visual field representation spans MT and MTp. However, visuotopic anomalies may occur near the MT/MTp border. In case 1, for example, as we moved just medial to the most heavily myelinated portion of MT into the myeloarchitectural transition zone and MTp, we found that receptive fields dipped unexpectedly into the lower visual field (sites 7, 8, Fig. 10) before progressing into the upper field (sites 9–12, Fig. 10). This portion of the lower visual field, located where the upper visual field is expected, is represented in MT further posterolaterally (see Fig. 2A,C). Thus, a change in myelination appears to be associated with a re-representation of a part of the lower visual field. A somewhat different visuotopic anomaly is present in case 2. In this case, as we moved medial to the border of MT, we found that receptive fields shifted abruptly from the center of gaze (site 6, Fig. 11) to an eccentricity of 17° in the upper visual field (site 7, Fig. 11). Such an abrupt shift again indicates some type of visuotopic anomaly at the MT/MTp oorder.
In summary, near the posterior end of the STS one can distinguish on the basis of visuotopic organization among at least five different visual areas, namely, V4, V4t, MT, MST, and the STS portion of the posterior parietal cortex. Laterally, there is a tendency for V4 and V4t to be separated by a representation of the horizontal meridian, while V4t and MT are separated by a representation of the vertical meridian. Medially, the peripheral representation of MT is easily distinguished from the central representation of MST, and MST can be distinguished from the posterior parietal cortex based on receptive field size. At somewhat more anterior levels in the STS, it becomes more difficult to distinguish among areas based on visuotopic organization alone. Laterally, the central field representation of MT can be distinguished from that in the adjacent V4t only on the basis of myeloarchitecture and the relative incidences of directionally selective cells. Medially, the visual field representations in MT and MTp are not grossly disparate, but there may be discontinuities between them. At more anterior levels of the STS, like at its posterior end, MST is distinguished from visual areas located medial to it primarily on the basis of its smaller receptive fields.
Representative receptive field sequences through FST and adjacent areas
At still more anterior levels through the STS, penetrations pass through area FST in the floor of the sulcus. Two rows of penetrations from case 1 are shown in Figures 12 and 13. Because these penetrations passed through regions receiving MT projections, the distribution of label in the STS is shown as well. The center of the receptive field recorded at the injection site was located at an eccentricity of 34° in the lower visual field (see Fig. 13). Although the injection included parts of V4t and V4, the projections in this case were very similar to our other anatomical cases in which the injections were limited to MT (Ungerleider and Desimone, ’86b).
Fig. 13.
Same case as in Figure 12, but receptive fields shown are from a more anterior row of penetrations. The receptive field of cells recorded at the injection site is indicated in black at left. Note that in this row, cells recorded in FST are located within the projection field (sites 4–6) and have receptive fields that overlap the field of cells recorded at the injection site (see Fig. 12 for comparison). See also Figure 1 for abbreviations and Figure 8 for conventions.
In both rows of penetrations, receptive fields of cells in FST and in the cortex lateral to it (either area V4 or TEO) included the center of gaze; however, FST can be distinguished from the lateral cortex on the basis of the larger average receptive field size in FST. In the more posterior of the two rows (Fig. 12), FST is bordered medially by MST and MTp, but in the more anterior row (Fig. 13) it is probably bordered medially by STP (Desimone and Gross, ’79). FST is easily distinguished from MST and MTp medially, on the basis of both the abrupt shift from the central to peripheral visual field (sites 4, 5 vs. 6–11, Fig. 12) and by a sharp increase in directional selectivity of the cells (see Fig. 2D). There is a suggestion of a shift from the representation of the horizontal meridian to the representation of the vertical meridian between MTp and MST (site 9 vs. 10, Fig. 12), but receptive fields are very large in this region, and it is therefore difficult to be certain of any visuotopic organization. We were unable to drive the units medial to MST in the upper bank of the STS.
The anatomical results shown in Figures 12 and 13 indicate that there is a close association between the locus of the receptive field of cells at the injection site and the portion of the visual field represented in the projection zones. In the posterior row of penetrations (Fig. 12), for example, terminal label was located in MST (sites 10, 11) and a very small portion of MTp (site 9), where receptive fields of cells overlapped the receptive field of the cells recorded at the MT injection site (see Fig. 13). Interestingly, there was an additional small patch of label located at the medial border of MT, where the anomalous lower field representation at the MT/MTp border was found (site 8, Fig. 10). In the anterior row of penetrations (Fig. 13), which traversed the part of FST in which terminal label was found, receptive fields extended up to 30° into the lower visual field, again overlapping the field recorded from cells at the injection site. Thus, even neurons in FST, an area with little or no conventional visuotopic organization, have a close anatomical association with neurons in MT that respond to stimuli in the same portion of the visual field.
From the results of case 1, it would appear that MT projects predominantly to MST rather than to MTp. Although there was a small amount of label within MTp in this case, this label might have derived from projections from the peripheral representation of V4 or V4t, rather than MT, as there was spread of the injection into these areas. Alternatively, the projection to MTp could represent an internal connection of the MT/MTp complex.
In case 2, there was a single row of penetrations that passed through areas FST and MST, as illustrated in Figure 14. The injection in this case was centered in MT at an eccentricity of 11° in the lower visual field representation, but there was considerable leakage of label into the superficial layers of the upper bank of the STS, within PP. Consequently, there were projections within the upper bank of the STS that extended far more medially and anteriorly than in cases with injections restricted to MT.
Fig. 14.
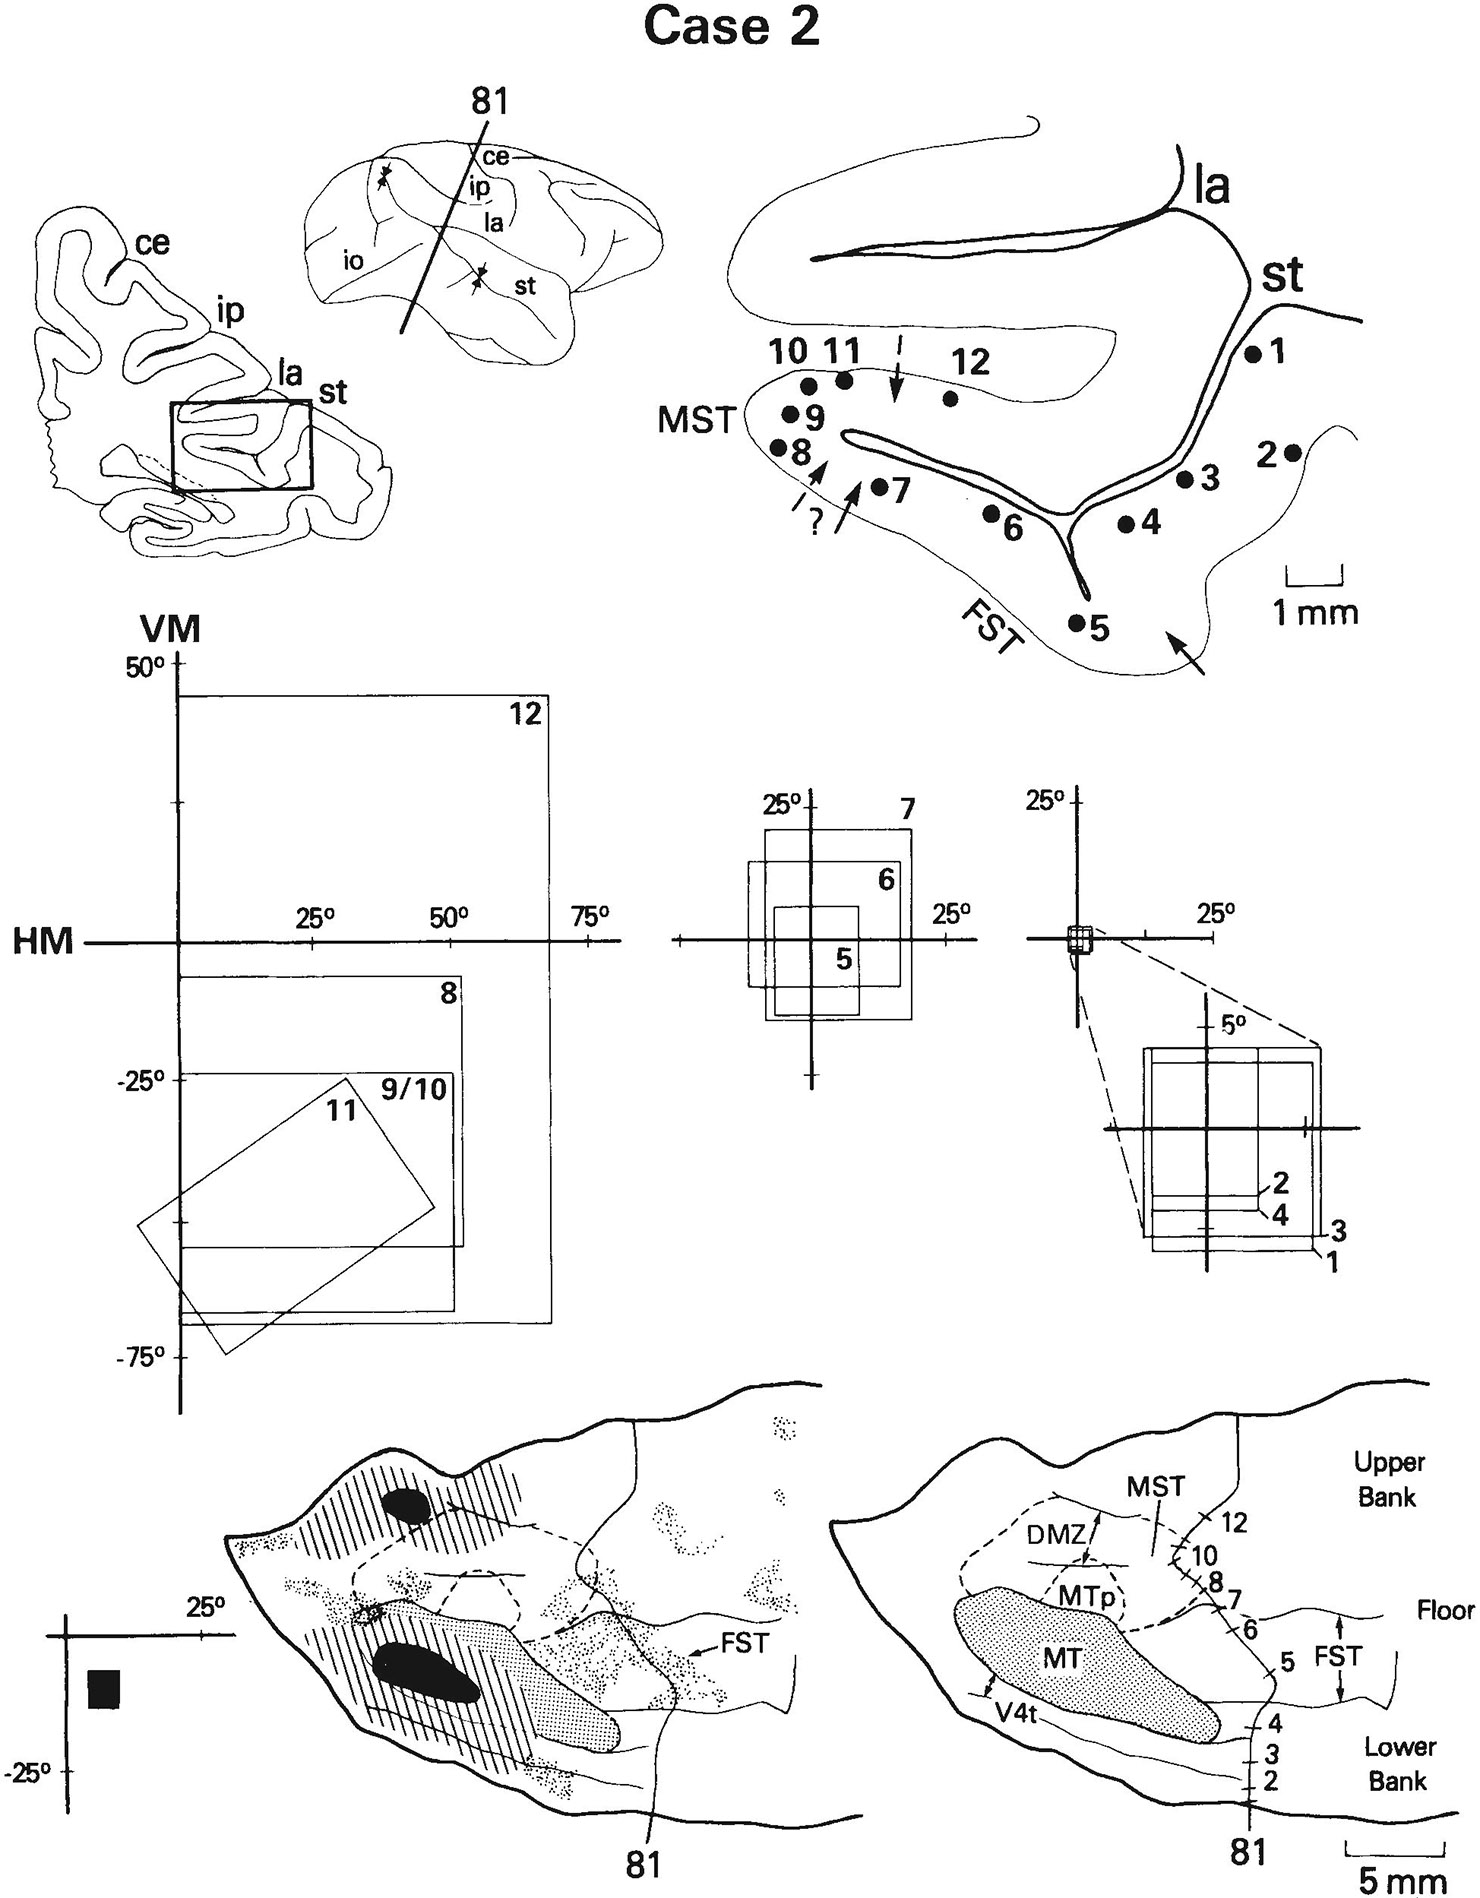
Case 2: Receptive fields of cells recorded on a row of penetrations anterior to MT and their relationship to projections of MT in FST. Receptive field of cells recorded at the injection site had an eccentricity of 11°, shown in black at the left. As in the example of Figure 13, cells recorded in FST are located within the projection field (sites 5–7) and have receptive fields that overlap the field of cells recorded at the injection site. See also Figure 1 for abbreviations and Figures 8 and 12 for conventions.
The sequence of receptive fields closely resembled that found in case 1. Although receptive fields of cells in both FST (sites 5–7) and on the lateral bank of the STS (sites 1–4) included the center of gaze, those in FST could be distinguished from those on the lateral bank on the basis of increased receptive field size in FST. FST could also be distinguished from MST medially, due to an abrupt shift of the representation from the central into the lower peripheral field (sites 5–7 vs. 8–11). One field was from a site medial to MST, and, consistent with the large receptive fields found from similar sites on other rows, it included nearly the entire contralateral visual field (site 12). As in case 1, portions of FST and MST in case 2 were located within the MT projection zone, and the receptive fields of cells in these portions of FST and MST generally overlapped the field of cells recorded at the injection site. There was a complete absence of label within MTp in this case.
A final example is taken from case 3, with injections of the retrograde fluorescent tracers fast blue (FB) and diamidino yellow (DY) at eccentricities of 9° and 16° in the upper and lower visual field representations of MT, respectively (Fig. 15). The FB injection spread into the upper bank of the STS, and consequently the FB-labeled region in this case must be interpreted cautiously.
Fig. 15.
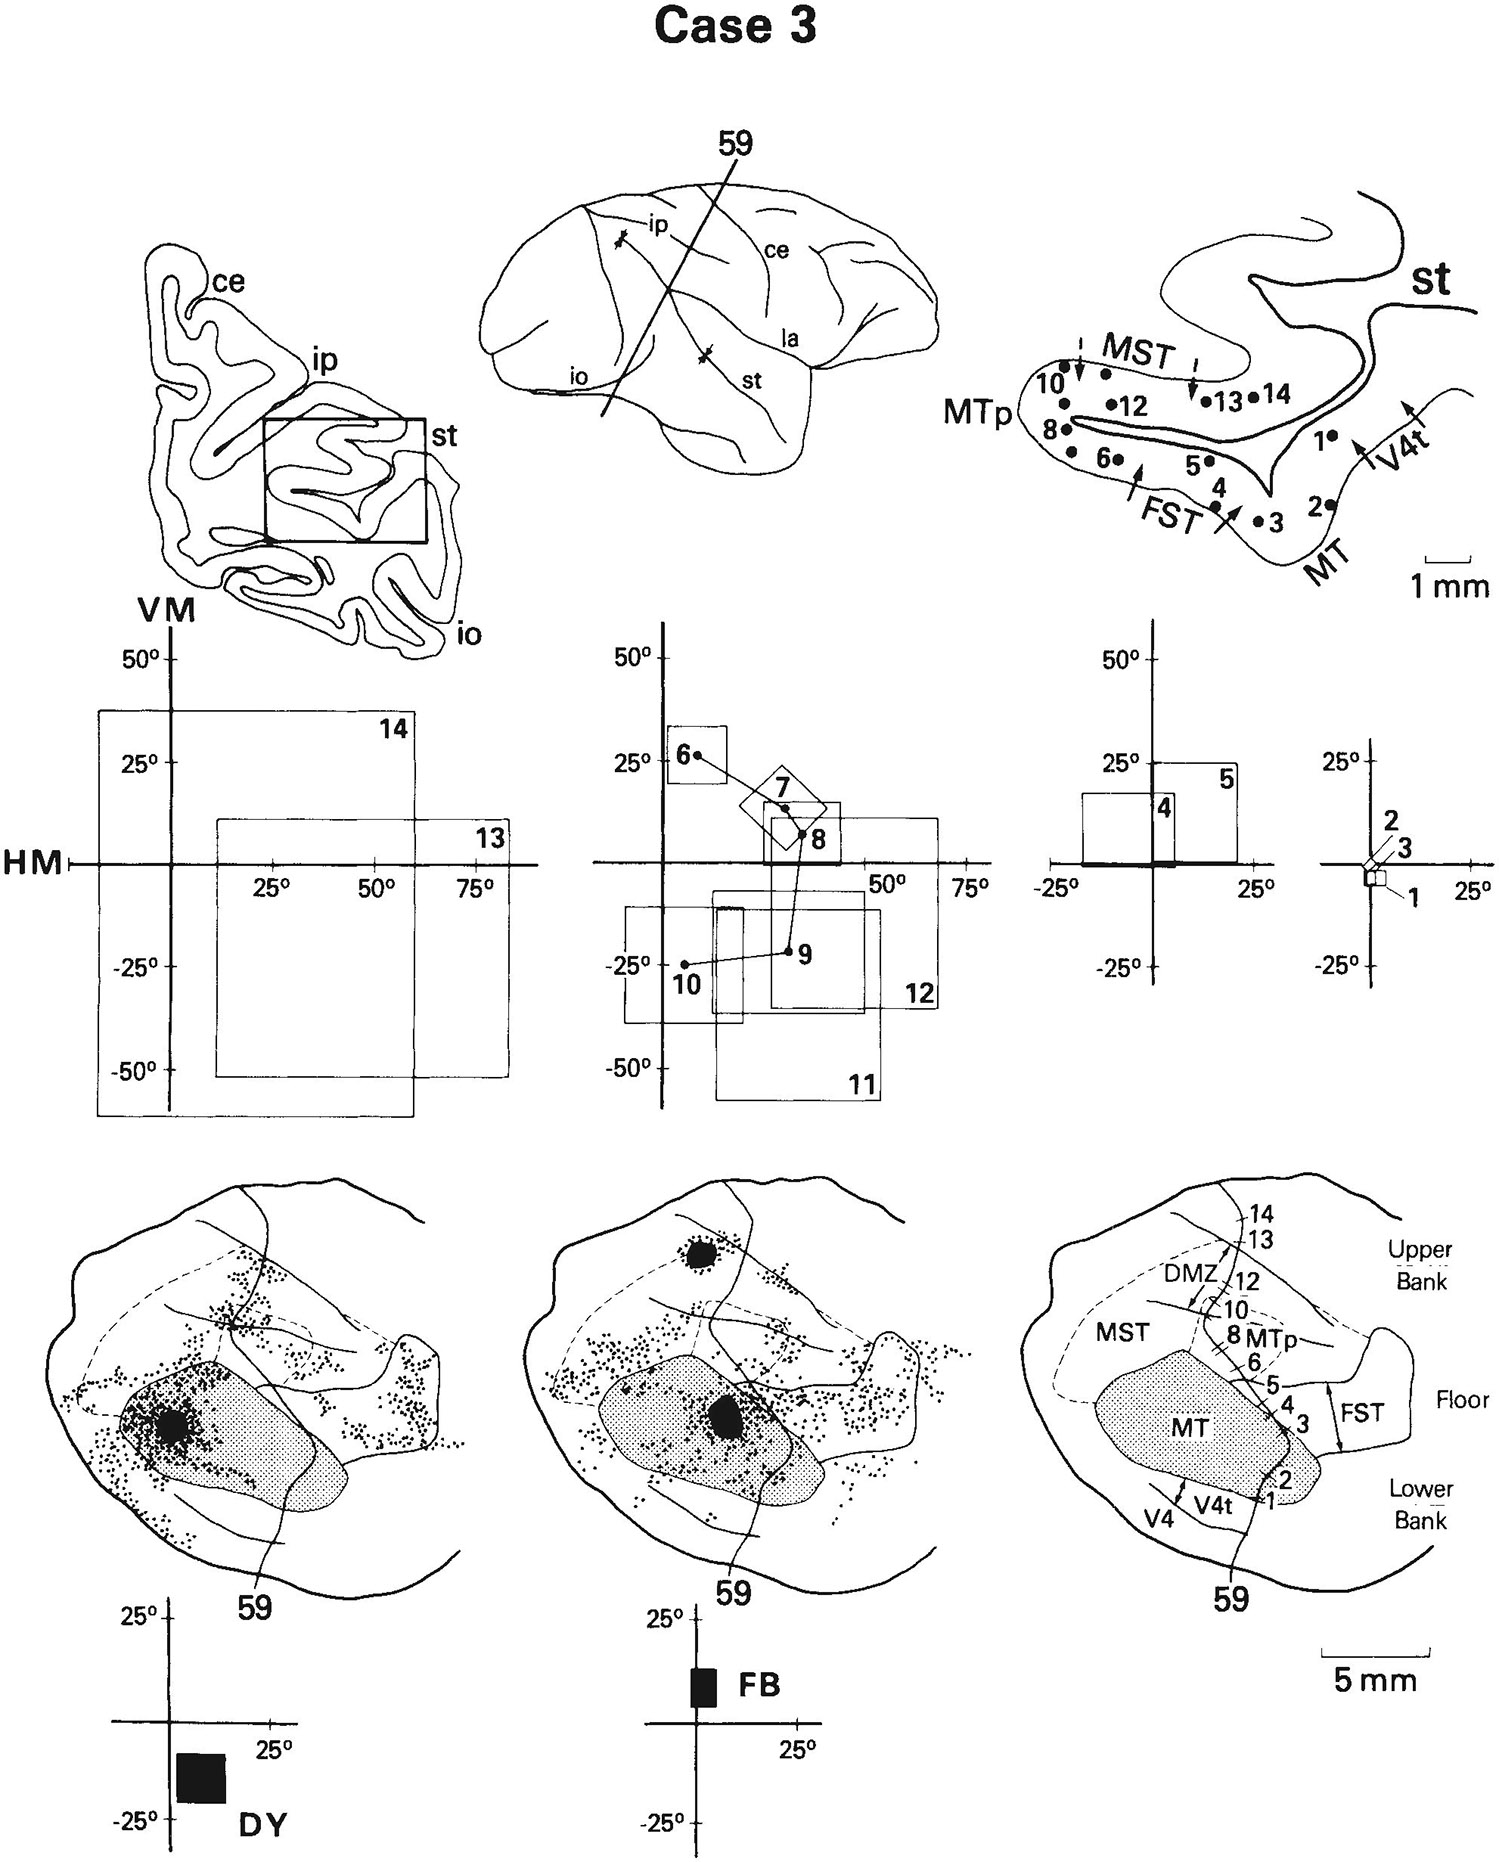
Case 3: Receptive fields of cells recorded on a row of penetrations through MT and through adjacent areas that are retrogradely labeled following injections of fluorescent dyes into MT. The fluorescent dyes fast blue (FR) and diamidino yellow (DY) were injected into the representations of the upper and lower fields in MT, respectively. In FST, receptive fields (sites 4 and 5) of cells overlap the receptive field of cells recorded at the FB injection site (upper field), and in MTp and MST, receptive fields (sites 9–12) of cells overlap or come close to the receptive field of cells recorded at the DY injection site. See also Figure 1 for abbreviations and Figures 8 and 12 for conventions.
As in the previous examples, the receptive fields of cells in FST either included the center of gaze or came close to it (sites 4, 5). Between FST and MTp, there was a shift into the upper peripheral field representation (site 5 vs. 6) and an increase in the incidence of directionally selective cells (Fig. 2D). Within MTp, there was a systematic progression of receptive fields from the upper (site 6) to lower (site 10 peripheral visual field. Further medially, within what we would consider to be MST (sites 11, 12), receptive fields remained in the lower peripheral field, but were larger than in MTp, There was yet another increase in field size medial to MST (sites 13, 14).
In case 3, as in cases 1 and 2, there was a close correspondence between the receptive fields of cells recorded at the MT injection site and the receptive fields of cells recorded within the labeled region, even though in case 3 the region was labeled with a retrograde rather than an anterograde tracer. There was a heavy concentration of FB label (upper field injection) within FST, and receptive fields of cells in this portion of FST (sites 4, 5) overlapped the field of cells recorded at the FB injection site. By contrast, there was a heavy concentration of DY label (lower field injection) within MST and the most medial part of MTp, and receptive fields of cells in these regions (sites 9–12) again usually overlapped the field of cells recorded at the DY injection site. As in case 1, the presence of label in MTp might represent an internal connection of the MT/MTp complex.
In summary, V4/TEO, FST, MTp, MST, and the cortex medial to MST can be distinguished from one another on the basis of either visuotopic organization or receptive field size or incidence of directionally selective cells. Receptive fields of cells in anterior V4 and TEO are small, located at the center of gaze, and not commonly directionally selective. Fields of cells in FST are also located at the center of gaze but are much larger than those in V4 and TEO, and a few are directionally selective. For cells medial to FST, in MTp or MST, receptive fields are located in the peripheral visual field and almost all are directionally selective. Finally, for cells medial to MST, there tends to be an additional increase in receptive field size, some fields including nearly the entire contralateral visual field. Although any visuotopic organization in the areas surrounding MT is coarse, the anatomical results indicate that points in MT are connected with points in the surrounding areas that cover the same portion of the visual field.
DISCUSSION
During the past 15 years, multiple representations of the visual field have been found in the extrastriate cortex of a variety of species. In the owl monkey, for example, at least eight partial or complete representations of the contralateral visual field have been described in extrastriate cortex (Kaas, ’78; Allman et al., ’81), and in the cat there have been 12 (Tusa et al., ’81). In the macaque, by contrast, the parceling of extrastriate cortex beyond area V2 into separate representations of the visual field has proven to be surprisingly difficult. The problem appears to stem from a combination of a large, gyrencephalic brain, large receptive field size, apparently random scatter in field position, individual differences in visuotopic organization and connections, and complex mappings of the visual field. Even in area MT, which receives a direct projection from V1, the visual field representation has been characterized as “crude and essentially quadrantic” (Dubner and Zeki, ’71), a “mosaic” (Van Essen et al., ’81), and having “a high degree of scatter” (Gattass and Gross, ’81).
Given the complexities of visuotopic organization within MT, it is not surprising that MT’s projection fields within the caudal STS do not contain precise maps of the visual field. Nonetheless, we have been able to divide the cortex of the caudal STS into a number of different areas. Areas V4, V4t, FST, and MST receive direct projections from MT, while area TEO and the posterior parietal cortex do not. The divisions among the areas are based on distinctive myeloarchitecture, neuronal properties, visuotopic organization, and pattern of connections with MT. We believe each of these distinctions may be useful in that each will lead us to look for underlying differences in function.
Representation of the far peripheral visual field in MTp
As MTp can be positively identified only on the basis of anatomical criteria, namely, the projections from the far peripheral representation of V1, we could only estimate its location in our physiological cases. Receptive fields of cells within the estimated MTp covered much of the far peripheral visual field that was missing from the representation in MT and were about the size that would be expected of MT fields, if the visual field representation in MT were to extend to the periphery.
Other studies have found results similar to ours in MT and MTP but have interpreted them differently. Gattass and Gross (’81) argued that there is only a loose relationship between the heavily myelinated zone and the complete visual field representation of MT. They found, as we did, that the heavily myelinated zone contained a representation of only about the central 25° of the visual field. They also found, as we did, that the peripheral field was represented both medial and lateral to the heavily myelinated zone. However, they included portions of both the medial and lateral cortex within MT, whereas we excluded the lateral cortex from MT as it is not directionally selective and does not receive a projection from V1; furthermore, we made some distinction between the heavily myelinated zone and the cortex medial to it, i.e., MTp, because of both the difference in the myelination and the visuotopic anomalies between them.
Van Essen et al. (’81) argued that there is a precise relationship between MT and the heavily myelinated zone. Although they did not find a complete representation of the visual field within MT, they reasoned that the periphery could be represented within the parts of MT that were spared in their recordings. However, they found, as we did, that there was substantial variability among animals in the extent of the visual field represented within the heavily myelinated zone. In one of their cases (their Fig. 10), the representation of the central 20° (the limit of their recordings) occupied about half of the heavily myelinated zone, whereas in another of their cases (their Fig. 11) it occupied at least 90%. It seems reasonable to conclude that in at least some of their cases the visual field representation within the heavily myelinated zone was incomplete. Van Essen et al. considered such a possibility but excluded the cortex medial to the heavily myelinated zone from MT because receptive fields were larger for cells recorded medially and sometimes were in an inappropriate visuotopic location. Since they did not illustrate any fields of cells recorded medial to the heavily myelinated zone, we do not know if the fields were larger simply because they were located in the peripheral visual field or because they were actually MST fields rather than MTp fields. We concur with them, however, that there are sometimes visuotopic anomalies beyond the heavily myelinated border, and, for both that reason and the difference in myelination, we distinguish MTp from MT.
Possible subdivisions within MST
There is at least a crude visuotopic organization in MST; receptive fields of cells in the posterior part of MST emphasize the central visual field, whereas receptive fields of cells in the anterior part of MST emphasize the peripheral visual field. Likewise, some parts of MST appear to emphasize the upper visual field and other parts the lower visual field. Notwithstanding this gross topography, MST may ultimately be subdivided into different regions or areas. If myeloarchitectural differences signify functional differences, then one possible subdivision within MST is the densely myelinated zone (DMZ) on the upper bank of the STS, in which cells have receptive fields located predominantly in the peripheral visual field. Another possible subdivision is the representation of the central visual field in the posterior part of MST, located posterolateral to the densely myelinated zone. In some cases with injections of MT, there were split projections to this posterior zone and to the more anterior parts of MST (Ungerleider and Desimone, ’86b), suggestive of separate areas. Consistent with the anatomy, receptive fields of cells in the posterior, central field region of MST were so large that many covered some of the same portions of the visual field as receptive fields of cells in the anterior, peripheral field region. If either the densely myelinated peripheral field zone or the more lightly myelinated central field zone is found to have distinctive neuronal properties or anatomical connections, it would probably be useful to consider that zone separately from the remainder of MST.
Visuotopic organization of V4 and V4t
The visuotopic organization of V4 has been investigated by others and is a matter of some dispute. Maguire and Baizer (’84) have reported that V4 on the prelunate convexity, excluding V4t, contains at least two separate systematic representations of the lower visual field, while Gattass et al. (’85) have described only a single coarse map. Because our recordings in V4 were limited to the portion in the STS, we cannot address this issue. However, it is interesting in this regard that receptive fields of cells confined to just the STS portion of V4 covered virtually the entire lower visual field out to an eccentricity of 30°–40°. If there is equivalent redundancy of the visual field representation in other parts of V4, it may be possible to divide V4 in a variety of ways, each part with its own representation of the visual field.
One possible way of understanding both V4t and the multiple representations of points in the visual field in V4 is that they have an organization analogous to the slab (columnar) systems in V1 or the cytochrome oxidase strips in V2. In V1, a small part of the visual field is represented in one ocular dominance slab and is re-represented in an adjacent slab (Hubel and Wiesel, ’74). In V2, we can speculate that portions of the visual field are re-represented in adjacent cytochrome oxidase strips (Tootell et al., ’83), since it has been reported that adjacent strips contain neurons sensitive to different sensory qualities, such as color and motion (DeYoe and Van Essen, ’85; Shipp and Zeki, ’85). If V4 were characterized by an analogous organization, but on an even larger scale, then one might find entire quadrants of the visual field re-represented in adjacent strips or zones. Thus, in this scheme, even V4t could be considered to be a strip within V4, with its own unique myeloarchitecture, neuronal properties, and anatomical connections.
A system for motion analysis
There appears to be a hierarchical organization for motion analysis in the cortex, involving several visual areas. The system begins with cells of striate cortex in both layer IVB and, to a lesser extent, layer VI, which are directionally selective (Dow, ’74; Livingstone and Hubel, ’84) and project to MT (Lund et al., ’75; Maunsell and Van Essen, ’85a; Ungerleider and Desimone, ’86b). Within MT, at least two transformations of the information provided by striate cells take place. First, MT cells have receptive fields about eight to ten times larger in linear dimension, or 60–100 times larger in area, than receptive fields of cells in striate cortex. Second, whereas cells in striate cortex are sensitive to the direction of motion of Fourier components in a complex pattern, many MT cells are sensitive to global motion, i.e., the vector sum of the component motions (Movshon et al., ’85).
The next transformation of motion information occurs in MST, to which MT projects (Maunsell and Van Essen, ’83a; Ungerleider and Desimone, ’86b). MST cells have even larger receptive fields than cells in MT (Fig. 4), and some MST cells were found to be selective for the expanding or contracting image of an object moving in depth. Furthermore, the responses of many MST cells are related to tracking eye movements (Newsome and Wurtz, ’82), suggesting that MST may actually use information about direction of stimulus motion for oculomotor control. Finally, MST provides inputs to both PP, the posterior parietal cortex, and STP, the superior temporal polysensory area (unpublished data; C.J. Bruce, personal communication), and either region, or both, may contain a next stage of motion processing.
For cells in both PP and STP, receptive fields are even larger than those in MST. Some receptive fields of PP cells include the entire contralateral visual field (Figs. 9-11, 14, 15), and most receptive fields of STP cells include virtually the entire visual field, including both monocular crescents (Bruce et al., ’81). Although some of the properties of cells in PP and STP resemble those in MST, such as sensitivity to tracking eye movements in PP (Sakata et al., ’83) and movement in depth in both PP and STP (Bruce et al., ’81), other properties emerge for the first time. Some cells in PP and STP, for example, are selective for rotational motion, and others are selective for motion directed toward or away from the fovea, i.e., motion that would be produced by optical flow (Bruce et al., ’81, ’86; Motter and Mountcastle, ’81; Saito et al., ’84). In addition, some cells in both PP and STP receive polysensory inputs (Fig. 2B; Desimone and Gross, ’79; Bruce et al., ’81). Thus, neurons along the sequence of areas from V1 through MT to MST, and then to PP and STP, integrate motion information over an increasingly large portion of the retina, respond selectively to more complex types of motion, respond to inputs from additional sensory modalities, and may become more directly involved in oculomotor control.
It is possible that area FST also contributes to the system for motion analysis. Many cells in FST were difficult to drive, and some could be driven well only by twisting or rotating complex three-dimensional objects within the receptive field. The presence of the cells that responded to complex motion, in conjunction with the finding that 32% of the cells in FST were actually directionally selective, suggests that motion is indeed analyzed in FST, but in an as-yet-unknown way.
Comparisons with the owl monkey
Although the terminology used in the two species is somewhat different, there are a number of striking similarities between the macaque and owl monkey in the organization of visual areas surrounding MT. To facilitate comparisons, we show in Figure 16 the visual areas in the STS of the macaque on a flattened representation of the cortex and the areas surrounding MT in the owl monkey on a tangential section through cortex that had been physically flattened (Cusick et al., ’84).
Fig. 16.
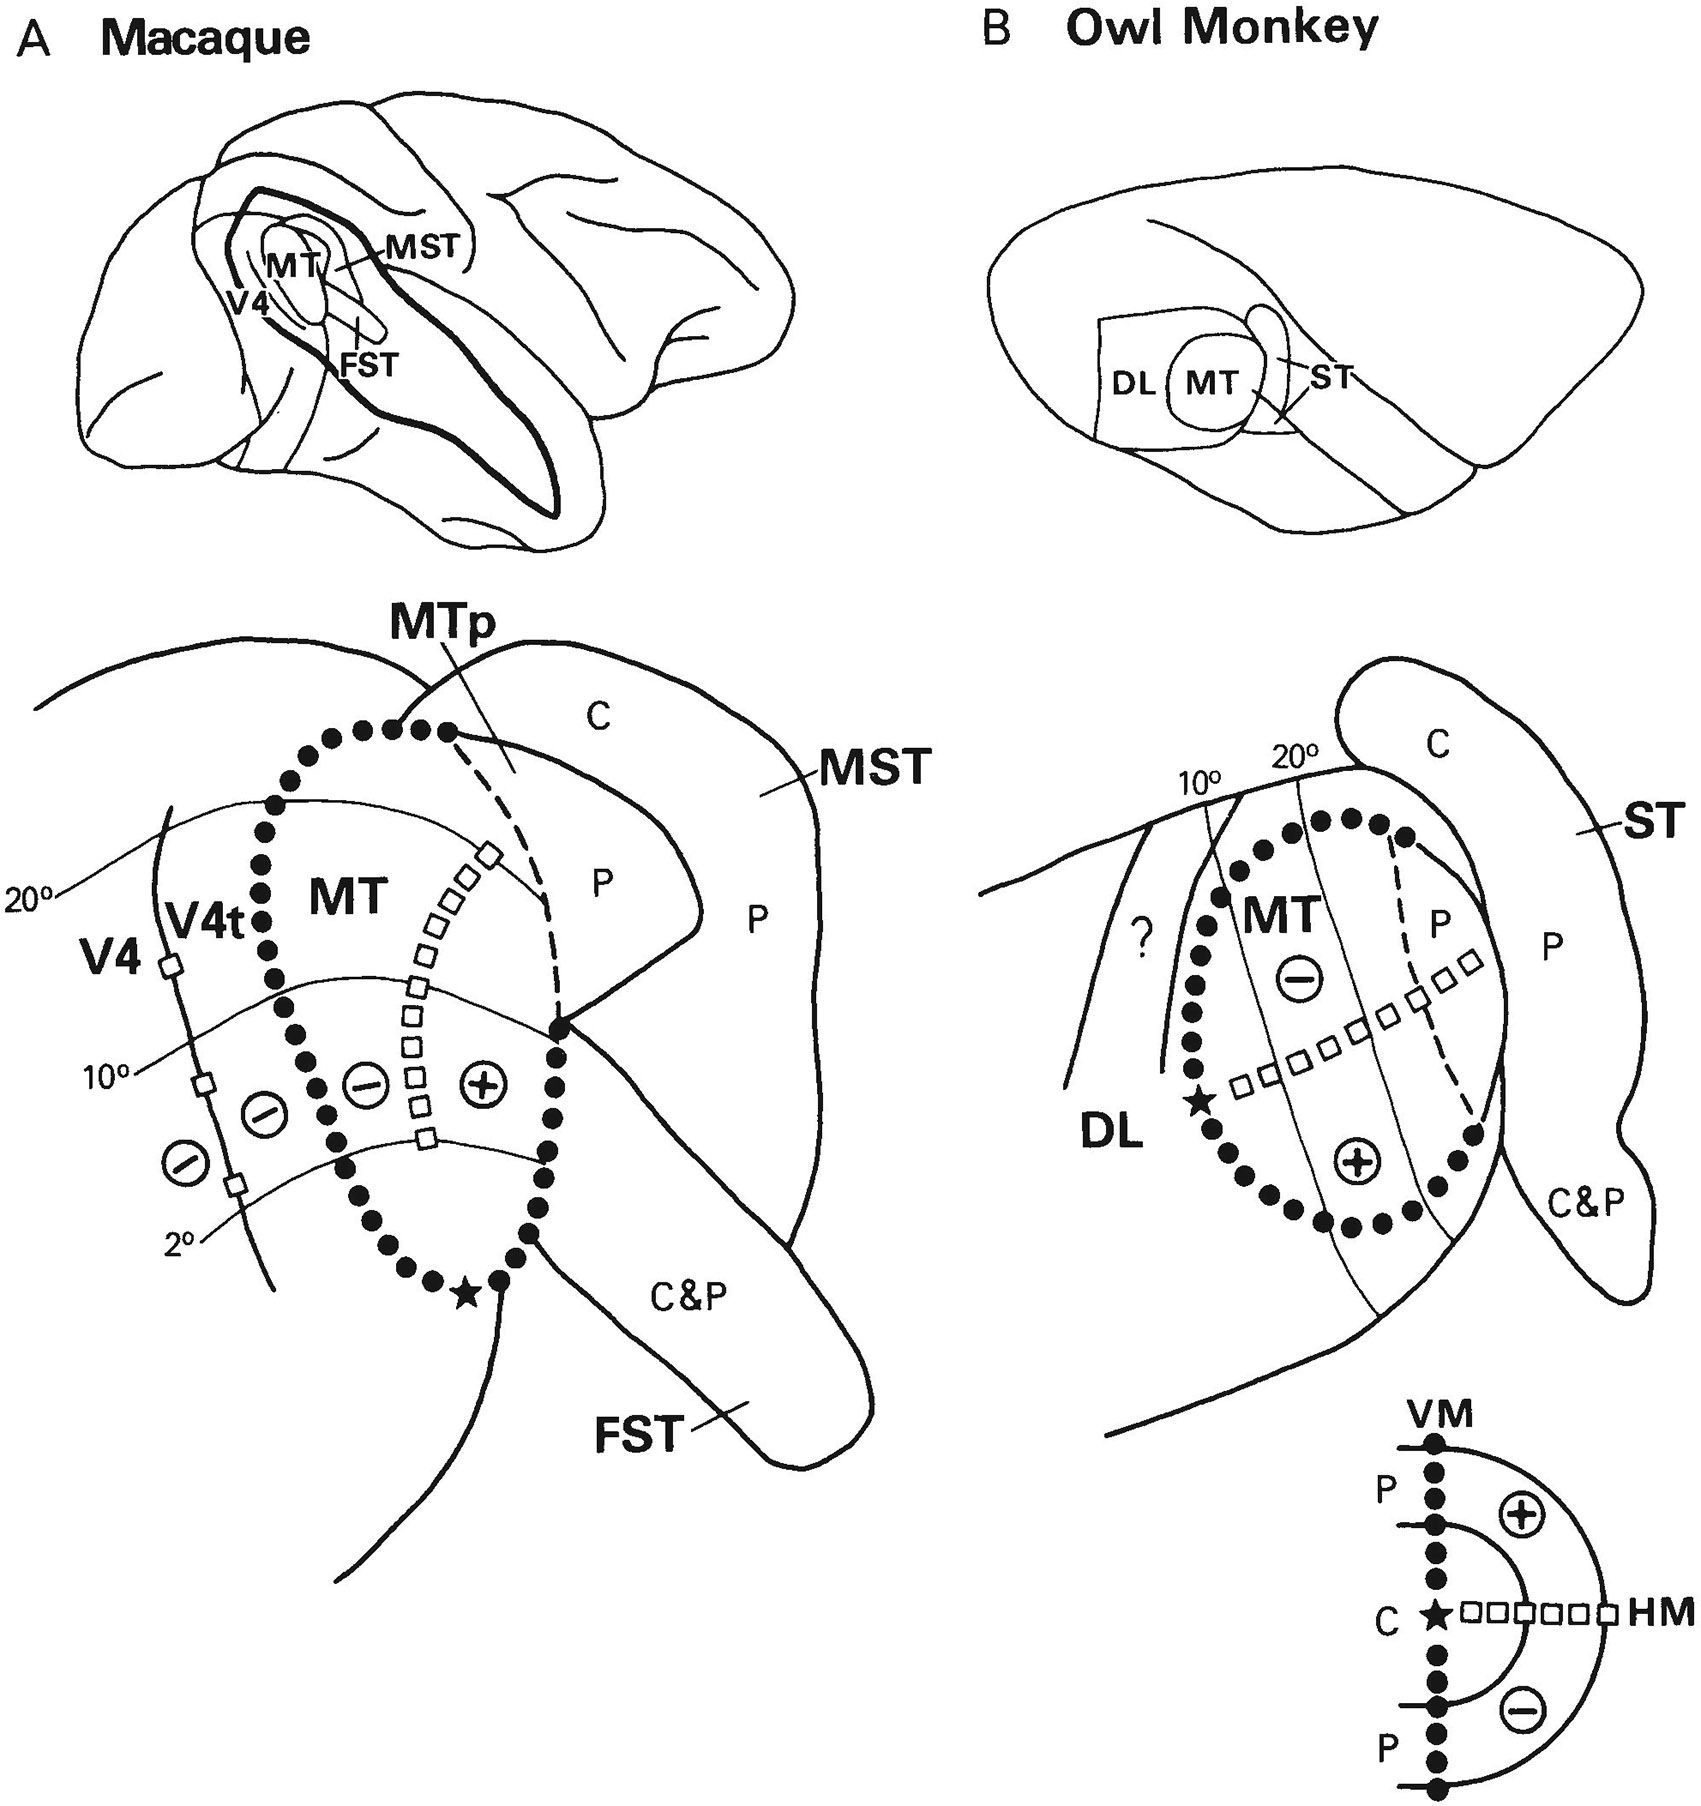
Comparison of areas surrounding MT in the macaque (A) and the owl monkey (B). Top: Relative position of areas on a lateral view of the macaque brain and on a dorsolateral view of the owl monkey brain; in the macaque, the superior temporal sulcus has been partially opened to reveal areas located within the sulcus. Bottom: Visuotopic organization of MT and surrounding areas on flattened representations of the cortex. In the macaque, the drawing is derived from results obtained in the present and companion studies (Ungerleider and Desimone, ’86a,b) and from the data of Ungerleider et al. (’83) and Gattass et al. (’85). In the owl monkey, the drawing is a modification from Cusick et al. (’84) of a tangential section through cortex that had been physically flattened. The data of Weller et al. (’84) were used to estimate the borders and organization of area ST, and the data of Allman and Kaas (’71, ’74) were used to estimate the visual topography of MT and DL. The dashed area within MT of the owl monkey is estimated to be the less heavily meylinated portion, which contains a representation of the far peripheral field. The zone marked with a question mark within DL is the zone of reduced callosal connections and light myelination described by Cusick et al. (’84). In both species, the respresentation of the vertical meridian is indicated by black circles, the horizontal meridian by white squares, the fovea by a star, the upper visual field by a plus sign (+), the lower field by a minus sign (−), the central field by a C, and the peripheral field by a P.
In both species, the central field representation of the striate projection zone is more heavily myelinated than the far peripheral representation (dashed line). In the macaque, the more lightly myelinated peripheral field representation is termed MTp (Ungerleider and Desimone, ’86a), whereas in the owl monkey this zone is included within MT (Allman and Kaas, ’71).
Medial and anterior to this peripheral field representation in both species is a large region that receives MT projections. In the macaque, this region includes areas MST and FST, whereas in the owl monkey the region is termed “ST” (Weller et al., ’84), a part of which may correspond to MST and a part to FST. Weller et al. (’84) suggested that ST might actually contain two separate areas because injections of amino acids within the central representation of MT resulted in two widely spaced patches of label in ST, one dorsal to MT and one ventral. We found analogous results from injections of the central field representation of MT in the macaque, namely, one patch dorsomedial and another ventromedial to MT (see Ungerleider and Desimone, ’86b: Fig. 5). From our physiological results, it is clear that the dorsomedial patch is within the central field representation of MST and the ventromedial patch is within FST. In the owl monkey, Weller et al. found that injections within almost any location in MT resulted in label in the ventral zone. Similarly, in the macaque, we found widespread label in FST in all of our MT injection cases (Ungerleider and Desimone, ’86b: Fig. 12). From our physiological results, it is clear that this convergence in FST is related to the very large receptive fields of cells in FST and an apparent absence of visuotopic organization. Finally, in the owl monkey, Weller et al. observed that injections of the peripheral field representation of MT resulted in widespread label between the dorsal and ventral poles of ST. In the macaque, we found projections to the same region relative to MT, and our physiological results indicate that this zone corresponds to the peripheral field representation of MST. Thus, there is suggestive evidence that the cortex located medial and anterior to MT in the two species is organized in a highly similar way.
Likewise, there are many similarities between the areas that lie lateral to MT in the macaque, V4 and V4t, and the area that lies in the equivalent location in the owl monkey, area DL (Allman and Kaas, ’74). First, DL receives a direct projection from V2 and provides a major input to inferior temporal cortex (Weller and Kaas, ’85), as does V4 and perhaps V4t in the macaque (Desimone et al., ’80). Second, the visuotopic organization in DL parallels that in MT, in that the lower central and peripheral field representations of the DL lie adjacent to the same representations in MT (Allman and Kaas, ’74), and the same is true of V4 and V4t in the macaque (e.g., Figs. 9-11). Third, the representation of the vertical meridian lies at the border between DL and MT in the owl monkey (Allman and Kaas, ’74), and the same is true of the border between V4t and MT in the macaque (e.g., Fig. 9). Fourth, within dorsal DL, which is itself lightly myelinated (Allman and Kaas, ’74), there is a strip of cortex with even lighter myelination (Cusick et al., ’84) and reduced callosal connections (Newsome and Allman, ’80; Cusick et al., ’84) that lies adjacent to the lower visual field representation of MT; this lightly myelinated cortex is in approximately the same relative position as area V4t in the macaque, which is also lightly myelinated and located adjacent to the lower visual field representation of MT. Finally, DL receives a projection from MT in the owl monkey (Weller et al., ’84) as do V4 and V4t in the macaque (Maunsell and Van Essen, ’83a; Ungerleider and Desimone, ’86b). The many similarities suggest that DL and V4/V4t could be homologous structures (Weller and Kaas, ’85), although Allman (personal communication) has suggested that DL is homologous with just a part of this complex, such as V4t. In Allman’s view, the remainder of V4/V4t may have evolved in the macaque as a consequence of the superior color and form vision capacities of this species.
The most striking difference between DL and V4/V4t lies in their representations of the upper peripheral visual field. In the owl monkey, mapping studies have shown that the representation of the upper peripheral visual field in DL, DL’s ventral “wing,” wraps around the representation of the upper visual field in MT (Allman and Kaas, ’74). In the macaque, V4t does not appear to contain a representation of the upper visual field, and the representation of the upper visual field in V4 lies on the ventral aspect of the hemisphere, far from MT (Ungerleider et al., ’83; Gattass et al., ’85). This apparent difference between DL and V4/V4t leads us to ask whether the upper peripheral visual field representation of DL could be reinterpreted to actually lie on the ventral aspect of the hemisphere as is true of V4 in the macaque. At least two representations of the upper visual field have been found on the ventral aspect of the hemisphere in the owl monkey, either of which could conceivably be considered part of DL (see Newsome and Allman, ’80). If so, then the upper visual field representation that has previously been described for DL (i.e., DL’s ventral wing) would have to be considered to be part of a different visual area, such as an extension of ST or an as-yet-undefined area.
Can the location of the upper peripheral field representation of DL be established with certainty? One approach would be to examine projections from the upper peripheral field representation of V2 in the owl monkey. Although there are known to be strong projections to DL from the lower and central field representations of V2 (Kaas and Lin, ’77), projections from the upper peripheral field representation of V2 have not yet been determined. If the upper peripheral field representation of V2 were to project to cortex on the ventral aspect of the hemisphere (as it does in the macaque) rather than to the ventral wing of DL, then DL might be reinterpreted to have an organization more like V4. The absence of a projection to the ventral wing of DL might not be conclusive, however, given the known asymmetries in the anatomical connections of the upper and lower visual field representations of other extrastriate areas. In any event, these questions about DL’s ventral wing, a very small strip of cortex, may serve to emphasize that the similarities in the extrastriate cortices of Old World and New World primates are more striking than their differences.
ACKNOWLEDGMENTS
We gratefully acknowledge Mortimer Mishkin for many helpful discussions and for his support during all phases of this work. We thank Thelma W, Galkin, John N. Sewell III, and Joanna Lawrence for their skillful technical assistance. J.M. Allman, C.L. Colby, C.G. Gross, W.T. Newsome, D.C. Van Essen, and R.E. Weller provided valuable comments on an earlier version of the manuscript.
LITERATURE CITED
- Albright TD (1984) Direction and orientation selectivity of neurons in visual area MT of the macaque. J. Neurophysiol 52:1106–1130. [DOI] [PubMed] [Google Scholar]
- Albright TD, Desimone R, and Gross CG (1984) Columnar organization of directionally selective cells in visual area MT of the macaque. J. Neurophysiol 51:16–31. [DOI] [PubMed] [Google Scholar]
- Allman JM, and Kaas JH (1971) A representation of the visual field in the caudal third of the middle temporal gyrus of the owl monkey (Aotus trivirgatus). Brain Res. 31:85–105. [DOI] [PubMed] [Google Scholar]
- Allman JM, and Kaas JH (1974) A crescent-shaped cortical visual area surrounding the middle temporal area (MT) in the owl monkey (Aotus trivirgatus). Brain Res. 81:199–213. [DOI] [PubMed] [Google Scholar]
- Allman JM, Baker JF, Newsome WT, and Petersen SE (1981) Visual topography and function: Cortical visual areas in the owl monkey. In Woolsey CN (ed): Cortical Sensory Organization, Vol. 2, Multiple Visual Areas. Clifton, New Jersey: Humana Press, pp. 171–185. [Google Scholar]
- Bonin G von, and Bailey P (1947) The Neocortex of Macaca Mulatta. Urbana, Illinois: The University of Illinois Press. [Google Scholar]
- Bruce CJ, Desimone R, and Gross CG (1981) Visual properties of neurons in a polysensory area in superior temporal sulcus of the macaque. J. Neurophysiol 46:369–384. [DOI] [PubMed] [Google Scholar]
- Bruce CJ, Desimone R, and Gross CG (1986) Both striate cortex and superior colliculus contribute to visual properties of neurons in the superior temporal polysensory area of the macaque. J. Neurophysiol, in press. [DOI] [PubMed] [Google Scholar]
- Cusick CG, Gould HJ III, and Kaas JH (1984) Interhemispheric connections of visual cortex of owl monkeys (Aotus trivirgatus), marmosets (Callithrix jacchus), and galagos (Galago crassicaudatus). J. Comp. Neurol 230:311–336. [DOI] [PubMed] [Google Scholar]
- Desimone R, and Gross CG (1979) Visual areas in the temporal cortex of the macaque. Brain Res. 178:363–380. [DOI] [PubMed] [Google Scholar]
- Desimone R, Fleming J, and Gross CG (1980) Prestriate afferents to inferior temporal cortex: An HRP study. Brain Res. 184:41–55. [DOI] [PubMed] [Google Scholar]
- DeYoe EA, and Van Essen DC (1985) Segregation of efferent connections and receptive field properties in visual area V2 of the macaque. Nature 317:58–61. [DOI] [PubMed] [Google Scholar]
- Dow BM (1974) Functional classes of cells and their laminar distribution in monkey visual cortex. J. Neurophysiol 37:927–946. [DOI] [PubMed] [Google Scholar]
- Dubner R, and Zeki SM (1971) Response properties and receptive fields of cells in an anatomically defined region of the superior temporal sulcus of the monkey. Brain Res. 35:528–532. [DOI] [PubMed] [Google Scholar]
- Fenstemaker SB, Albright TD, and Gross CG (1985) Organization and neuronal properties of visual area TEO. Soc. Neurosci. Abstr 11:1012. [Google Scholar]
- Gattass R, and Gross CG (1981) Visual topography of striate projection zone (MT) in posterior superior temporal sulcus of the macaque. J. Neurophysiol 46:621–638. [DOI] [PubMed] [Google Scholar]
- Gattass R, Sousa APB, and Covey E (1985) Cortical visual areas of the macaque: Possible substrates for pattern recognition mechanisms. In: Chagas C, Gattass R, and Gross C (eds): Pattern Recognition Mechanisms. Vatican City: Pontifical Academy of Sciences, pp. 1–20. [Google Scholar]
- Hubel DH, and Wiesel TN (1974) Uniformity of monkey striate cortex: A parallel relationship between field size, scatter, and magnification factor. J. Comp. Neurol 158:295–306. [DOI] [PubMed] [Google Scholar]
- Iwai E, and Mishkin M (1969) Further evidence on the locus of the visual area in the temporal lobe of the monkey. Exp. Neurol 25:585–594. [DOI] [PubMed] [Google Scholar]
- Kaas JH (1978) The organization of visual cortex in primates. In Noback CR (ed): Sensory Systems of Primates. New York: Plenum, pp, 151–179. [Google Scholar]
- Kaas JH, and Lin C-S (1977) Cortical projections of area 18 in owl monkeys. Vis. Res 17:739–741. [DOI] [PubMed] [Google Scholar]
- Livingstone MS, and Hubel DH (1984) Anatomy and physiology of a color system in the primate visual cortex. J. Neurosci 4:309–356. [DOI] [PMC free article] [PubMed] [Google Scholar]
- Lund JS, Lund RD, Hendrickson AE, Bunt AH, and Fuchs AF (1975) The origin of efferent pathways from the primary visual cortex, area 17, of the macaque monkey as shown by retrograde transport of horseradish peroxidase. J. Comp. Neurol 164:287–304. [DOI] [PubMed] [Google Scholar]
- Maguire WM, and Baizer JS (1984) Visuotopic organization of the prelunate gyrus in rhesus monkey. J. Neurosci 4:1690–1704. [DOI] [PMC free article] [PubMed] [Google Scholar]
- Maunsell JHR, and Van Essen DC (1983a) The connections of the middle temporal visual area (MT) and their relationship to a cortical hierarchy in the macaque monkey. J. Neurosci 3:2563–2586. [DOI] [PMC free article] [PubMed] [Google Scholar]
- Maunsell and Van Essen DC (1983b) Functional properties of neurons in middle temporal visual area of the macaque monkey. I. Selectivity for stimulus direction, speed, and orientation. J. Neurophysiol 49:1127–1147. [DOI] [PubMed] [Google Scholar]
- Montero VM (1980) Patterns of connections from the striate cortex to cortical visual areas in superior temporal sulcus of macaque and middle temporal gyrus of owl monkey. J. Comp. Neurol 189:45–59. [DOI] [PubMed] [Google Scholar]
- Motter BC, and Mountcastle VB (1981) The functional properties of the light-sensitive neurons of the posterior parietal cortex studied in waking monkeys: Foveal sparing and opponent vector organization. J. Neurosci 1:3–26. [DOI] [PMC free article] [PubMed] [Google Scholar]
- Movshon JA, Adelson EH, Gizzi MS, and Newsome WT (1985) The analysis of moving visual patterns. In: Chagas C, Gattass R, and Gross C, (eds): Pattern Recognition Mechanisms. Vatican City: Pontifical Academy of Sciences, pp. 117–151. [Google Scholar]
- Newsome WT, and Allman JM (1980) Interhemispheric connections of visual cortex in the owl monkey, Aotus trivirgatus, and the bushbaby, Galago senegalensis. J. Comp. Neurol 194:209–223. [DOI] [PubMed] [Google Scholar]
- Newsome WT, and Wurtz RH (1982) Identification of architectonic zones containing visual tracking cells in the superior temporal sulcus (STS) of macaque monkeys. Invest. Ophthal. Vis. Sci. Suppl 22:238. [Google Scholar]
- Saito H, Tanaka K, Fukada Y, Yukie M, Hikosaka K, and Iwai E (1984) Integration of direction cues of stimulus motion in macaque STS cortex. Soc. Neurosci. Abstr 10:475. [DOI] [PMC free article] [PubMed] [Google Scholar]
- Sakata H, Shibutani H, and Kawano K (1983) Functional properties of visual tracking neurons in posterior parietal association cortex of the monkey. J. Neurophysiol 49:1364–1380. [DOI] [PubMed] [Google Scholar]
- Shipp S, and Zeki S (1985) Segregation of pathways leading from area V2 to areas V4 and V5 of macaque monkey visual cortex. Nature 315:322–325. [DOI] [PubMed] [Google Scholar]
- Tootell RBH, Silverman MS, De Valois RL, and Jacobs GH (1983) Functional organization of the second cortical visual area in primates. Science 220:737–739. [DOI] [PubMed] [Google Scholar]
- Tusa RJ, Palmer LA, and Rosenquist AC (1981) Multiple cortical visual areas: Visual field topography in the cat. In Woolsey CN (ed): Cortical Sensory Organization, Vol. 2, Multiple Visual Areas. Clifton, New Jersey: Humana Press, pp. 1–31. [Google Scholar]
- Ungerleider LG (1985) The corticocortical pathways for object recognition and spatial perception. In Chagas C, Gattass R, and Gross C, (eds): Pattern Recognition Mechanisms. Vatican City: Pontifical Academy of Sciences, pp. 21–37. [Google Scholar]
- Ungerleider LG, and Mishkin M (1979) The striate projection zone in the superior temporal sulcus of Macaca mulatta: Location and topographic organization. J. Comp. Neurol 188:347–366. [DOI] [PubMed] [Google Scholar]
- Ungerleider LG, and Desimone R (1986a) Projections to the superior temporal sulcus from the central and peripheral field representations of V1 and V2. J. Comp. Neurol 248:147–163. [DOI] [PubMed] [Google Scholar]
- Ungerleider LG, and Desimone R (1986b) Cortical connections of visual area MT in the macaque. J. Comp. Neurol 248:190–222. [DOI] [PubMed] [Google Scholar]
- Ungerleider LG, Desimone R, and Mishkin M (1982) Cortical projections of area MT in the macaque. Soc. Neurosci. Abstr 8:680. [Google Scholar]
- Ungerleider LG, Gattass R, Sousa APB, and Mishkin M (1983) Projections of area V2 in the macaque. Soc. Neurosci. Abstr 9:152. [Google Scholar]
- Ungerleider LG, Desimone R, Galkin TW, and Mishkin M (1984) Subcortical projections of area MT in the macaque. J. Comp. Neurol 223:368–386. [DOI] [PubMed] [Google Scholar]
- Van Essen DC, Maunsell JHR, and Bixby JL (1981) The middle temporal visual area in the macaque: Myeloarchitecture, connections, functional properties and topographic organization. J. Comp. Neurol 199:293–326. [DOI] [PubMed] [Google Scholar]
- Van Essen DC, and Zeki SM (1978) The topographic organization of rhesus monkey prestriate cortex. J. Physiol. (Lond.) 277:193–226. [DOI] [PMC free article] [PubMed] [Google Scholar]
- Weller RE, and Kaas JH (1983) Retinotopic patterns of connections of area 17 with visual areas V-II and MT in macaque monkeys. J. Comp. Neurol 220:253–279. [DOI] [PubMed] [Google Scholar]
- Weller RE, and Kaas JH (1985) Cortical projections of the dorsolateral visual area in owl monkeys: The prestriate relay to inferior temporal cortex. J. Comp. Neurol 234:35–59. [DOI] [PubMed] [Google Scholar]
- Weller RE, Wall JT, and Kaas JH (1984) Cortical connections of the middle temporal visual area (MT) and the superior temporal cortex in owl monkeys. J. Comp. Neurol 228:81–104. [DOI] [PubMed] [Google Scholar]
- Zeki SM (1969) Representation of central visual fields in prestriate cortex of monkey. Brain Res. 14:271–291. [DOI] [PubMed] [Google Scholar]
- Zeki SM (1971) Convergent input from the striate cortex (area 17) to the cortex of the superior temporal sulcus in the rhesus monkey. Brain Res. 28:338–340. [DOI] [PubMed] [Google Scholar]
- Zeki SM (1974) Functional organization of a visual area in the posterior bank of the superior temporal sulcus of the rhesus monkey. J. Physiol. (Lond.) 236:549–573. [DOI] [PMC free article] [PubMed] [Google Scholar]
- Zeki SM (1976) The projections to the superior temporal sulcus from areas 17 and 18 in the rhesus monkey. Proc. R. Soc. Lond. [Biol.] 193:199–207. [DOI] [PubMed] [Google Scholar]
- Zeki SM (1977) Colour coding in the superior temporal sulcus of rhesus monkey visual cortex. Proc. R. Soc. Lond. [Biol.] 197:195–223. [DOI] [PubMed] [Google Scholar]
- Zeki SM (1978) Functional specialisation in the visual cortex of the rhesus monkey. Nature 274:423–428. [DOI] [PubMed] [Google Scholar]