

Abstract
The synthesis and characterization of a series of donor-π-acceptor-π-donor (D-A-D) curcuminoid molecules is presented herein that incorporates π-extended aryl and electron-donating amino terminal functionalization. Computational evaluation shows these molecules possess quadrupolar character with the lowest energy transitions displaying high molar extinction coefficients with broad tunability through manipulation of terminal donating groups. Consistent with their quadrupolar nature, these molecules show varying degrees of solvatochromic behavior in both their absorption and emission spectra, which has been analyzed by Lippert–Mataga and Kamlet–Taft analysis. Photophysical and photoacoustic (PA) properties of these molecules have been investigated by the optical photoacoustic z-scan (OPAZ) method. Selected curcuminoid molecules display nonlinear behavior at a high laser fluence through excited state absorption that translates to the production of an enhanced photoacoustic emission. A relative comparison of “molar PA emission” is also presented with the crystal violet linear optical absorbing/linear PA emitting system being utilized as a standard reference material for OPAZ experiments. Furthermore, PA tomography experiments are presented to illustrate the enhanced PA contrast obtainable via an excited state absorption.
Keywords: contrast agents, curcumin, fluorescence, imaging, photoacoustic
Introduction
Curcumin is a naturally occurring dye found in the turmeric root (curcuma longa) which has been used for centuries as a spice and herbal remedy due to its antioxidant, anti-inflammatory, and anti-tumor properties.[1] In addition to its medicinal applications, the characteristic photophysical properties of the curcumin molecule have made it an attractive protagonist for a range of optical and medical applications such as nonlinear refraction,[2] dye-sensitized solar cells,[3] two-photon absorption imaging,[4] two-photon fluorescence,[5] photothermal therapy,[6] anti-cancer agent,[7] two-photon fluorescence imaging and photodynamic therapy.[8] Our interest in studying the curcuminoid class of dyes is motivated by the emerging techniques of photoacoustic (PA) imaging[9] and microscopy.[10] The PA effect, first demonstrated by Alexander Graham Bell in 1880, is manifest by the photoinduced propagation of an acoustic wave upon the thermoelastic expansion of the absorbing material in its surrounding medium.[11] A major advantage of PA imaging over alternative imaging modalities is its capability of providing high contrast images at enhanced penetration depths in living tissue (≈5 cm). Thus, PA (light-in/acoustic-out) imaging provides the best of both worlds; the high contrast of fluorescence (light-in/light-out) imaging with the depth penetration of ultrasound (acoustic-in/acoustic-out) imaging.[12] The prospective for high contrast deep tissue imaging has inspired us to research the effective production of a PA signal by molecular photoacoustic contrast agents (MPACs). Small molecules are an attractive option as contrast agents as they offer near-infrared (NIR) tunable absorption properties and desirable size relative to currently used nanomaterials.[13] Large nanomaterials (100–200 nm) are required for in vivo imaging and leveraging the enhanced permeability and retention (EPR) effect.[14] But large nanomaterials have undesirable pharmacokinetics as they cannot be cleared by the kidneys because the physiological pore size of the glomerular capillary wall in the kidney has a cutoff of 5 nm.[15] Instead, they are taken by the mononuclear phagocyte system and induce tissue toxicity in the liver and spleen.[16] On the other hand, small molecule dyes have good tissue penetration, biodistribution, fast clearance and low toxicity.[17] Molecular requirements for the production of a photoacoustic signal are the strong absorption of light as quantified by the molar extinction coefficient () and efficient excited state dissipation of energy through non-radiative pathways. Recently it has been shown that MPACs displaying nonlinear absorption are capable of producing amplified photoacoustic signals relative to their linear absorbing counterparts.[18] Quadrupolar dyes have been shown to have large optical cross sections and the potential for reverse saturable absorption, two important characteristics in developing MPACs. With this in mind, a series of dyes, inspired by the naturally occurring curcumin chromophore, have been synthesized through the incorporation of π-extended aryl and tertiary arylamine electron donating substituents at the terminal position of the β-diketonate borondifluoride backbone (Figure 1).
Figure 1.
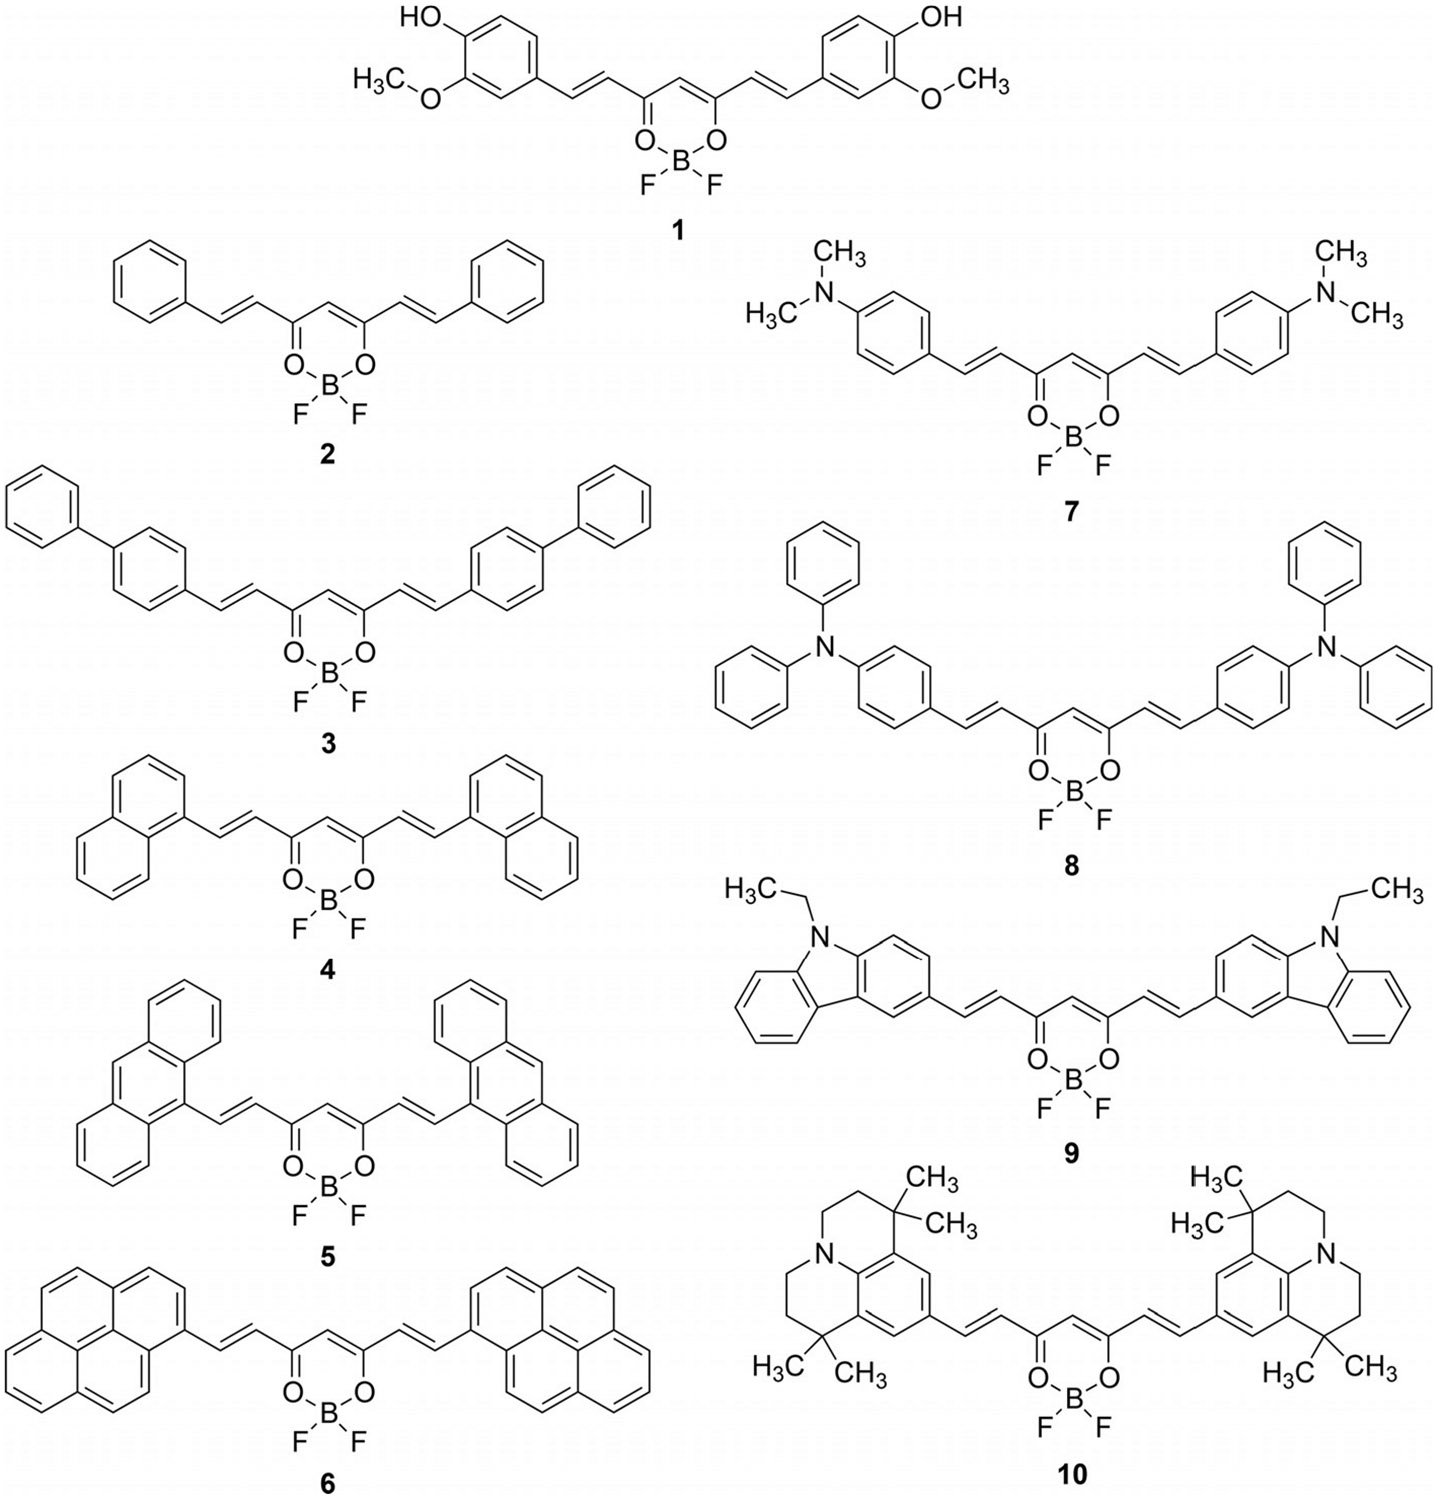
Structures of π-extended (2–6) and electron donating (7–10) series of curcuminoid molecules as well as the reference curcuminBF2 (1) molecule.
Results and Discussion
Synthesis and characterization
Two series of quadrupolar donor-π-acceptor-π-donor difluoroboron curcuminoid dyes have been synthesized in order to establish a structure-property relationship with respect to both their photophysical and photoacoustic properties. Extended aryl π-conjugated and tertiary amine-donating substituents have been introduced at the terminal positions of the difluoroborn β-diketonate backbone following a previously established synthetic protocol.[19] Briefly, the intermediate acetylacetone borondifluoride intermediate was first isolated in bulk (≈ 1 g) from acetylacetone and boron trifluoride diethyl etherate. Selected aldehydes were then coupled at the terminal methyl positions of the acetylacetone boron difluoride intermediate through a modified Knoevenagel condensation reaction in refluxing toluene to yield compounds 1–10 (Figure 1). In all cases crude product precipitated from the reaction mixture upon cooling to room temperature. Analytically pure solids were subsequently obtained in respectable yield upon recrystallization from dichloromethane and hexane. The structure and purity of all compounds was verified by 1H and 13C NMR (when possible due to solubility) spectroscopies as well as MALDI-TOF high resolution mass spectroscopy. Single crystals suitable for X-ray diffractometry were isolated in the case of the bis-anthracenyl curcuminBF2 compound 5 (Figure 2).
Figure 2.
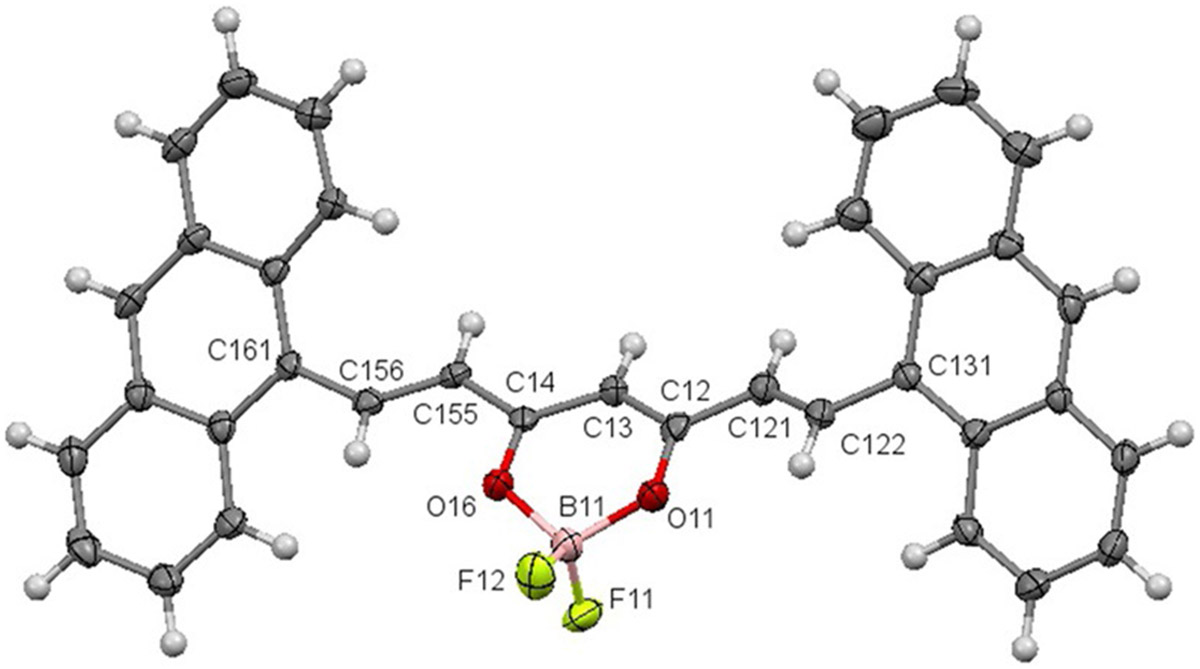
X-ray crystallographic ortep diagram of 5·CHCl3. The solvated CHCl3 structure has been removed for clarity.
Crystal structure analysis has previously been reported for the free acid and copper bound bis-anthracenyl curcuminoid analogues allowing for comparison.[20] The O-B-O bond angle for 5 of 110.4(4)° is significantly larger than that of the Cu compound (93.25°) consistent with the smaller atomic radius of the coordinating boron. The terminal anthracenyl groups in 5 are twisted out of plane of the central ring in a symmetric manner by 35.5(1)° and 33.9(1)°, making the π-system of 5 more planar and delocalized with respect to the copper complex (dihedral = 45.84°). The B(11)─O(11) bond length is 1.481(5) Å and B(11)─O(16) is 1.492(6) Å, representing a decrease relative to the reported copper complex and is attributed to the increased electronegativity of the boron difluoride moiety.
Electronic absorption properties and TDDFT calculations
The predominate form of naturally occurring curcumin, (1E,6E)-1,7-bis(4-hydroxy-3-methoxyphenyl)-1,6-heptadiene-3,5-dione, is a β-diketone that exists in both its keto and enol tautomeric forms in solution. Coordination of the BF2 moiety with the deprotonated diketonate anion provides conformational stability as well as an electron-withdrawing effect. This results in a bathochromic shift of its absorption maximum from 420 to 495 nm and a two-fold increase in its molar extinction coefficient () from 4.28×10⁴ to 8.85×10⁴m−1cm−1 in toluene, for the free acid curcumin and curcuminBF2 derivative, respectively (Supporting Information Figure S1).[8b] The UV/Vis electronic absorption spectra recorded in toluene (dielectric constant = 2.38) at room temperature are presented relative to the naturally derived curcuminBF2 (1) reference molecule in Figure 3 for the aryl π-extended (2–6) and amino electron-donating (7–10) series. Incorporation of aryl substituents of increasing conjugation results in a bathochromic shift (phenyl<biphenyl<naphthalenyl<anthraceny≅pyrenyl) ranging from 449 nm for 2 to 574 nm for 6. This is consistent with a destabilization of the HOMO level combined with a slight stabilization of the LUMO level due to the expansion of the contributing π and π* orbitals, respectively, as confirmed by voltammetry and computational analysis (vide infra). Molar extinction coefficients are consistent across the aryl series 2–6 relative to 1 with the bisbiphenyl curcuminBF2 dye 3 displaying the strongest light absorption of this series with at 450 nm. The bis-anthracenyl curcuminBF2 dye 5 exhibits the most red-shifted absorption maximum of the aryl series with a λmax of 577 nm and a molar extinction coefficient of 7.94×10⁴m−1cm−1.
Figure 3.
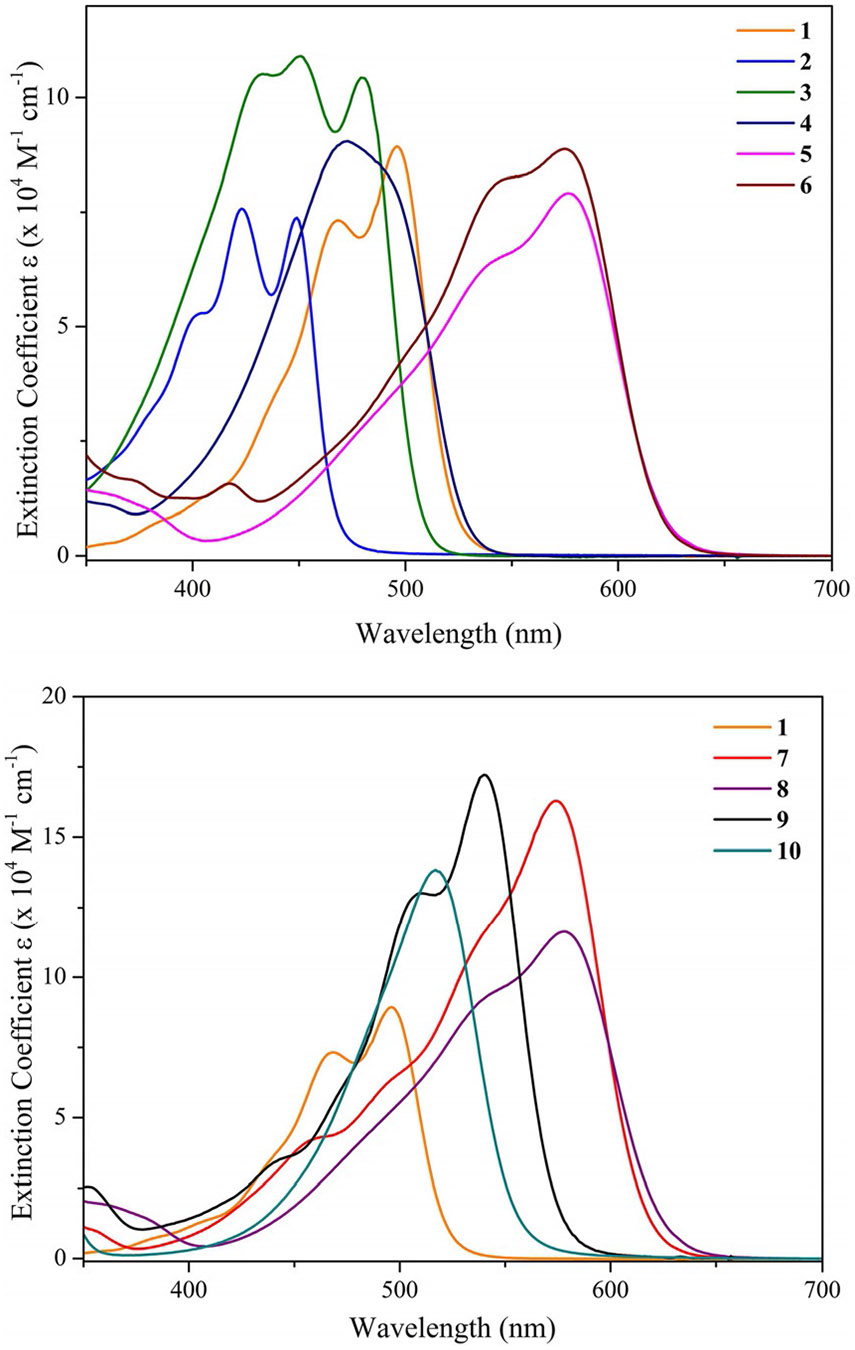
UV/Vis absorption spectra for 1–6 (top) and 1, 7–10 (bottom) plotted as wavelength versus molar extinction coefficient. Note the larger y-axis scale for the amino curcumin series of dyes.
Also of note is that the increase in conjugation associated with progression from the anthracenyl (5) to pyrenyl (6, λmax= 574 nm) substituents does not result in a significant spectral shift, however, it does provide for an increased light harvesting capacity with 6 exhibiting a molar extinction coefficient of 8.91×10⁴m−1. Introduction of electron-donating tertiary amine substituents at the terminal ends of the π-conjugated bis-vinyl acacBF2 backbone in compounds 6–10 results in a strong bathochromic shift of the absorption maxima relative to 1. This is consistent with a significant destabilization of the HOMO level due to the strong donating influence of the tertiary amine substituents (relative to the more electronegative O-donors of 1), again confirmed by voltammetry and computational analysis (vide infra). Most impressive is how increasing electron donor strength also results in a significant increase in the lowest energy absorption band molar extinction coefficient. For example, relative to the basic curcuminoid structure of 2, bearing simple phenyl substituents with a maximum of 7.38×10⁴m−1cm−1 at 449 nm, the bis-p-dimethylaminophenyl cucuminoid 7 displays an of 1.63×10⁵m−1cm−1 at 572 nm and the bis-carbazole curcuminoid 9 displays an of 1.73×10⁵m−1cm−1 at 540 nm, all recorded in toluene (Figure 3). Compound 8 with terminal triphenylamine electron donating groups exhibits the most redshifted absorption maximum at 578 nm albeit with a slight reduction in at 1.17×10⁵m−1cm−1 relative to 7 and 9.
To better understand the origin of electronic transitions in their UV/Vis electronic absorption spectra single-point energy time-dependent density functional theory (TDDFT) calculations were carried out following prior DFT optimization and frequency analysis of all compounds 1–10 (Figure 4). A full collection of TDDFT spectra is provided in the supporting information (Figures S3-S12). Suffice to say the π-extended aryl series 2–6 show satisfactory quantitative agreement with their experimental UV/Vis spectra by TDDFT using the B3LYP/6–311 g(d,p) functional/basis-set combination. However, the electron-rich compounds 1 and the tertiary amine electron-donating series 7–10 only exhibited satisfactory agreement with experiment when using the CAM-B3LYP/6–311 g(d,p) functional/basis set combination with the added cis(d) keyword to incorporate configurational interaction of ground and excited electronic states in the TDDFT calculation. This is most likely due to the greater extent of charge-transfer character involved in their lowest energy π−π* transition due to contribution from the N-donor lone pair electrons. Regardless of the quantitative agreement between experiment and theory however, all levels of theory employed were consistent with the qualitative nature of the electronic transitions observed. The lowest energy absorption band for all curcuminoids (1–10) is consistently assigned to a single S0→S1 electronic transition of high oscillator strength (f) primarily derived from a HOMO→LUMO electronic transition. For the aryl series 2–6 DFT geometry optimization and frequency analysis (B3LYP/6-311g(d,p)/toluene PCM) show a consistently planar, that is, complete π-conjugation, configuration in all ground state optimized structures for 2, 4 and 6. Compounds 3 and 5 are exceptions due to the steric constraints of their terminal aryl substituents. In 3, the terminal phenyl rings of the biphenyl substituents are predicted to rotate out of plane from the planar phenylcurcuminBF2 core unit with a dihedral angle of 35.5°, while in 5 the bulky anthracenyl substituents are predicted to rotate out of plane by 38.2° and 38.9° from the bis-vinyl acacBF2 core. The predicted non-planar DFT optimized ground state configuration of 5 is consistent within 5° of the experimentally determined value from crystal structure analysis (Figure 2), in which both terminal anthracenyl groups are out of plane with dihedral angles of 35.51° and 33.86°. The non-planar configuration of 5 results in a reduction of symmetry relative to other molecules in the series, which is reflected in the decreased and calculated oscillator strength for 5 (f = 0.80) versus 6 (f = 1.82). Optimized ground state calculations for compounds bearing the amino substituents (7–10) show consistently planar configurations extending to the tertiary amine. Having two terminal, electron donating, tertiary amine substituents in their conjugated π-systems, the theoretical HOMO energies of 7–10 are destabilized relative to 1 due to the lower electronegativity of the N versus O donor atoms. In contrast, the LUMO energies of dyes 7–10 are less influenced from the tertiary amine substituents. This is consistent with the observed redshift in their HOMO→LUMO transition-based absorption maxima and the quadrupolar nature of the lowest energy transition. The calculated electronic S0→S1 transition for all molecules 1–10 is assigned primarily to the HOMO→LUMO transition (97–100% contribution). A charge-transfer shift in electron density is exhibited for this electronic transition from delocalization across the entire π-backbone of the molecule in the HOMO to a more compacted π* orbital involving the bis-vinyl acacBF2 in the LUMO with only partial contribution from the terminal substituents; hence their quadrupolar donor-π-acceptor-π-donor description. It is also noteworthy that this electronic transition shows the presence of a nodal plane in the LUMO level across the vinyl arms of the molecule that would allow for a twisted intramolecular charge-transfer (TICT) excited-state configuration.
Figure 4.
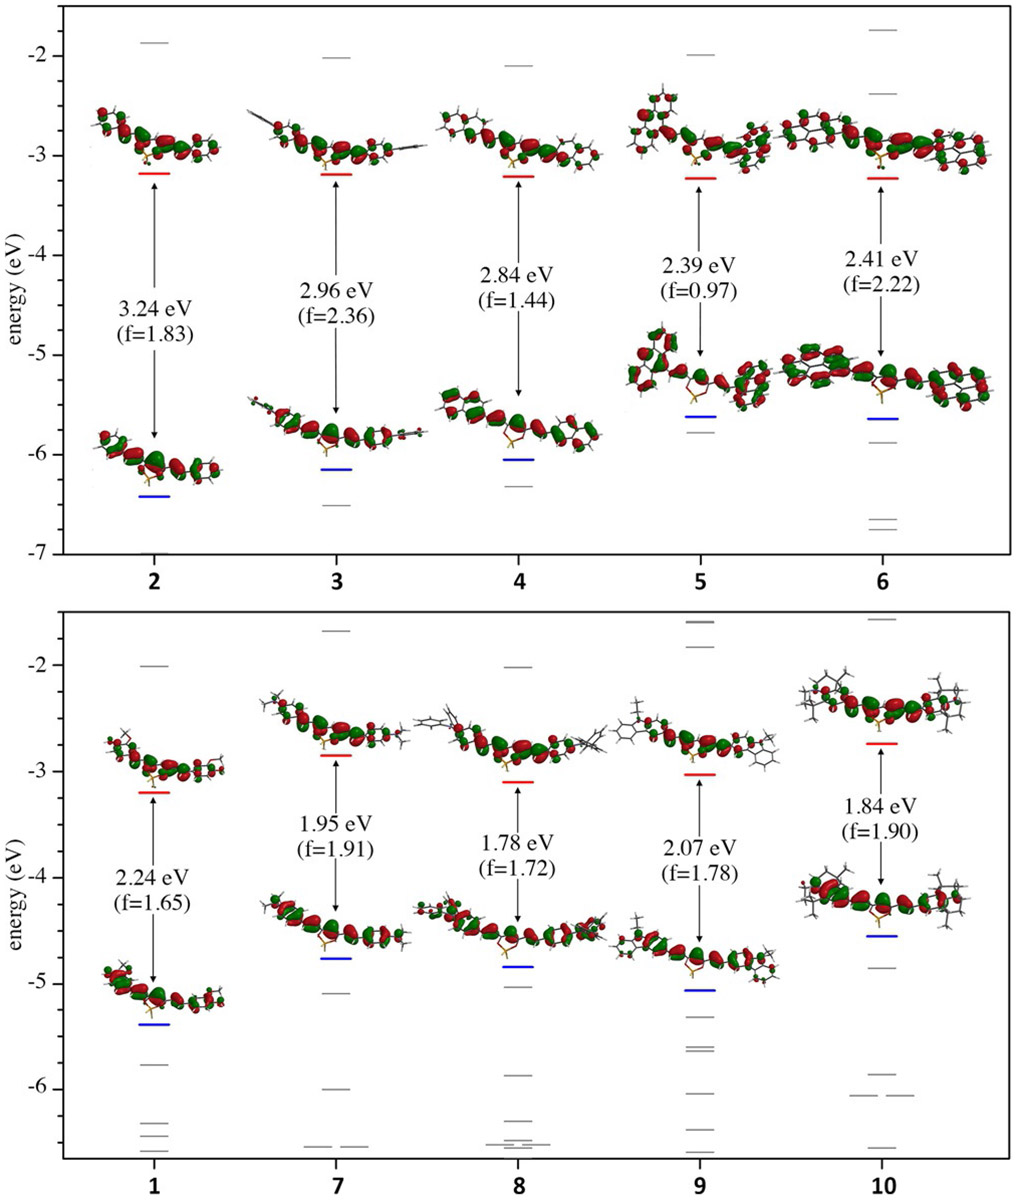
Frontier molecular orbital energy levels (eV), HOMO–LUMO surfaces (isofactor = 0.04), and oscillator strengths () as calculated by DFT and TDDFT analysis. Electron occupancy is removed for clarity so HOMO and LUMO levels are highlighted in blue and red, respectively. DFT and TDDFT analysis of the aryl series 2–6 (top) was performed with the B3LYP/6-311g(d,p)/toluene PCM functional/basis set/solvent model. DFT analysis of 1 and the tertiary amine series 7–10 (bottom) was performed with the CAM-B3LYP/6-311g(d,p)/toluene PCM functional/basis set/solvent model with the configurational interaction keyword cis(d) added for TDDFT analyses.
Electrochemical properties
The electrochemical properties of compounds 1–10 were determined via cyclic and square wave voltammetry in 0.1m Bu4NPF6 acetonitrile electrolyte using a glassy carbon working electrode and are reported versus the ferricenium/ferrocene (Fc+/0) pseudo reference potential (Figure 5).
Figure 5.
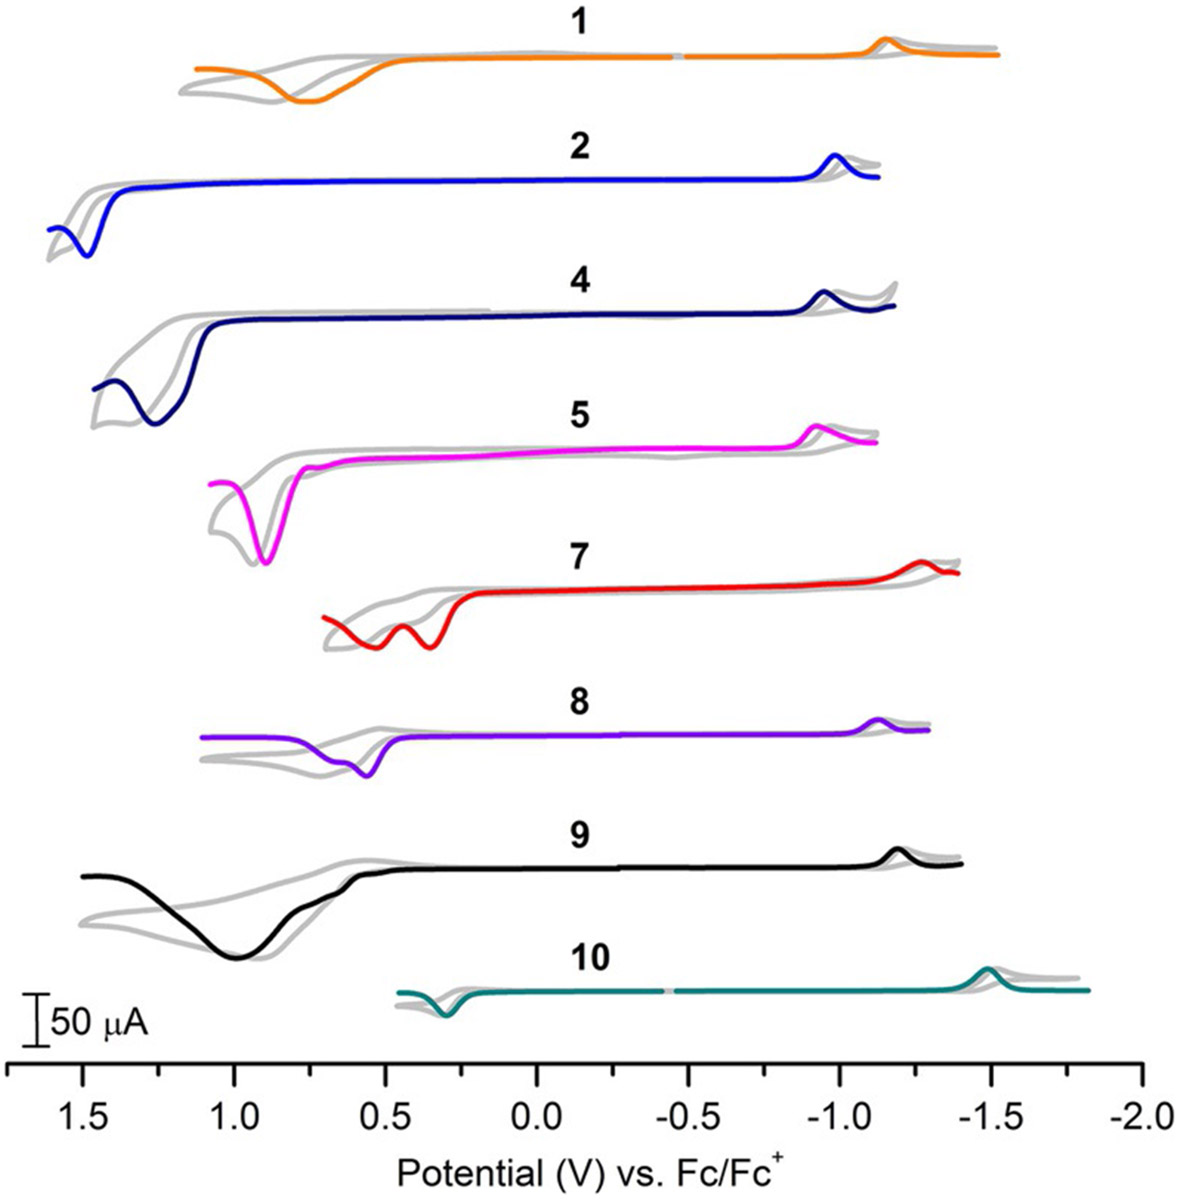
An overlay of square wave voltammetry and cyclic voltammetry (greyscale) for a selection of borondifluoride curcuminoid dyes. Experimental conditions: 0.1 m Bu4NPF6 acetonitrile electrolyte, 3 mm diameter glassy carbon working electrode, Pt wire counter electrode.
For the aryl series, 2–6, deviations in their electrochemical properties are most evident in their oxidation potentials which is consistent with significant electron density of their HOMO levels located at the terminal aromatic substituents. With the terminal substituents in 2–6 being planar aromatic hydrocarbon ring systems all oxidation potentials are irreversible and relatively positive (from +1.2 to + 1.5 V vs. Fc+/0) with the exception of the bis-anthracenyl system 5, possibly due to steric induced distortion from planarity as discussed above. Consistent with DFT predictions little change is observed between LUMO reduction potentials centered at the core of the molecule. The tertiary amine series show significant shifts at both their HOMO oxidation and LUMO reduction potentials. This is indicative that the electron donating strength of the substituent is not only destabilizing the HOMO level but influencing the LUMO level, albeit to a lesser degree. Consistent with DFT predicted electron donating strengths, both 7 and 10 show the most cathodic HOMO oxidation potentials at +0.38 and +0.28 V vs. Fc+/0, respectively. Accordingly, 7 and 10 also show the most cathodic LUMO reduction potentials at −1.27 and −1.49 V vs. Fc+/0, respectively. However with destabilization of the HOMO level being dominant they each show narrow electrochemical bandgaps (Ebg) of 1.65 and 1.77 V, respectively. HOMO–LUMO bandgaps have been determined experimentally through electrochemical (Ebg) and optical (E0–0) investigations as well as theoretically through DFT calculations (EDFT) for comparison. Ebg and E0–0 are expected to be correlated in characterizing the HOMO–LUMO energy gap, however the differing electronic states and molecular environmental factors (e.g. coulombic charge and electrolyte) between the two techniques preclude exact agreement. The tabulated electrochemical data is shown in Table 1 including spectroscopically and computationally determined bandgaps for comparison. All three methods show good agreement in trend with an exception being the electrochemically determined value for 6. The pyrenyl substituent of 6 is known to undergo π-stacking aggregation at elevated concentration which is likely to have an influence on its observed electrochemical potentials recorded at an electrode surface relative to dilute optical solution.[21]
Table 1.
Electrochemical potentials for compounds 1–10 reported vs. the ferricenium/ferrocene redox in 0.1 m Bu4NPF6 acetonitrile electrolyte. Spectroscopic and computational bandgaps are included for comparison.
| Eox [V] | Ered [V] | Ebg [eV][b] | E0-0 [eV][c] | EDFT [eV][d] | |
|---|---|---|---|---|---|
| 1 | 0.76[a] | −1.15[a] | 1.91 | 2.44 | 2.24 |
| 2 | 1.49[a] | −0.98[a] | 2.47 | 2.73 | 3.24 |
| 3 | 1.45[a] | −1.03[a] | 2.48 | 2.52 | 2.96 |
| 4 | 1.26[a] | −0.95[a] | 2.21 | 2.42 | 2.84 |
| 5 | 0.89[a] | −0.92[a] | 1.81 | 2.07 | 2.39 |
| 6 | 1.40[a] | −1.19[a] | 2.59 | 2.07 | 2.41 |
| 7 | 0.38[a] | −1.27[a] | 1.65 | 2.09 | 1.94 |
| 8 | 0.56 | −1.13[a] | 1.69 | 2.06 | 1.78 |
| 9 | 0.66 | −1.19[a] | 1.85 | 2.24 | 2.07 |
| 10 | 0.28[a] | −1.49[a] | 1.77 | 2.31 | 1.84 |
Irreversible.
Electrochemical bandgap.
Optical bandgap determined in room temperature toluene.
Theoretical bandgap
Fluorescence emission properties
All curcuminoids 1–10 are strongly emissive in toluene with radiative S1→S0 fluorescence quantum yields (Φfl) ranging from 0.23 for 6 to 0.77 for 7. Fluorescence lifetimes and quantum yields were insensitive to dissolved oxygen confirming the spin-allowed S1→S0 transition multiplicity. Similar to observed trends in their ground state S0→S1 electronic absorption properties, a bathochromic shift in singlet emission maxima (λem) is observed with increased conjugation and donating capacity of the terminal substituents. Deviation from this trend is observed for 5, in which the emission is more redshifted and with less defined vibrational structure (FWHM = 1979 cm−1) in comparison to 6 (FWHM = 2368 cm−1). This observation can possibly be attributed to a descent in symmetry in the structure of 5 vs. 6 due to the steric bulk of the terminal anthracenyl groups as confirmed by X-ray analysis. Emission spectra of the amine series (7–10) exhibit narrower FWHM and exhibit maxima over a narrower range than the aryl substituted series. A collection of all emission spectra recorded in toluene is provided in Figure 6. Time-resolved fluorescence measurements in toluene show singlet emission lifetimes (1τ) ranging between 0.93–2.00 ns across both series of compounds. Interestingly compounds 7 and 9 both bearing tertiary amine substituents show enhanced fluorescence quantum yields of 0.77 and 0.76 relative to the remaining series, which is attributed to enhanced radiative rate constants () for both compounds at 5.80×10⁸ and 4.49×10⁸s−1, respectively. On the other hand, the aryl series exhibit a lower range of fluorescence quantum yields with a minimum of 0.23 exhibited by 6 attributed to its large nonradiative rate constant () of 7.54×10⁸s−1 (Table 2).
Figure 6.
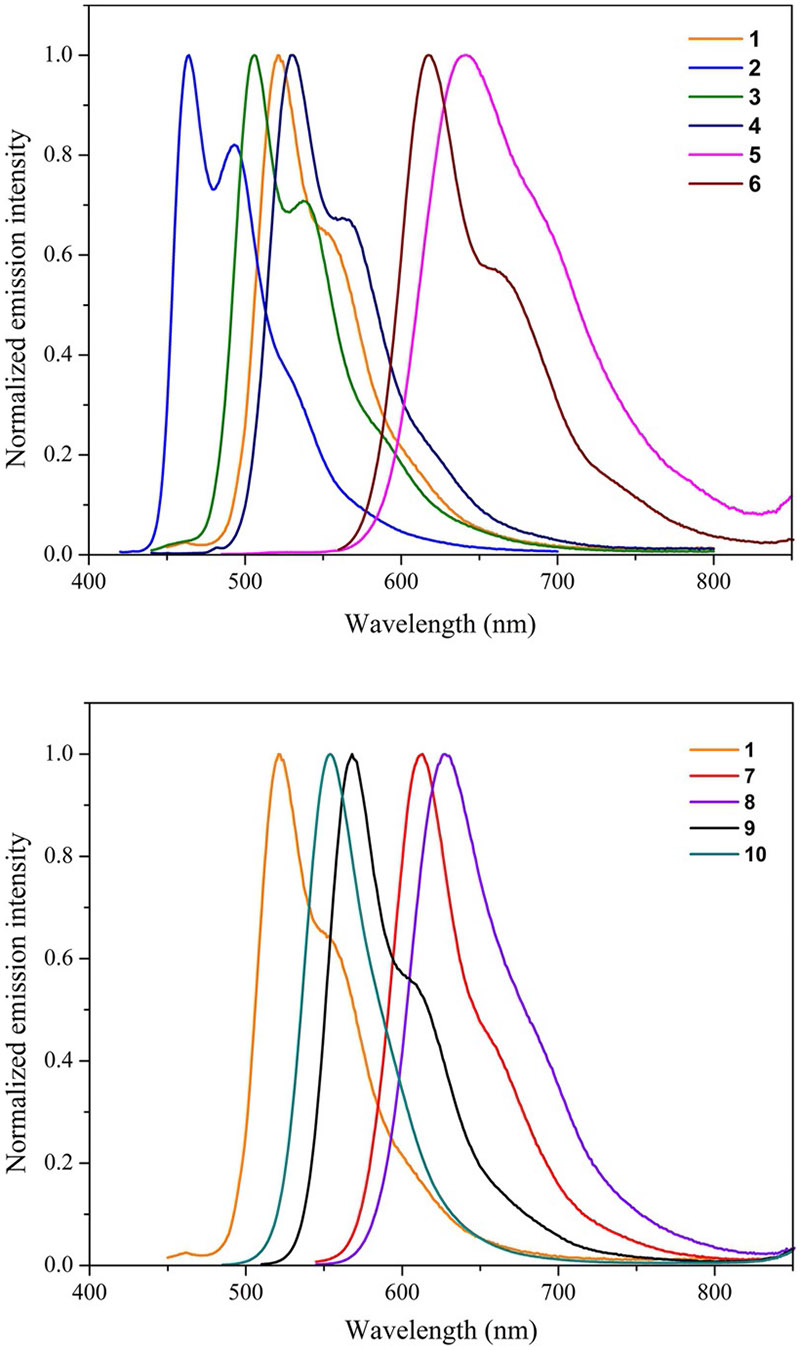
Fluorescence emission spectra of 1–6 (top) and 1, 7–10 (bottom) recorded in toluene at room temperature.
Table 2.
UV/Vis absorption and emission data recorded in toluene including fluorescence lifetimes, radiative and non-radiative rate constants.
| Stokes shift [cm−1] | L-M slope[a] (R2) | ||||||||
|---|---|---|---|---|---|---|---|---|---|
| 1 | 495 | 8.85 | 522 | 0.42 | 1.36 | 3.07 | 4.29 | 1077 | 7538 (0.7865) |
| 2 | 449 | 7.38 | 465 | 0.29 | 1.15 | 2.50 | 6.21 | 720 | 1762 (0.9997) |
| 3 | 480 | 10.48 | 506 | 0.32 | 0.93 | 3.45 | 7.28 | 1109 | 6974 (0.3417) |
| 4 | 479 | 8.13 | 532 | 0.53 | 1.69 | 3.12 | 2.79 | 1576 | 6236 (0.9421) |
| 5 | 577 | 7.94 | 644 | 0.28 | 1.82 | 1.56 | 3.95 | 2353 | 11295 (0.9775) |
| 6 | 574 | 8.91 | 616 | 0.23 | 1.03 | 2.22 | 7.54 | 1214 | 5,451 (0.8156) |
| 7 | 572 | 16.30 | 612 | 0.77 | 1.32 | 5.80 | 1.75 | 1188 | 4909 (0.9946) |
| 8 | 578 | 11.71 | 628 | 0.49 | 1.73 | 2.85 | 2.92 | 1377 | 9646 (0.9960) |
| 9 | 540 | 17.30 | 570 | 0.76 | 1.69 | 4.49 | 1.43 | 944 | 6394 (0.9889) |
| 10 | 517 | 13.95 | 555 | 0.33 | 2.00 | 1.63 | 3.36 | 1292 | 3344 (0.9905) |
The Lippert–Mataga slope (L–M slope) and R2 were calculated via linear fit regression of experimentally obtained Stokes shifts in toluene, dichloromethane, and acetonitrile.
Solvatochromic studies
A fully comprehensive study of the photophysical properties of 1–10 has been conducted in solvents of ranging dielectric constants (Table S1); toluene (= 2.38), dichloromethane (= 8.93), methanol (= 32.70), and acetonitrile (= 37.50). The twisted intramolecular charge-transfer (TICT) nature of the S0→S1 electronic transition makes these quadrupolar curcuminoid dyes particularly susceptible to solvatochromic effects. Increasing polarity of the solvent medium stabilizes the charge distribution in both the ground and excited states, however, a much larger influence is observed on the thermally equilibrated excited (thexi) states of 1–10 due to the rate of solvent reorganization (ps) relative to 1τ (ns). A significant decrease of Φfl is observed for all compounds in solvents of greater polarity with the exception being the bis-biphenyl compound 3, which exhibits a slight increase in Φfl from 0.32 to 0.37 on going from toluene to acetonitrile. For the majority of dyes, a bathochromic shift of emission spectra upon increasing solvent dielectric is accompanied by a significant reduction in Φfl associated with a large increase in the nonradiative rate constant (). This is most likely due to stabilization of a TICT excited state associated with molecular rotation at the nodal plane of the vinyl bond. Indeed preliminary molecular rotor studies on 1 have confirmed this hypothesis (Figure S2).
This excited state solvatochromism has been evaluated using the Lippert-Mataga equation which provides a framework for discerning the difference between ground and excited state dipole moments (μe−μg) from the Stokes shift dependence upon solvent polarizability.[22] Details of the Lippert–Mataga analysis is provided in the supplementary information. All Lippert–Mitaga slopes (Figure S13, Table 2) are positive consistent with a positive solvatochromism. The data shows a good linearity for most compounds (R2 > 0.8) except for 1 and 3; the former due to non-negligible solvent interactions (likely H-bonding) with the latter deviating most from linear behavior indicating a lesser susceptibility to different solvent polarities (Δf). Radiative () and non-radiative () rate constants for 1–10 (Table 2) are within one order of magnitude from each other throughout the series in varying polarity environments, consistent with previously reported values for difluorboron curcuminoid molecules.[23] Due to the stabilizing effect on charge distribution within the dye molecules, solvents with a large Δf allow greater access to nonradiative relaxation pathways and thus exhibit a decrease in Φfl as well as fluorescence lifetime (1τ). Indeed a reduction in Φfl is observed as a function of increasing polarizability (Table S1). Notably, recorded in acetonitrile (= 37.50) is predominantly larger than in toluene or dichloromethane as expected of a more stabilized emitting state consistent with the energy gap law.
Protic solvents such as methanol are best evaluated separate from non-protic solvents, as such the experimentally determined Δν in methanol has been plotted but has not been included in the linear fit calculation to derive the Lippert–Mataga slope. In fact, previous literature has reported on the degradation of borondifluoride-β-diketonate structures in protic solvents.[24] A similar degradation was here observed that prevented accurate quantitative analysis in methanol of , Φfl, or photoacoustic studies in this solvent. However, reliable qualitative spectra were easily obtained allowing λabs and λem to be accurately determined. Complimentary to Lippert–Mataga analysis, Kamlet–Taft analysis was also performed, allowing for a more in-depth evaluation of specific solute–solvent interactions. Details of the Kamlet–Taft analysis are provided in the Supporting Information. Briefly, it can be concluded that solvatochromic effects on emission are primarily impacted by solvent polarity and polarization (π*) and hydrogen bond acceptor basicity (β), although to varying degrees throughout the series (Table S2). Susceptibility to β is consistent with deviation from linear behavior observed for methanol (β = 0.66) in the Lippert–Mataga evaluation as well as a previously proposed degradation pathway.[24c]
Photoacoustic properties
A photoacoustic signal is produced through the conversion of light energy to sound energy by an absorbing material. The intensity of a generated PA signal can be described by Equation (1).
| (1) |
in which is the ground state molar extinction coefficient at the incident wavelength, is the ground state concentration of dye molecules, is the Grüneisen coefficient (a constant that quantifies a medium’s ability to conduct sound), is the incident photon fluence, Φnr is the quantum yield for non-radiative decay from the first excited state S1 (equivalent to 1−Φfl), is the first excited state molar extinction coefficient at the incident wavelength and is the concentration of excited state dye molecules.[18,25] Following Kasha’s rule, Φnr should equal to unity for any Sn excited state relaxation process where n > 1. Thus, Φnr is only relevant for S1 in the initial linear term of Equation (1). It is also important to note that the concentration of excited state dye molecules will vary with time. Thus the laser pulse width, relative to the lifetime of the excited state chromophore, is also an important consideration when optimizing a nonlinear PA amplification. For molecules undergoing only linear absorption processes, that is, single photon absorption, the first linear term of Equation (1) need only be considered. As such, for straight forward linear absorption, the PA emission varies linearly with the absorption cross-section of the sample (), Φnr and the photon flux (). For nonlinear absorption processes, for example, excited state absorption, the PA signal enhancement is generated by a quadratic dependence on .[26] There are three distinct types of PA emitters that can be categorized based upon the correlation between their optical absorption and PA emission characteristics as defined by Eq. (1): i) Linear absorber (LA)→linear PA emitter (). Rapidly propagating S0↔S1 absorption–relaxation occurs within a single laser pulse resulting in a linear dependence of the PA signal amplitude on laser fluence. An ultrashort excited state lifetime precludes nonlinear absorption. ii) Saturable absorber (SA)→weak PA emitter (, ). Saturable absorbers exhibit excited state lifetimes longer than the laser pulse width. With negligible excited state absorption, groundstate photobleaching occurs with increasing photon transmission at increasing laser fluence. iii) Reverse saturable absorber (RSA)→nonlinear PA emitter (, ). Non-zero absorption cross-sections of both the ground and excited states, as well as an excited state lifetime longer than the pulse width, results in a nonlinear increase in absorption and PA response at increasing laser intensity. Ground-state photobleaching occurs but does not impede excited-state absorption.
The optical photoacoustic z-scan (OPAZ) method is ideal for the evaluation of fluence dependent nonlinear optical properties such as those displayed by RSAs. A full description of the z-scan apparatus has been previously reported.[18] Briefly, in the z-scan method a sample is situated on a stage translatable along the optical axis of a focused laser beam which allows for the simultaneous monitoring of optical and acoustic responses at varied laser fluence.[26a,27] By adjusting the power of the input laser, a sample’s optical absorption and corresponding PA emission properties can be evaluated for a wide range of fluences. The optical and photoacoustic responses of select compounds (1, 4–10) with at the 532 nm laser excitation wavelength in acetonitrile solvent have been evaluated using the OPAZ method. Crystal violet has been included as a recently established LA reference material for PA studies (, Φfl(CH3CN) = 0).[18] The cyanine dye Cy3 has also been included due to its efficient absorption at 532 nm (, Φfl(CH3CN) = 0.16) as well as the popularity of this class of dye in PA imaging.
The crystal violet reference dye exhibits LA behavior up to a laser fluence of 200 mJcm−2, after which point the sample slowly becomes saturated and exhibits weak SA behavior (Figure 7). This LA optical z-scan behavior of crystal violet is correlated with the positive linear slope of its “PA emission versus laser fluence” response, at least until around 200 mJcm−2 after which point the PA emission tapers off due to sample saturation at higher laser fluence. Of the curcuminoid dyes, the pyrenyl and julolidine systems 6 and 10 exhibit distinct SA behavior from the onset of their optical z-scan response consistent with a declining slope in their “PA emission versus laser fluence” plots (Figure 7). It is the Cy3 cyanine dye however which exhibits prototypical SA behavior with the weakest PA response compared to all of the curcuminoid dyes here studied. Curcuminoids 5, 8 and 9 exhibit what appears to be LA type behavior in their optical z-scan spectra. However, as the latter dyes exhibit nanosecond lifetimes of their S1 states it is likely that ground state bleaching, that is, a SA response, is compensated for by weak excited state absorption ultimately giving rise to an overall LA response. Deviation from LA behavior to give the desired RSA behavior is observed for curcuminoids 1, 4 and 7. The onset of RSA behavior in the optical z-scan experiment is observed at around 120–150 mJcm−2 laser fluence. This corresponds nicely to the onset of an enhanced PA emission indicated by a deviation from a linear dependence on (a function of the z position in the OPAZ set up). Most significant is the relative increase in the PA signal of 4 which is indicative of a significantly increased capacity for excited state absorption at the 532 nm probing wavelength for this dye. The excellent RSA behavior of 4 is consistent with it having the highest fluorescence lifetime in acetonitrile of 3.71 ns. Quenching experiments confirm the excited state absorption process.
Figure 7.
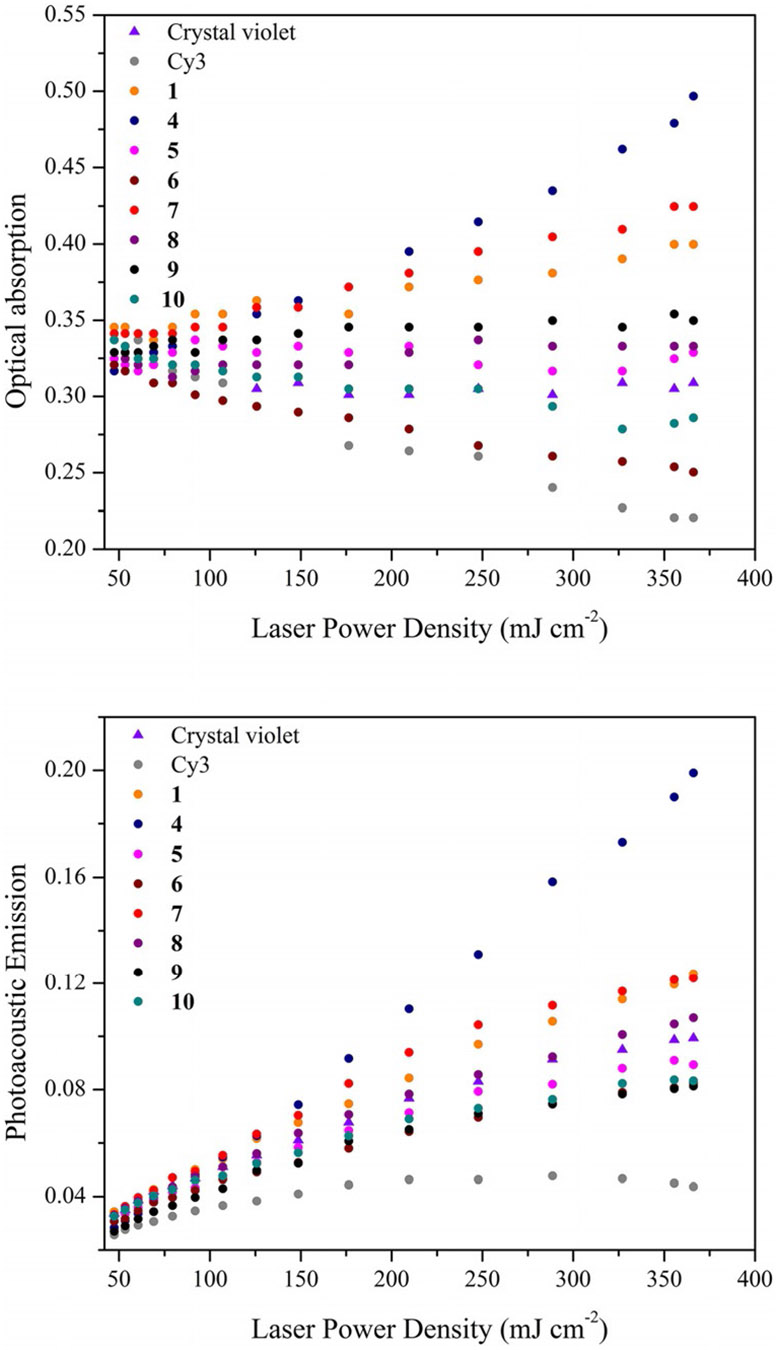
Optical (top) and photoacoustic (bottom) z-scan for molecules 1, 4–10, Cy3 and crystal violet reference compounds.
To probe the efficacy of all dyes as potential PAI and PAM contrast agents, a concentration dependence study has been conducted at both low (15 mJcm−2) and high (360 mJcm−2) laser fluence to determine the molar PA emission of all dyes, here reported using the observed PA versus concentration linear regression slopes in units of VM−1 (Figure 8). It must be kept in mind that the molar PA emission values reported are not absolute but relative and are strongly dependent upon all experimental conditions; most notably the laser fluence, pulse width and wavelength, as well as the solvent and sample path length. At the low laser power of 15 mJcm−2, all dyes are restricted to a linear PA emission due to the low probability of excited state absorption. It is also noteworthy that the laser fluence of 15 mJcm−2 at 532 nm falls below the maximum permissible exposure limits defined by the American National Standards Institute (ANSI). The phenomenon of nonlinear PA emission, which currently requires a high laser fluence, is therefore not applicable to living tissue but has potential application for in vitro applications using PAM.[28] Under low laser fluence conditions the variable PA emission from all samples is dictated by the product of the sample absorption cross section () and quantum yield for nonradiation decay (Φnr). Thus, from a molecular spectroscopy perspective variations in PA emission can be easily explained by following trends in both the S0→S1 molar extinction coefficient at the excitation wavelength and the quantum yield for competing fluorescence decay (Φfl). Essentially, the linear correlation between molar PA emission and concentration at low laser fluence is consistent with Beer’s law for LA optical behavior, albeit slightly modified due to competing fluorescence decay.
Figure 8.
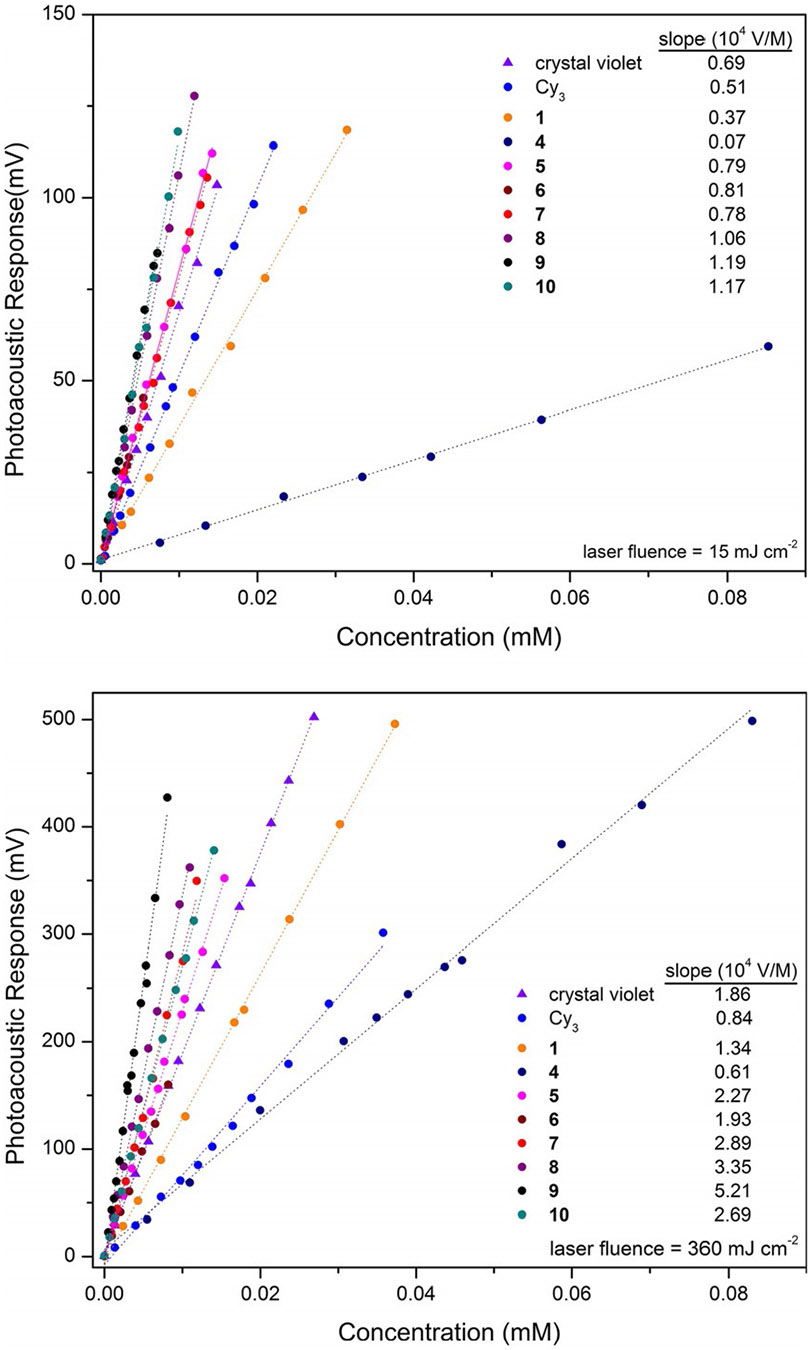
Molar photoacoustic emission of all dyes measured at low (15 mJ cm−2, top) and high (360 mJ cm−2, bottom) laser fluence. Note the larger y-axis scale used for presenting the high laser fluence data.
The anthracenyl (5, 0.79×10⁴VM−1), pyrenyl (6, 0.81×10⁴ VM−1), dimethylaminophenyl (7, 0.78×10⁴VM−1), triphenylamine (8, 1.06×10⁴VM−1), carbazole (9, 1.19×10⁴VM−1) and julolidene (10, 1.17×10⁴VM−1) curcuminoids each outperform the reference dyes crystal violet (0.69×10⁴VM−1) and Cy3 (0.51×10⁴VM−1) most likely due to their strong S0→S1 molar extinction coefficients at 532 nm (Figure 3). The naturally derived curcuminBF2 dye (1, 0.37×10⁴VM−1) exhibits a slightly weaker molar PA emission at low laser fluence relative to both the crystal violet and Cy3 reference dyes. The weakest molar PA emission of the series is exhibited by the napthacenyl terminated curcuminoid 4 (0.07×10⁴VM−1). This weak molar PA emission from 4 observed at low laser fluence is attributed to its relatively long-lived excited state in acetonitrile of 3.71 ns which gives rise to SA behavior.
Ironically, at least when absorption cross-section is not a variable during equal optical density measurements (Figure 7), it is the same long-lived excited state property which imparts 4 with an amplified PA emission under high laser fluence conditions; due to the higher probability of its long-lived excited state to participate in a second photon absorption. Comparing low versus high laser fluence molar PA measurements we can take advantage of the LA crystal violet dye, capable of quantitative PA emission at both 15 and 360 mJcm−2, which exhibits a 2.7-fold increase in PA emission (1.86×10⁴/0.69×104VM−1) is observed on going from low to high laser fluence. A 8.7-fold increase in molar PA emission is exhibited by 4 comparing low and high fluence experiments (0.61×10⁴/0.07×10−4VM−1) thus confirming its excited-state absorption enhancement in molar PA emission relative to crystal violet. It appears that although 4 is capable of enhanced molar PA emission at high laser fluence it still suffers from a relatively weak ground state absorption cross-section at 532 nm as the molar PA emission of 4, under RSA experimental conditions, still falls short of the LA and SA characteristic dyes due to their greater S0→S1 molar extinction coefficients at the excitation wavelength (Figure 8, bottom). Of the curcuminoid dyes, the naturally derived curcuminBF2 dye 1 exhibits a 3.6-fold enhancement of its molar PA emission at high laser fluence due to weak nonlinear enhancement, allowing it to overtake the SA Cy3 dye. The dimethylaminophenyl curcuminoid 7 exhibits a strong molar PA emission at both low (0.78×10⁴VM−1) and high (2.89×10⁴VM−1) laser fluence. Of the entire series the bis-carbazole curcuminoid 9 exhibits the strongest molar PA emission at high laser fluence (5.21×10⁴VM−1). This is attributed to 9 possessing the largest S0→S1 molar extinction coefficient of all dyes here studied at 532 nm but also due to residual RSA behavior as eluded to earlier in the discussion of PAZ-scan data. The observation of a 4.4-fold increase in molar PA emission for 9 confirms this residual RSA behavior relative to the LA crystal violet dye (2.7-fold increase) upon comparison of low versus high laser fluence “PA emission versus concentration” slopes.
Photoacoustic tomography (PAT) was also conducted on curcuminoids 1, 4–7, alongside a solvent blank and reference dyes crystal violet and Cy3 (Figure 9). The same image was recorded at low (15 mJcm−2) and high (150 and 450 mJcm−2) laser fluences where each sample was prepared with an equal 532 nm optical density of 0.15 in 1 mm borosilicate capillary tubes. As such, at low laser fluence there is little difference in contrast between each sample with curcuminBF2 (1), the bispyrenyl (6) and bis-triphenylamine (8) curcuminoids performing equally as well as the excellent crystal violet LA dye. At the higher laser fluence of 150 mJcm−2 RSA behavior is not yet strongly evident, however SA behavior of Cy3 and 6 is evident due to their relatively weaker PA contrast. At the highest applied laser fluence of 450 mJcm−2 the nonlinear PA enhancement of the bis-naphthalenyl (4) dye really comes to the fore exhibiting a strong contrast with 1 following close behind. A quantitative plot of normalized PA emission extracted from the PAT image clearly illustrates the dominance of 1 and 4 at high laser fluence (Figure 9). The remaining tertiary amine functionalized curcuminoids 7–10 each also exhibit an excellent contrast with 8 performing on par with the naturally derived curcuminoid 1.
Figure 9.
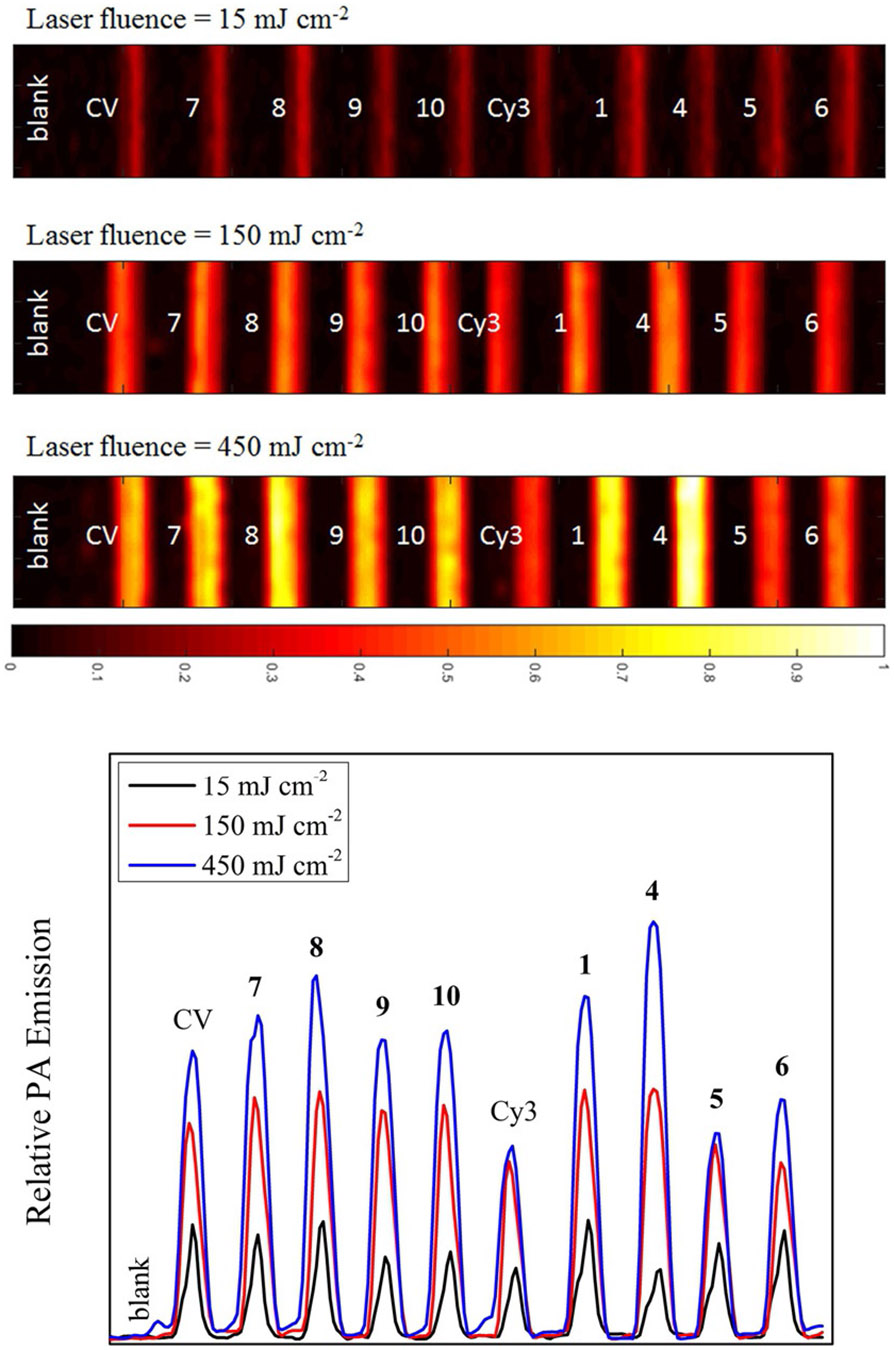
(top) PAT images recorded using three various laser fluence at . The x-axis color scale represents the normalized acoustic intensity. (bottom) A plot of the relative PA emission intensities extracted from each PAT image illustrating the nonlinear PA amplification for RSA dyes. (note: CV = crystal violet).
Conclusions
Two series of donor-π-acceptor-π-donor quadrupolar curcuminoid molecules have been successfully synthesized through the incorporation of aryl and tertiary amino substituents in order to investigate the effect of π-extension and increased electron donating strength on their photophysical and photoacoustic properties. UV/Vis absorption, fluorescence emission, electrochemical and computational investigations all consistently correlate redshifted absorption maxima in both series of curcuminoids with increased π-conjugation and/or electron donating strength. Time resolved fluorescence emission studies have found all molecules to possess S1 excited state lifetimes in the 1–2 ns range, thus providing the potential to display RSA behavior with a 3 ns pulse width Nd:YAG laser at 532 nm. Optical and photoacoustic z-scan (OPAZ-scan) experiments have determined that the bis-naphthalenyl (4), bis-p-dimethylaminophenyl (7), as well as the naturally derived curcuminBF2 (1) display RSA behavior at laser fluences > 120 mJcm−2. The strongest enhancement of PA signal due to this excited state absorption phenomenon is displayed by 4. Trends in the OPAZ-scan experiments were also borne out in PAT imaging experiments, notably with the bis-triphenylamine curcuminoid (8) outperforming the LA crystal violet reference dye indicative of weak RSA behavior not evident in OPAZ-scan studies. Importantly, the “molar photoacoustic response” has been reported which allows for a truly critical evaluation of the potential of these dyes towards application in PA imaging and microscopy relative to the LA crystal violet 532 nm reference dye. At a low laser fluence of 15 mJcm−2, within ANSI maximum permissible exposure limits, the bis-carbazole curcuminod (9) exhibits the strongest molar PA emission at 1.19×10⁴V M−1. Upon ramping to a higher laser fluence of 360 mJcm−2, an 8.7-fold increase in molar PA emission is exhibited by 4 relative to the 2.7-fold increase exhibited by the LA crystal violet dye, thus confirming its nonlinear enhancement in molar PA emission. Of the entire series of dyes studied, included crystal violet and Cy3, the biscarbazole curcuminoid 9 exhibits the strongest molar PA emission at high laser fluence (5.21×10⁴VM−1). This is attributed to 9 possessing the largest S0→S1 molar extinction coefficient of all dyes here studied at 532 nm but also due to a weak but contributing RSA behavior. Importantly, with respect to the future design of MPACs, this observation suggests that the magnitude of nonlinear molar PA enhancement alone is not appropriate and that a strong RSA behavior combined with a large ground state molar extinction coefficient is an attractive strategy to provide for a high PA contrast. Equipped with this better understanding of nonlinear PA emission enhancement future studies will focus on transitioning this technology towards the NIR biological window (700–900 nm) using water soluble contrast agents.
Experimental Section
Materials
Trifluoroboron etherate, 4-hydroxy-3-methoxybenzaldehyde, benzaldehyde, biphenyl-4-carboxaldehyde, 2-naphthaldehyde, 9-anthracenecarboxaldehyde, 1-pyrenecarboxaldehyde, 4-(dimethylamino)benzaldehyde, 4-(diphenylamino)benzaldehyde, 9-ethyl-3-carbazolecarboxaldehyde, 1,1,7,7-tetramethyl-9-formyljulolidine, and acetylacetone were purchased from Sigma Aldrich and used as received. Spectroscopic grade toluene, dichloromethane and methanol were purchased from Sigma Aldrich. ACS reagent grade toluene, dichloromethane and hexane for synthesis were purchased from Pharmco Aaper. Deuterated solvents d6-dimethylsulfoxide and d-chloroform were used as received from Sigma Aldrich.
Synthesis
For synthetic ease the reported method for borondifluoride curcuminoids was amended with the first step to obtain the pure acetylacetone difluoroboron intermediate (acacBF2) done in bulk prior to performing the reported Knovenagel condensation[29] with select aldehydes (1, 4-hydroxy-3-methoxybenzaldehyde; 2, benzaldehyde; 3, biphenyl-4-carboxaldehyde; 4, 2-naphthaldehyde; 5, 9-anthracenecarboxaldehyde; 6, 1-pyrenecarboxaldehyde; 7, 4-(dimethylamino)benzaldehyde; 8, 4-(diphenylamino)benzaldehyde; 9, 9-ethyl-3-carbazolecarboxaldehyde; 10, 1,1,7,7-tetramethyl-9-formyljulolidine) for curcuminoid formation. All products are sparingly soluble in toluene and yielded substantial precipitate upon cooling the reaction mixture. Analytically pure compounds were obtained following a wash with cold toluene and recrystallization from dicholormethane:hexane (1:10) consistent with the reported general method for borondifluoride curcuminoid synthesis.[29] Structures and purity of final compounds 1–10 were verified by 1H NMR (13C NMR where solubility allowed) and high resolution mass spectroscopy. Compounds 1, 2, 7 and 8 have been previously reported and analytical data matched those of the literature.[29]
3: 1H NMR ([D6]DMSO): δ=6.68 (s, 1H) 7.24–7.61 (m, 12H) 7.69 (br s, 3H) 7.73–7.90 (m, 8H) 7.99 (d, J=8.24 Hz, 3H) 8.08 (s, 1H) 8.14 ppm (s, 2H). 13C NMR ([D6]DMSO): δ=126.88, 127.37,129.12, 130.35 ppm. HRMS (ESI−) calcd for C31H23BF2O2 476.1759, found 476.1765.
4: 1H NMR (CDCl3): δ=5.96 (s, 1 H) 6.76 (d, J=15.66 Hz, 2H) 7.43–7.67 (m, 10 H) 7.80–7.97 (m, 8H) 8.28 (d, J=8.24 Hz, 3H) 8.50–8.63 ppm (m, 1H). HRMS (ESI−) calcd for C27H19BF2O2 424.1446, found 424.1451.
5: 1H NMR (CDCl3): δ = 5.99 (s, 1 H) 6.67 (d, J=15.93 Hz, 2H) 7.48–7.57 (m, 8H) 8.01–8.08 (m, 4H) 8.30–8.35 (m, 4H) 8.48 (s, 2H) 8.67–8.74 ppm (m, 2H). HRMS (ESI−) calcd for C35H23BF2O2 524.1759, found 524.1765.
6: 1H NMR (CDCl3): δ = 3.08 (s, 12H) 5.89 (s, 1H) 6.46 (d, J=15.38 Hz, 2H) 6.69 (d, J=8.79 Hz, 4H) 7.51 (d, J=9.06 Hz, 6H) 7.96 ppm (d, J=15.38 Hz, 2H). HRMS (ESI−) calcd for C39H23BF2O2 572.1759, found 572.1766.
9: 1H NMR (CDCl3): δ = 1.37 (br. s., 6H) 1.37–1.48 (m, 7H) 4.19–4.29 (m, 4H) 5.86–6.03 (m, 2H) 6.69 (d, J=0.27 Hz, 2H) 6.64 (d, J=0.14 Hz, 2H) 7.20–7.37 (m, 11H) 7.40–7.56 (m, 5H) 7.56–7.73 (m, 4H) 8.01–8.07 (m, 3H) 8.09–8.18 ppm (m, 5H). HRMS (ESI−) calcd for C35H29BF2N2O2 558.2290, found 558.2296.
10: 1H NMR (CDCl3): δ = 1.24–1.27 (m, 1H) 1.29 (s, 17H) 1.64–1.68 (m, 1H) 1.73–1.79 (m, 5H) 2.23 (s, 4H) 3.33–3.44 (m, 6H) 5.85 (s, 1H) 6.28–6.31 (m, 1H) 6.33–6.36 (m, 1H) 7.33 ppm (s, 2H). HRMS (ESI−) calcd for C39H49BF2N2O2 626.3855, found 626.3862.
Physical measurements
NMR spectra were recorded on an Agilent spectrometer operated at 399.80 MHz for 1H, 282 MHz for 19F and 100.54 MHz for 13C nuclei in CDCl3 or [D6]DMSO and the residual solvent signals used as an internal reference point for reporting the chemical shift (δ).[30] Mass spectroscopy was carried on a Thermo Scientific Orbitrap Velos Pro mass spectrometer. Electrochemical experiments were carried out on a CH Instruments 620D potentiostat. A standard three electrode cell was used under an atmosphere of argon with 0.1 m Bu4NPF6 in spectrophotometric grade acetonitrile as the supporting electrolyte. Glassy carbon (3-mm diameter) and Pt wire were used as working and counter electrodes, respectively. A nonaqueous reference electrode was used to minimize IR drop at the solvent interface. This consisted of a Ag wire in the same supporting electrolyte separated by a vycor frit. All sweep and pulse voltammetry experiments were calibrated using ferrocene as an internal pseudo reference due to the relative instability of the reference electrode employed and all potentials are thus reported in reference to the ferricenium/ferrocence (Fc+/0) couple. Due to the irreversibility of all potentials the redox potential E could not be calculated and oxidation or reduction potentials are reported from square-wave voltammograms (step: 4 mV, amplitude: 10 mV, frequency: 15 s−1) as a best estimate. UV/Vis absorption spectra were recorded on an Agilent 8456 diode array spectrophotometer in spectrophotometric grade solvents. Steady state and time-resolved fluorescence measurements were carried out on a Photon Technology International Quantamaster 40 and 25 fluorimeter at room temperature. Quantum yields were calculated by the optically dilute technique with fluorescein (aqueous NaOH, pH 1, λexc = 390 nm, Φref=0.925) and rhodamine 6G (neat acetonitrile, λexc=480 nm, Φref=0.94) used as reference standards according to Equation (2).
| (2) |
The subscript “s” refers to the unknown sample and the subscript “ref’ to the reference sample, A is the absorbance at the excitation wavelength, is the integrated emission area, and η is the solvent refractive index. Excitation and emission slits were both set to 5 nm. Fluorescence lifetimes (τ) were recorded at room temperature at the emission maximum following LED excitation at 456 nm or 572 nm. The radiative rate constant () and nonradiative rate constant () were both calculated from τ and by using Equations (3)-(6).
| (3) |
| (4) |
| (5) |
| (6) |
Computational details
All calculations were carried out using density functional theory (DFT) with the B3LYP (2–6) and CAM B3LYP (1,7–10) functional as implemented in the Gaussian 09 program package and 6-311g (d,p) basis set.[31] The optimization calculations were carried out using the polarizable continuum model (PCM) with the dielectric constant of toluene.[32] A vibrational frequency analysis coupling with PCM model was carried out in order to confirm the minimum-energy geometry in solution, followed by Time-dependent Density Functional Theory (TD-DFT)[33] TD-DFT calculations for 1, 7–10 included the keyword cis(d) to account for configurational interactions.
Collection and reduction of X-ray data
A crystal (0.50×0.10×0.03 mm) of 5·CHCl3 mounted on the end of a glass fiber and transferred to Bruker Kappa Apex II diffractometer for the collection of diffraction data. Diffraction data for indicated triclinic symmetry consistent with space group P-1. Crystal data and information about the data collection are provided in Tables S3—S7 in the Supporting Information.
Determination and refinement of the structure
The structure of 5·CHCl3 was solved[34] by direct methods. In the least-squares refinement[34] anisotropic temperature parameters were used for all the non-hydrogen atoms. Hydrogen atoms were placed at calculated positions and allowed to “ride” on the atom to which they were attached. The isotropic thermal parameter for the hydrogen atoms were determined from the atom to which they were attached. The data was corrected using the multi-scan method (SADABS).[35]
Optical photoacoustic z-scan (OPAZ) experimental details
For OPAZ-scan measurements a 2.0 mm path length quartz cell was placed at a 45° angle with respect to the incident laser beam (effective path length=2.83 mm). A custom made sample cell housing unit was used wherein the quartz cell is placed and is filled with water for acoustic signal transmission. Samples were dissolved in spectroscopic grade acetonitrile having a linear absorption coefficient (α) of 345 m−1 at the laser excitation wavelength 532 nm (optical density=0.3). A 9:1 acetonitrile:dichloromethane mixture was required for 4–10 to prevent precipitation during data collection. The output of a frequency doubled Nd:YAG laser (Continuum Minilite II, 532 nm, pulse width ≈3 ns) was focused onto the sample using a 18 cm focal length lens. The sample was mounted on an automated translation stage (Thorlabs NRT 150) and moved horizontally along the z direction through the focal point of the beam. Each z-scan experiment took roughly 7 minutes in total. Samples were translated along the z-axis over 15 cm in steps of 5 mm. At each position the photoacoustic and optical signals were recorded by averaging the response of 20 laser pulses (@10Hz = 2 sec. duration). UV/Vis absorption spectra were recorded before and after each z-scan experiment to ensure the stability of the sample. No degradation was observed under these experimental conditions for the series of dyes presented. Each experiment was repeated 3 times with freshly prepared sample to check for reproducibility. The beam waist (x0) at focal plane was estimated to be 70±5 μm. The energy incident on the sample was controlled by the combination of a half-wave plate and a linear polarizer. The incident laser energy before the focusing lens S5 was 65 μJ. At the focal point the sample experiences optimum pump intensity, which decreases gradually on either side of the focus as the sample is translated along the z-axis. As the fluence of incident light changes, the optical transmittance varies according to the sample’s nonlinear electronic absorption properties. The PA emission was collected using a 10 MHz, 1 inch focal length water immersion ultrasonic transducer (Olympus NDT U8517074). Importantly, the linear response of the optical detector as well as the ultrasound transducer were verified by measuring the transmittance and the corresponding generated PA response as a function of crystal violet concentration in acetonitrile (optical density from 0 to 1) at 532 nm. A correlation better than R2 = 0.99 was obtained for transmittance measurements when a neutral density filter of OD 1 was placed in front of the detector (Newport 818 series photodiode sensor with a 3 OD filter; data not shown) while the PA signal showed excellent linearity.
Photoacoustic tomography
For PAT measurements the output of a frequency doubled Nd:YAG laser is directed onto a prism which allows the laser beam to focus on the sample at a 45° angle using a 10 cm confocal lens. The sample is placed in a cell housing unit which is filled with water for acoustic signal coupling. A 10 MHz water immersion unfocused transducer (Olympus V311-SU is placed directly above the sample. The sample is mounted on an automated XYZ translation stage (Thorlabs NRT 100) and moved along the x and y directions in discrete steps to perform 2D raster scan. The PA signal is collected by the transducer and then amplified using a pulse amplifier (which was fed to a Lecroy Wavepro oscilloscope for display and data collection). The scanning and data collections are controlled by a Labview routine. By collecting data points along the xy plane, a maximum intensity projection (MIP) is obtained by taking the absolute value of the Hilbert transform of the acquired signal via MATLAB. The MIP image is the map of optical absorption of the sample. The lateral resolution of the PAT system is dictated by the laser beam size which was estimated to be 70 ± 5 μm. The dyes were injected into 1 mm tube and then placed parallel in the Y direction in the bottom of the cell housing unit.
Supplementary Material
Acknowledgements
Funding for this research was provided by NIH grant U54CA156734. FM thanks the Oracle Education Foundation for financial support. We thank Dr. E. Fujita of Brookhaven National Laboratory for the use of the Bruker Kappa Apex II diffractometer for X-ray data collection.
Footnotes
Supporting information and the ORCID identification number(s) for the author(s) of this article can be found under https://doi.org/10.1002/chem.201704423.
Conflict of interest
The authors declare no conflict of interest.
References
- [1].a) Aggarwal BB, Sundaram C, Malani N, Ichikawa H, Molecular Targets and Therapeutic Uses of Curcumin in Health and Disease, Springer, 2007, 595, [Google Scholar]; 1b) Sharma RA, Gescher AJ, Steward WP, Eur. J. Cancer 2005, 41, 1955–1968; [DOI] [PubMed] [Google Scholar]; c) Goel A, Kunnumakkara AB, Aggarwal BB, Biochem. Pharmacol 2008, 75, 787–809; [DOI] [PubMed] [Google Scholar]; d) Bairwa K, Grover J, Kania M, Jachak SM, RSC Adv. 2014, 4, 13946–13978. [Google Scholar]
- [2].Henari F, Cassidy S, Jasim KE, Dakhel A, J. Nonlinear Opt. Phys. Mater 2013, 22, 1350017. [Google Scholar]
- [3].a) Ganesh T, Kim JH, Yoon SJ, Kil B-H, Maldar N, Han JW, Han S-H, Mater. Chem. Phys 2010, 123, 62–66; [Google Scholar]; b) Richhariya G, Kumar A, Tekasakul P, Gupta B, Renewable Sustainable Energy Rev. 2017, 69, 705–718. [Google Scholar]
- [4].a) Zhou S-S, Xue X, Wang J-F, Dong Y, Jiang B, Wei D, Wan M-L, Jia Y, J. Mater. Chem 2012, 22, 22774–22780; [Google Scholar]; b) Prçhl M, Schubert US, Weigand W, Gottschaldt M, Coord. Chem. Rev 2016, 307, 32–41. [Google Scholar]
- [5].Kumar A, Li L, Chaturvedi A, Brzostowski J, Chittigori J, Pierce S, Samuelson LA, Sandman D, Kumar J, Appl. Phys. Lett 2012, 100, 203701. [Google Scholar]
- [6].Wu W, Shen J, Banerjee P, Zhou S, Biomaterials 2011, 32, 598–609. [DOI] [PubMed] [Google Scholar]
- [7].a) Aggarwal BB, Kumar A, Bharti AC, Anticancer Res. 2003, 23, 363–398; [PubMed] [Google Scholar]; b) Gyuris M, Hackler L, Nagy LI, Alfçldi R, Rédei E, Marton A, Vellai T, Faragó N, Ózsvári B, Hetényi A, Tóth GK, Sipos P, Kanizsai I, Puskás LG, Arch. Pharm 2017, 350, e1700005. [DOI] [PubMed] [Google Scholar]
- [8].a) Kamada K, Namikawa T, Senatore S, Matthews C, Lenne P-F, Maury O, Andraud C, Ponce-Vargas M, Le Guennic B, Jacquemin D, Agbo P, An DD, Gauny SS, Liu X, Abergel RJ, Fages F, D’Aleo A, Chem. Eur. J 2016, 22, 5219–5232; [DOI] [PubMed] [Google Scholar]; b) Chignell CF, Bilski P, Reszka KJ, Motten AG, Sik RH, Dahl TA, Photochem. Photobiol 1994, 59, 295–302. [DOI] [PubMed] [Google Scholar]
- [9].a) Beard P, Interface focus 2011, rsfs20110028; [DOI] [PMC free article] [PubMed] [Google Scholar]; b) Li L, Zhu L, Ma C, Lin L, Yao J, Wang L, Maslov K, Zhang R, Chen W, Shi J, Nat. Biomed. Eng 2017, 1, 0071. [DOI] [PMC free article] [PubMed] [Google Scholar]
- [10].a) Zhang HF, Maslov K, Stoica G, Wang LV, Nat. Biotechnol 2006, 24, 848; [DOI] [PubMed] [Google Scholar]; b) Park S, Vial J-C, Kyhm K, Opt. Express 2017, 25, 18917–18928. [DOI] [PubMed] [Google Scholar]
- [11].Bell AG, Am. J. Sci 1880, 305–324. [Google Scholar]
- [12].Mallidi S, Luke GP, Emelianov S, Trends Biotechnol. 2011, 29, 213–221. [DOI] [PMC free article] [PubMed] [Google Scholar]
- [13].a) James ML, Gambhir SS, Physiol. Rev 2012, 92, 897–965; [DOI] [PubMed] [Google Scholar]; b) Pu K, Shuhendler AJ, Jokerst JV, Mei J, Gambhir SS, Bao Z, Rao J, Nat. Nanotechnol 2014, 9, 233; [DOI] [PMC free article] [PubMed] [Google Scholar]; c) Miao Q, Pu K, Bioconjugate Chem. 2016, 27, 2808–2823; [DOI] [PubMed] [Google Scholar]; d) Jiang Y, Pu K, Small 2017, 13, 1700710. [DOI] [PubMed] [Google Scholar]; e) Lyu Y, Zhen X, Miao Y, Pu K, ACS Nano 2017, 11, 358–367. [DOI] [PubMed] [Google Scholar]
- [14].Fang J, Nakamura H, Maeda H, Adv. Drug Delivery Rev 2011, 63, 136–151. [DOI] [PubMed] [Google Scholar]
- [15].a) Thakor AS, Gambhir SS, CA-Cancer J. Clin 2013, 63, 395–418; [DOI] [PubMed] [Google Scholar]; b) Soo Choi H, Liu W, Misra P, Tanaka E, Zimmer JP, Ipe BI, Bawendi MG, Frangioni JV, Nat. Biotechnol 2007, 25, 1165–1170. [DOI] [PMC free article] [PubMed] [Google Scholar]
- [16].a) Abdelhalim MAK, Jarrar BM, J. Nanobiotechnol 2012, 10, 5; [DOI] [PMC free article] [PubMed] [Google Scholar]; b) Kommareddy S, Amiji M, J. Pharm. Sci 2007, 96, 397–407. [DOI] [PubMed] [Google Scholar]
- [17].Luke GP, Yeager D, Emelianov SY, Ann. Biomed. Eng 2012, 40, 422–437. [DOI] [PubMed] [Google Scholar]
- [18].a) Frenette M, Hatamimoslehabadi M, Bellinger-Buckley S, Laoui S, La J, Bag S, Mallidi S, Hasan T, Bouma B, Yeleswarapu C, Rochford J, J. Am. Chem. Soc 2014, 136, 15853–15856; [DOI] [PMC free article] [PubMed] [Google Scholar]; b) Hatamimoslehabadi M, Bellinger S, La J, Ahmad E, Frenette M, Yelleswarapu C, Rochford J, J. Phys. Chem. C, 2017, 121, 24168–24178. [Google Scholar]
- [19].Liu K, Chen J, Chojnacki J, Zhang S, Tetrahedron Lett. 2013, 54, 2070–2073. [DOI] [PMC free article] [PubMed] [Google Scholar]
- [20].Aliaga-Alcalde N, Marques-Gallego P, Kraaijkamp M, Herranz-Lancho C, den Dulk H, Gorner H, Roubeau O, Teat SJ, Weyhermuller T, Reedijk J, Inorg. Chem 2010, 49, 9655–9663. [DOI] [PubMed] [Google Scholar]
- [21].a) Barashkov NN, Sakhno TV, Nurmukhametov RN, Khakhel OA, Usp. Khim 1993, 62, 579–593; [Google Scholar]; b) Khakhel OA, Nurmukhamedov RN, Sakhno TV, Serov SA, Barashkov NN, Muraveva TM, Zh. Fiz. Khim 1992, 66, 2639–2645; [Google Scholar]; c) Khakhel’ OA, Nurmukhametov RN, Sakhno TV, Chem. Phys. Lett 1995, 247, 185–188; [Google Scholar]; d) Krikunova VE, Serov SA, Khakhel OA, Opt. Spectrosc 1999, 86, 373–376. [Google Scholar]
- [22].a) Lippert E, Z. Elektrochem 1957, 61, 962; [Google Scholar]; b) Mataga N, Kaifu Y, Koizumi M, Bull. Chem. Soc. Jpn 1956, 29, 465–470; [Google Scholar]; c) Lakowicz JR, Principles of Fluorescence Spectroscopy, Springer US, 2007. [Google Scholar]
- [23].Felouat A, D’Aléo A, Fages F, J. Org. Chem 2013, 78, 4446–4455. [DOI] [PubMed] [Google Scholar]
- [24].a) D’Aléo A, Gachet D, Heresanu V, Giorgi M, Fages F, Chem. Eur. J 2012, 18, 12764–12772; [DOI] [PubMed] [Google Scholar]; b) Kim E, Felouat A, Zaborova E, Ribierre J-C, Wu JW, Senatore S, Matthews C, Lenne P-F, Baffert C, Karapetyan A, Giorgi M, Jacquemin D, Ponce-Vargas M, Le Guennic B, Fages F, D’Aléo A, Org. Biomol. Chem 2016, 14, 1311–1324; [DOI] [PubMed] [Google Scholar]; c) Cogné-Laage E, Allemand JF, Ruel O, Baudin JB, Croquette V, Blanchard-Desce M, Jullien L, Chem. Eur. J 2004, 10, 1445–1455. [DOI] [PubMed] [Google Scholar]
- [25].Christodoulides DN, Khoo IC, Salamo GJ, Stegeman GI, Van Stryland EW, Adv. Opt. Photonics 2010, 2, 60–200. [Google Scholar]
- [26].a) Yelleswarapu CS, Kothapalli S-R, Opt. Express 2010, 18, 9020–9025; [DOI] [PubMed] [Google Scholar]; b) Hung RR, Grabowski JJ, J. Am. Chem. Soc 1992, 114, 351–353. [Google Scholar]
- [27].a) Chapple P, Staromlynska J, Hermann J, Mckay T, McDuff R, J. Nonlinear Opt. Phys. Mater 1997, 6, 251–293; [Google Scholar]; b) Sheik-Bahae M, Said AA, Wei TH, Hagan DJ, Vanstryland EW, IEEE J. Quantum Electron 1990, 26, 760–769. [Google Scholar]
- [28].Zhang Y, Cai X, Wang Y, Zhang C, Li L, Choi SW, Wang LV, Xia Y, Angew. Chem. Int. Ed 2011, 50, 7359–7363; [DOI] [PMC free article] [PubMed] [Google Scholar]; Angew. Chem 2011, 123, 7497–7501. [Google Scholar]
- [29].Zhai L, Liu M, Xue P, Sun J, Gong P, Zhang Z, Sun J, Lu R, J. Mater. Chem. C 2016, 4, 7939–7947. [Google Scholar]
- [30].Fulmer GR, Miller AJM, Sherden NH, Gottlieb HE, Nudelman A, Stoltz BM, Bercaw JE, Goldberg KI, Organometallics 2010, 29, 2176–2179. [Google Scholar]
- [31].Gaussian 09, Revision A.1 ed., Frisch MJ, Trucks GW, Schlegel HB, Scuseria GE, Robb MA, Cheeseman JR, Scalmani G, Barone V, Mennucci B, Petersson GA, Nakatsuji H, Caricato M, Li X, Hratchian HP, Izmaylov AF, Bloino J, Zheng G, Sonnenberg JL, Hada M, Ehara M, Toyota K, Fukuda R, Hasegawa J, Ishida M, Nakajima T, Honda Y, Kitao O, Nakai H, Vreven T, Montgomery JA Jr., Peralta JE, Ogliaro F, Bearpark M, Heyd JJ, Brothers E, Kudin KN, Staroverov VN, Kobayashi R, Normand J, Raghavachari K, Rendell A, Burant JC, Iyengar SS, Tomasi J, Cossi M, Rega N, Millam JM, Klene M, Knox JE, Cross JB, Bakken V, Adamo C, Jaramillo J, Gomperts R, Stratmann RE, Yazyev O, Austin AJ, Cammi R, Pomelli C, Ochterski JW, Martin RL, Morokuma K, Zakrzewski VG, Voth GA, Salvador P, Dannenberg JJ, Dapprich S, Daniels AD, Farkas Ö, Foresman JB, Ortiz JV, Cioslowski J, and Fox DJ, Gaussian Inc., Wallingford, CT., 2009. [Google Scholar]
- [32].Tomasi J, Mennucci B, Cammi R, Chem. Rev 2005, 105, 2999–3093. [DOI] [PubMed] [Google Scholar]
- [33].Scalmani G, Frisch MJ, Mennucci B, Tomasi J, Cammi R, Barone V, J. Chem. Phys 2006, 124, 094107. [DOI] [PubMed] [Google Scholar]
- [34].Sheldrick GM, SHELXL Version 5, Siemens Analytical Instruments, Inc., Madison WI, 1994. [Google Scholar]
- [35].Version 2007/2 ed., (Sheldrick, Bruker AXS Inc.). [Google Scholar]
Associated Data
This section collects any data citations, data availability statements, or supplementary materials included in this article.