


Abstract
A computational method was developed for delineating connected gene neighborhoods in bacterial and archaeal genomes. These gene neighborhoods are not typically present, in their entirety, in any single genome, but are held together by overlapping, partially conserved gene arrays. The procedure was applied to comparing the orders of orthologous genes, which were extracted from the database of Clusters of Orthologous Groups of proteins (COGs), in 31 prokaryotic genomes and resulted in the identification of 188 clusters of gene arrays, which included 1001 of 2890 COGs. These clusters were projected onto actual genomes to produce extended neighborhoods including additional genes, which are adjacent to the genes from the clusters and are transcribed in the same direction, which resulted in a total of 2387 COGs being included in the neighborhoods. Most of the neighborhoods consist predominantly of genes united by a coherent functional theme, but also include a minority of genes without an obvious functional connection to the main theme. We hypothesize that although some of the latter genes might have unsuspected roles, others are maintained within gene arrays because of the advantage of expression at a level that is typical of the given neighborhood. We designate this phenomenon ‘genomic hitchhiking’. The largest neighborhood includes 79 genes (COGs) and consists of overlapping, rearranged ribosomal protein superoperons; apparent genome hitchhiking is particularly typical of this neighborhood and other neighborhoods that consist of genes coding for translation machinery components. Several neighborhoods involve previously undetected connections between genes, allowing new functional predictions. Gene neighborhoods appear to evolve via complex rearrangement, with different combinations of genes from a neighborhood fixed in different lineages.
INTRODUCTION
Operons, groups of adjacent, co-expressed genes that encode functionally linked proteins, are the principal form of gene co-regulation in prokaryotes (1–3). Certain operons, particularly those that encode subunits of multiprotein complexes, such as ribosomal proteins, are conserved in phylogenetically distant bacterial genomes or even between archaea and bacteria (4,5). This is due, in part, to conservation of these operons over long stretches of evolutionary time, perhaps even since the last universal common ancestor of all modern life forms, and, in part, to horizontal spread of operons among prokaryotes. Operons are often thought of as ‘selfish’ in the sense that horizontal transfer of an entire operon is favored by selection over transfer of individual genes because, in the former case, gene co-expression and co-regulation are preserved (6,7). More detailed comparisons of sequenced prokaryotic genomes have shown that operons tend to undergo multiple rearrangements during evolution (8). Gene order at a level above operons is poorly conserved, and genome comparison diagonal plots, in which points indicate orthologs, appear completely disordered even for species that belong to the same prokaryotic lineage, for example Escherichia coli and Haemophilus influenzae, two members of the γ-subdivision of Proteobacteria (4,9). A recent detailed analysis of gene order conservation among prokaryotes showed that only 5–25% of the genes in bacterial and archaeal genomes belong to gene strings (probable operons) shared by at least two genomes, once closely related species are excluded (10).
The evolutionary fluidity of operons makes comparative analysis of gene orders in general and operon prediction in particular non-trivial tasks. Several methods have been proposed for comparing gene orders in pairs of genomes and in multiple genomes and detecting local gene order conservation; these methods differ in the amount of gene insertion/deletion and local rearrangement that they allow (10–14). Application of these and other methods for gene order comparison produced a wealth of functional and evolutionary information that has been interpreted within the more general framework of genome context analysis (15–17). Bork and co-workers proposed the concept of ‘über-operon’, a set of genes whose functional and regulatory contexts tend to be conserved despite numerous rearrangements (18). The conglomerate of operons encoding ribosomal proteins, the largest group of genes whose order is partially conserved in all prokaryotic genomes, is the paragon of an über-operon. It has to be emphasized that an über-operon does not necessarily portray the arrangement of the given set of genes in any extant or ancestral genome; instead, the composition and order of genes included in an über-operon seem to reflect multiple, alternative pathways of evolution.
We sought to expand the über-operon concept by delineating extended gene neighborhoods on the basis of the results of the comparison of gene orders in multiple prokaryotic genomes. The idea underlying this approach is that different genomes contain different, overlapping parts of evolutionarily and functionally connected gene neighborhoods and, by generating a ‘tiling path’ through these overlaps, we should be able to reconstruct the entire neighborhood. Examination of these neighborhoods might help not only in interpreting context-based functional prediction, but also in elucidating the evolutionary forces that govern the evolution of operons and über-operons.
MATERIALS AND METHODS
Sequence data
The sequences of the proteins encoded in complete prokaryotic genomes were extracted from the Genome division of the Entrez retrieval system (http:www.ncbi.nlm.nih.gov:80/PMGifs/Genomes/org.html) (19). The analyzed genomes included those of 23 bacteria: Aquifex aeolicus (Aae), Bacillus halodurans (Bha), Bacillus subtilis (Bsu), Borrelia burgdorferi (Bbu), Campylobacter jejunii (Cje), Chlamydia trachomatis (Ctr), Chlamydophila pneumoniae (Cpn), Deinococcus radiodurans (Dra), E.coli (Eco), H.influenzae (Hin), Helicobacter pylori (Hpy), Mycoplasma genitalium (Mge), Mycoplasma pneumoniae (Mpn), Mycobacterium tuberculosis (Mtu), Neisseria meningitidis (Nme), Pseudomonas aeruginosa (Pae), Rickettsia prowazekii (Rpr), Synechocystis PCC6803 (Syn), Thermotoga maritima (Tma), Treponema pallidum (Tpa), Vibrio cholerae (Vch), Xylella fastidiosa (Xfa) and Ureaplasma urealyticum (Uur); and eight archaea: Aeropyrum pernix (Aer), Archaeoglobus fulgidus (Afu), Halobacterium sp. (Hsp), Methanobacterium thermoautotrophicum (Mth), Methanococcus jannaschii (Mja), Pyrococcus horikoshii (Pho), Pyrococcus abyssi (Pab) and Thermoplasma acidophilum (Tac).
Conserved pairs of genes
The Clusters of Orthologous Groups of proteins (COGs) database was used as the source of information on orthologous genes in prokaryotic genomes (20,21). A pair of genes from two COGs was considered to be conserved if the respective genes were transcribed in the same direction and were separated by zero, one or two genes in at least three of the compared genomes; the order of the genes was taken into account (5′…COG_A→COG_B…3′ and 5′…COG_B→COG_A…3′ were counted as two different pairs). Conservation of gene pairs in groups of closely related species, namely V.cholerae–E.coli–H.influenzae, C.trachomatis–C.pneumoniae, P.horikoshii–P.abyssi, U.urealyticum–M.genitalium–M.pneumoniae, T.pallidum–B.burgdorferi and B.subtilis–B.halodurans, was disregarded: if a gene pair was found in two or three closely related species, it was counted only once.
The probability of random occurrence of ‘conserved’ unidirectional gene pairs was assessed using Monte Carlo simulations. For each of 100 repetitions, random permutations of the gene order in each genome were generated, and the set of conserved pairs was produced using the procedure described above.
Procedure for identifying gene arrays
In order to develop a procedure for constructing arrays of genes from conserved gene pairs, we represent the problem in graph-theoretical terms (22,23), with each gene involved in a conserved gene pair corresponding to a vertex ai and the pair itself corresponding to a directed edge aiaj.
Definition 1: a directed graph (digraph) consists of a set of vertices connected with directed edges.
Definition 2: a vertex sequence a1a2a3…an is a trail if aiai+1 is an edge of the digraph for each j:1≤j<n, and no edge occurs in the trail more than once. (Note that vertices are allowed to repeat.) The length of the trail a1a2a3…an is the number of edges in the trail, which is equal to n–1 (one less than the number of vertices).
Definition 3: a triplet is a trail of length 2.
Definition 4: aiajak is an allowable triplet if the genes ai, aj and ak are present in this order in at least one of the analyzed genomes.
Definition 5: we call a trail a1a2a3…an allowable if ajaj+1aj+2 is an allowable triplet for each j:1≤j<n–1.
Definition 6: we call an allowable trail b1b2b3…bm an extension of the allowable trail a1a2a3…an if each of the ajs appear amongst the bis in the same order. In other words, b1b2b3…bm can be generated a1a2a3…an by applying the following operations: (i) replacing the edge ajaj+1 by a trail that starts on aj and ends on aj+1, and (ii) appending a trail to the beginning or the end of a1a2a3…an. (Note that, by definition, each trail is an extension of itself.)
Definition 7: we call an allowable trail a1a2a3…an maximal if it has no extension other than itself.
Definition 8: we call an allowable trail a1a2a3…an end-maximal if its only extensions start on a1 and end on an. In other words, all possible extensions can be obtained from the trail by the repeated operation of replacing the edge ajaj+1 by a trail that starts on aj and ends on aj+1.
Problem: Given a digraph and all of its allowable triplets, find all maximal allowable trails.
Algorithm
Input: vertices, edges, allowable triplets of the digraph. Output: a list of all maximal allowable trails. We make a list of the (possible) maximal allowable trails found so far. The list is initially empty. For each edge of the digraph, we do the following: sequentially find all allowable trails starting from the given edge that are not extendable at their endpoint and, if the trail is not extendable backward at the starting point, check it against the list of possible maximal allowable trails found so far. Compare it with each trail in the list. There are two possible cases: (i) if a trail is found in the list that is an extension of the new trail, the new trail is discarded and the checking is stopped; (ii) if a trail is found in the list that is extended by the new trail, the trail is removed from the list, and the checking is continued against the next trail. If we reach the end of the list and still have not eliminated the new trail, it is added to the list. At the end, output the list of all maximal allowable trails.
A detailed description of the algorithm accompanies the program EM_TRAILS, which is available at ftp://ncbi.nlm.nih.gov/pub/koonin/gene_neighborhoods.
Clustering of gene arrays
Overlapping gene arrays were merged using single-linkage clustering. Gene arrays were merged in a cluster if they shared at least three genes (for arrays containing four or more genes) or at least two genes (for three-gene arrays). This implies that any trail and its extension are in the same cluster, which is one of the reasons why it is not necessary to find trails that are not maximal. The resulting clusters were projected on genomes. In each genome, all unidirectional strings of genes with short spacers (directons) (24) that include conserved COG pairs comprising the projected cluster were identified. The maximum allowed spacer length in a directon was defined for each genome separately as the 95% quantile of the distribution of the actual spacer lengths between all unidirectional adjacent genes from the COGs in a given genome.
RESULTS AND DISCUSSION
Delineation of connected gene neighborhoods
Conserved gene pairs. The present analysis is based on the notion of a conserved gene pair (Fig. 1). Conserved pairs were defined using the information on orthologous genes in prokaryotic genomes that is contained in the COGs database (21). A pair of genes from two COGs was considered to be conserved if the respective genes were transcribed in the same direction and separated by zero, one or two genes in at least three of the genomes compared (closely related genomes excluded; see Materials and Methods). This relaxed definition of a conserved gene pair was adopted because numerous rearrangements, deletions and insertions have been found in operons whose characteristic size is three to five genes (8,10). The presence of a gene pair in at least three genomes was required to ensure that such pairs are indeed conserved during evolution and not just shared by chance. A Monte Carlo simulation showed that, on average, only 12 conserved gene pairs were found in three or more genomes by chance. For gene pairs shared by two genomes, the average value was 318, which corresponds to approximately two conserved gene pairs per genome pair. In an independent study, it has been estimated that conserved gene pairs have an ∼0.98 probability of belonging to the same operon (25). Although, taken together, these observations show that most of the gene pairs that are conserved even in two genomes are only evolutionarily and probably functionally relevant, only pairs conserved in three or more genomes were used for the construction of gene arrays to avoid proliferation of false positives.
Figure 1.

A flow chart of the procedure for construction of arrays and clusters from conserved gene pairs. Colored arrows indicate COGs that form conserved pairs and open arrows indicate COGs or non-COG genes that do not form conserved pairs, but are allowed to insert between genes in a pair.
Altogether, 1505 conserved gene pairs including 1337 COGs were detected. The majority of these pairs are present in a small number of genomes; ∼90% of the conserved pairs are found in three to thirteen genomes. As described elsewhere, the distribution of the conserved gene pairs by the number of genomes in which they are represented closely fits the geometric model, with the exception of the tail that corresponds to highly conserved pairs (26). Only 21 gene pairs were present in all compared genomes; all these invariant pairs consist of genes for ribosomal proteins and RNA polymerase subunits.
Among the highly conserved gene pairs present in seven or more genomes, a substantial majority include genes coding for proteins from the same functional category (as defined in the COG database; http://www.ncbi.nlm.nih.gov/COG/) (Fig. 2). In contrast, and somewhat unexpectedly, among the gene pairs that are only conserved in three to five genomes do the majority consists of genes from different categories (Fig. 2). The evolutionary conservation of the analyzed gene pairs and the results of the Monte Carlo simulations strongly suggest that most, if not all, of these pairs are non-random and, by inference, functionally relevant. The juxtaposition of genes from different functional categories might, in part, be due to certain features of the functional classification employed: for example, a pair of genes that consists of a transcriptional regulator and the regulated gene will be classified as representing different categories (transcription and whatever category the regulated gene belongs to). However, the major underlying reason is probably the ‘genome hitchhiking’ phenomenon discussed below.
Figure 2.

Representation of COGs of the same functional category and of different functional categories in conserved gene pairs.
The observed distribution of conserved gene pairs among genomes indicates that although a small fraction of the pairs are strongly supported by selection, the majority are relatively unstable during evolution and prone to rearrangement and horizontal transfer. This emphasizes the need to employ approaches that go beyond straightforward genome alignment or local similarity search, to extract maximum information from prokaryotic gene order.
Arrays of conserved gene pairs. The next step in the identification of connected gene neighborhoods involved construction of arrays of conserved gene pairs on the basis of overlaps between gene pairs in different genomes (Fig. 1). Given two pairs of COGs, COG_A–COG_B and COG_B–COG_C, present in two genomes, it can be inferred that the corresponding gene pairs are fragments of a longer, possibly ancestral array COG_A–COG_B–COG_C. However, this type of reconstruction may be rendered erroneous by the presence of paralogs in some of the COGs. If, in the pairs COG_A–COG_B and COG_B–COG_C from two different genomes, COG_B is represented by paralogs, there might be no direct evolutionary or functional connection between these gene strings. Thus, in order to ensure the evolutionary relevance of merging pairs COG_A–COG_B and COG_B–COG_C, the presence of the array COG_A–COG_B–COG_C in at least one genome was required. Accordingly, among the reconstructed arrays, all those with three genes are necessarily represented in the gene order in at least one genome (with possible one to two gene inserts, given the above relaxed definition of a gene pair), whereas larger arrays may or may not be directly represented in any genome.
The problem of array reconstruction can be formalized as search of a trail in a digraph in which each conserved gene (COG) pair is represented by two vertices connected with an edge (Fig. 3). The search for maximal trails in these graphs is an NP-complete problem due to the presence of circuits, which precludes the use of dynamic programming. Therefore a recursive algorithm for finding maximal trails was developed (see Materials and Methods) and the program EM_TRAILS implementing this algorithm was used to reconstruct 1280 gene arrays. Among these, 337 arrays were present in one or more genomes, whereas the remaining 943 arrays were not represented in any of the genomes in their entirety. That a substantial majority of gene arrays were not detected in any actual genomes was an expected feature of the procedure employed, which involved searching for arrays of maximal length.
Figure 3.

A cluster of gene arrays presented as a directed graph. Nodes correspond to COGs, the COG numbers are indicated inside the circles. The edges show conserved gene pairs and the direction of transcription of the corresponding genes is shown by arrows. The blue circles and red arrows show the depicted cluster. The open circles and black arrows show genes and gene pairs that are linked to individual COGs in the given cluster, but did not join it under the procedure employed. The number of genomes in which the given pair is represented is given for each edge, and the thickness of the edge is roughly proportional to this number. This example shows cluster 14. The rank of the cluster (neighborhood) in this and other figures was determined by the descending order of the number of genes (COGs) in the core cluster as shown in Table 1. COG0130, pseudouridine synthase; COG0184, ribosomal protein S15P/S13E; COG0195, transcription elongation/anti-termination factor (NusA); COG0196, FAD synthase; COG0532, translation initiation factor 2 (GTPase); COG0612, predicted Zn-dependent peptidase; COG0779, uncharacterized conserved protein; COG0858, ribosome-binding factor A; COG1185, polyribonucleotide nucleotidyltransferase; COG2740, uncharacterized conserved protein.
Clusters of gene arrays and gene neighborhoods. The procedure discussed above resulted in numerous, overlapping gene arrays, which is explained by the pervasiveness of local gene rearrangements, even in generally conserved operons, in prokaryotic genome evolution. In order to merge all arrays that are parts of the same genomic neighborhood, we used single-linkage clustering, which produced 188 gene clusters, with the number of arrays in a cluster varying from 464 to 1, the number of COGs varying from 79 to 2 (neighborhoods with only two COGs were found because the same COG may be represented twice in an array), and the number of species involved varying from 31 (all analyzed genomes) to 3 (the minimal number of genomes that was required to recognize a conserved gene pair). Of the 2890 COGs used in this analysis, 1001 (~35%) were represented in clusters of gene arrays. Figure 4 shows the distribution of the clusters by the number of genes and species they include. The number of clusters decays steeply with the increase of the gene number, with several large clusters forming the tail of the distribution (Fig. 4A). The distribution of the number of clusters by the number of genomes represented is quite different, with a clear maximum at eight genomes (the number of analyzed archaeal species) and additional, local maxima at 13 genomes (not readily interpretable; these clusters include variable sets of bacterial and archaeal genomes) and 23 genomes (the complete number of analyzed bacterial species). Thus, this distribution, at least in part, reflects a trend toward conservation of distinct gene clusters in specific, major lineages of prokaryotes.
Figure 4.


Distribution of clusters of gene arrays by the number of genes (A) and species (B).
The final step in the reconstruction of connected gene neighborhoods involved projection of clusters of gene arrays onto actual genomes. All unidirectional strings of genes with short spacers (directons) (24) that included COGs comprising the projected cluster were identified in each genome. These directons may be considered first approximations of actual operons (24), which can be refined through case by case analysis. This procedure resulted in the number of genes associated with detected gene neighborhoods increasing from 1001 (number of COGs in clusters; note that the remainder of the 1337 COGs that formed conserved gene pairs did not belong to any of the clusters) to 6611, including 2387 of the 2890 COGs analyzed (~83%). Thus, a substantial majority of highly conserved prokaryotic genes (COGs) are associated with the neighborhoods identified, but for more than half this association appears to be evolutionarily unstable (seen in only one or two genomes) and its functional relevance remains to be investigated.
The approach to the analysis of connected neighborhoods in prokaryotic genomes developed here is related to the über-operon analysis procedure described by Lathe et al. (18) and implemented in the STRING server (27), but more general in that a large collection of genomes was analyzed simultaneously and the neighborhoods were detected comprehensively and automatically.
Connected gene neighborhoods: functional and evolutionary implications. The gene neighborhoods delineated using the protocol described above do not directly represent conservation of gene order in any particular genome and, generally, are not reconstructions of the organization of ancestral genomes, although their composition certainly depends on the level of conservation of gene arrays, of which they are composed. Instead, these neighborhoods comprise more or less complete repertories of links between (predicted) operons that can be revealed by multiple genome comparison. Each neighborhood consists of a core, i.e. the cluster of gene arrays that was used to generate the neighborhood, and the unique additions that belong to the same directons (potential operons) with the core arrays (Table 1; see also ftp://ftp.ncbi.nih.gov/pub/koonin/gene_neighborhoods/clusters.htm). Both the conserved and unique parts of gene neighborhoods are likely to be functionally relevant, but some of the added genes might belong to directons by chance, whereas the relevance of the core clusters is supported by evolutionary conservation of the constituent gene pairs and, in part, arrays (see above). Therefore, in the following discussion, we address genes that belong to the core clusters of the neighborhoods.
Table 1. Gene neighborhoods in prokaryotic genomes (examples)a.
| Rankb | Number of gene arrays | Number of genes (COGs) in the core cluster | Total number of genes | Number of species | Longest array: number of genes (species) | Functional compositionc | Principal function(s): theme(s) | Additional functions: variations |
|---|---|---|---|---|---|---|---|---|
| 1 |
146 |
79 |
574 |
31 |
45 (B.subtilis) |
J=51 K=8 C=4 N=3 F=3 R=2 S=2 D=1 O=1 G=1 E=1 H=1 I=1 |
Translation: ribosomal proteins, translation factors, RNA modification, RNA processing (RNase P), preprotein translocation. Transcription: five RNA polymerase subunits, terminator NusA, antiterminator NusG |
Energy conversion (cytochromes b, c1, Rieske Fe-S protein, lactate dehydrogenase), central metabolism (enolase), nucleotide metabolism (adenylate, citidylate kinases), lipid metabolism (mevalonate kinase), cell division (FtsZ) |
| 2 |
99 |
50 |
805 |
30 |
12 (E.coli, V.cholerae) |
I=15 E=11 R=9 J=4 K=4 L=3 C=3 H=2 S=2 M=1 N=1 P=1 G=1 F=1 |
Lipid metabolism, amino acid metabolism |
Translation (ribosomal proteins L32, S17E; ribosomal protein L11 methylase), transcription (transcriptional regulators), replication (DNA polymerase III δ′ subunit), coenzyme metabolism (O-succinylbenzoate synthase) |
| 5 |
80 |
22 |
236 |
23 |
14 (D.radiodurans, E.coli, M.tuberculosis, N.meningitidis, X.fastidiosa) |
C=16 P=5 S=1 |
Energy conversion, ion transport: NADH:ubiquinone oxidoreductase and multisubunit sodium/proton-antiporter |
None |
| 7 |
1 |
15 |
254 |
23 |
15 (E.coli, V.cholerae) |
M=6 I=4 J=3 L=1 F=1 |
Membrane biogenesis, lipid biosynthesis |
Translation (ribosomal protein S2, ribosome recycling factor, elongation factor Ts), replication (RNase HII), nucleotide metabolism (uridylate kinase) |
| 10 |
4 |
14 |
154 |
18 |
9 (E.coli, P.aeruginosa, V.cholerae) |
G=7 R=3 J=1 K=1 M=1 S=1 |
Carbohydrate metabolism |
Translation (ribosome-associated protein Y/Psrp-1), transcription (RNA polymerase σ54 subunit), membrane biogenesis (sugar phosphate isomerase involved in capsule synthesis) |
| 11 |
2 |
11 |
80 |
14 |
10 (T.maritima, E.coli and several other proteobacteria) |
E=10 J=1 |
Histidine biosynthesis, including histidyl-tRNA synthetase |
Translation (histidyl-tRNA synthetase), but link to histidine biosynthesis is obvious |
| 13 |
5 |
11 |
131 |
19 |
6 (E.coli, P.aeruginosa, V.cholerae) |
R=4 N=2 K=1 L=1 T=1 C=1 H=1 |
Secretion? |
RNA processing (RNase III), DNA repair (RecO) |
| 17 |
7 |
10 |
245 |
25 |
5 (V.cholerae) |
R=6 L=2 P=2 M=1 G=1 E=1 |
Membrane transport |
DNA replication (DNA polymerase III δ subunit) |
| 20 |
1 |
9 |
133 |
22 |
6 (E.coli,, P.aeruginosa, V.cholerae) |
L=3 N=3 J=2 S=1 |
Protein secretion, DNA recombination/repair (Holliday junction resolution) |
tRNA modification (queuine/archaeosine tRNA-ribosyltransferase) |
| 24 | 9 | 9 | 376 | 23 | 4 (many bacteria) | E=4 T=3 K=2 C=1 H=1 R=1 | Amino acid transport, signal transduction (two-component system) | Energy conversion (alcohol dehydrogenase) |
aThe complete information for all 188 neighborhoods is available at ftp://ftp.ncbi.nih.gov/pub/koonin/gene_neighborhoods/.
bThe rank of a neighborhood is determined by the descending order of the number of COGs in the core cluster (third column).
cCodes for functional categories (from the COG database): J, translation, ribosomal structure and biogenesis; K, transcription; L, DNA replication, recombination and repair; D, cell division and chromosome partitioning; O, molecular chaperone functions; M, cell envelope and outer membrane structure and biogenesis; N, cell motility and secretion; P, inorganic ion transport; T, signal transduction; C, energy production and conversion; G, carbohydrate metabolism and transport; E, amino acid metabolism and transport; F, nucleotide metabolism and transport; H, coenzyme metabolism; I, lipid metabolism; R, general functional prediction only (biochemical activity but not biological role predicted); S, function unknown.
The larger neighborhoods include numerous alternative configurations of varying evolutionary stability that have evolved in different lineages. Indeed, by definition, each gene array in a neighborhood is such an alternative gene configuration and some of the larger neighborhoods include over 100 arrays (Table 1; see also ftp://ftp.ncbi.nih.gov/pub/koonin/gene_neighborhoods/clusters.htm). In terms of digraphs, such alternative configurations correspond to distinct trails that share subsets of common vertices (Fig. 3). The large neighborhoods are not represented by a contiguous gene string (array) in any one particular genome; moreover, the longest array typically does not even include the majority of the genes that comprise the neighborhood (Table 1). One COG may belong to two or more neighborhoods, which represent alternative genomic contexts for the given gene. The majority of COGs included in the neighborhoods belong to only one neighborhood, but 106 COGs (11%) were found in two to eight neighborhoods.
Even those parts of a neighborhood that are not directly connected in any particular genome might have similar levels of expression and similar regulatory patterns. Indeed, the ‘tiling’ construction principle of gene arrays suggests a degree of transitivity such that, in a gene array A-B-C-D, where A-B, B-C and C-D are conserved pairs and the triplets A-B-C and B-C-D are present in at least one genome each, some concordance might exist between the expression levels and regulatory patterns of genes A and D, although they never belong to the same operon.
Functionally, the gene neighborhoods tend to show a ‘theme with variations’ pattern: the majority of genes typically belong to the same functional category, whereas the minority encode proteins with different, in some cases unrelated functions (Table 1). This is compatible with the observation that a considerable number of gene pairs, largely those present in a relatively small number of genomes, consist of genes from different functional categories (Fig. 2). Juxtaposition of genes in genomes leading to prediction of previously undetected operons is most often regarded as an opportunity for prediction of the functions of uncharacterized genes on the basis of the notion that genes in the same operon should be functionally connected (15,17,28). The present analysis of gene neighborhoods also offers this possibility. The most notable case of functional prediction produced using this approach, of a novel thermophile-specific DNA repair system, is presented in detail elsewhere (29).
More unexpectedly, however, it was noticed that, on many occasions, the ‘theme’ and ‘variations’ in a neighborhood had no obvious functional links. In such cases, two alternative interpretations seem possible: (i) the genes in the neighborhood only appear to be functionally unrelated whereas in reality the variation genes have additional, as yet undiscovered functions that connect them to the theme; and (ii) although no specific functional connection (such as being parts of the same pathway or functional system) exists between the theme and the variations, the latter gene products are required in roughly the same amounts and under the same conditions as the former, hence the advantage of co-regulation. We call the latter hypothetical phenomenon of co-expression of genes that are not known to be involved in direct functional interactions ‘genomic hitchhiking’, whereby unrelated genes occasionally ‘hitch a ride’, e.g. with highly expressed genes, such as those coding for ribosomal proteins. In the several examples discussed below, we concentrate mostly on the more unexpected phenomenon of apparent genomic hitchhiking, although some functional predictions are also considered.
Ribosomal protein operons, which comprise the largest of the identified neighborhoods (Table 1), often include additional genes coding for proteins that do not appear to be directly functionally linked to translation, ribosomal biogenesis or RNA modification, e.g. central metabolic enzymes such as enolase, and enzymes involved in energy production and conversion such as cytochromes and Fe-S-cluster oxidoreductases (Fig. 5A and B). In each of these cases, the juxtaposition of genes without an apparent functional connection is conserved in a phylogenetically coherent group of microbes (euryarchaeota and a subset of proteobacteria, respectively), which is compatible with a single origin of each of these configurations. Although the evolutionary range of conservation was relatively narrow in each of these cases, the presence of the gene strings in question in multiple genomes could not be explained by chance (see the discussion of Monte Carlo simulations above). Interestingly, it has been shown that E.coli enolase has a second function as a (probable) structural component of the degradosome, a multiprotein complex that contains several RNases and a helicase and has a major role in bacterial RNA degradation (30,31). Although archaea do not have a degradosome and instead appear to possess an evolutionary predecessor of the eukaryotic exosome (32), a role for enolase in archaeal RNA metabolism, which is likely to be directly coupled to translation, cannot be ruled out. Should that be the case (which is currently a purely speculative possibility), the presence of enolase in the same predicted operon with ribosomal proteins would seem to be a borderline case between co-regulation stemming from a direct functional association and genomic hitchhiking because, although RNA degradation and translation might be coupled, ribosomal proteins are not directly involved in the former. In the case of electron-transfer chain enzymes, there is no evidence of a functional connection with translation, so this appears to be a case of genomic hitchhiking that was conserved in proteobacteria due to the selective advantage of high-level expression of the genes for these enzymes, commensurate with the expression level of ribosomal protein genes. This advantage might also extend to a similar pattern of regulation of the expression of ribosomal protein genes and genes for metabolic enzymes by the abundance of metabolites. In contrast, the association of genes for the SspA and SspB proteins, which are involved in stringent starvation response, with ribosomal operons (Fig. 5B) seems to suggest a direct functional connection, which is supported by the ribosomal association of SspB and its role in the degradation of incomplete proteins (33).
Figure 5.

Fragments of the ribosomal protein gene neighborhood 1 containing apparent hitchhiker genes. Colored arrows indicate the COGs that belong to the ribosomal protein gene neighborhood; open arrows indicate inserted genes. (A) The gene for the glycolytic enzyme enolase is part of the ribosomal protein gene cluster in Euryarchaeota. COG0102, large subunit ribosomal protein L13; COG0103, small subunit ribosomal protein S9; COG1644, DNA-directed RNA polymerase, subunit N; COG1758, DNA-directed RNA polymerase, subunit K; COG0148, enolase. (B) Proteobacterial ribosomal protein cluster includes genes for stringent starvation response proteins, which appear to be functionally linked to translation, and genes for electron transfer chain components, probable hitchhikers. COGs absent in (A): COG0723, Rieske Fe-S cluster protein; COG1290, cytochrome b subunit of the bc complex; COG2857, cytochrome c1; COG0625, stringent starvation protein A (glutathione S-transferase); COG2969, stringent starvation protein B; COG0583, transcriptional regulator; COG0327, uncharacterized conserved protein.
Figure 6 shows a gene neighborhood that consists of genes coding for three functionally distinct sets of proteins: (i) three subunits of the Holliday junction resolvasome (RuvABC), (ii) three subunits of protein membrane translocase (SecDF, YajC) and (iii) two distinct forms of a tRNA-modification enzyme, queuine-tRNA-ribosyltransferase (QueA and Tgt). This example illustrates how neighborhoods are held together via a tiling path (compare with the graph representation in Fig. 3). The relevance, in terms of co-regulation, of the juxtaposition of the genes for the tRNA modification enzymes and the genes for translocase subunits is strongly supported by the conservation of this gene arrangement in several bacterial genomes (Fig. 6) and is compatible with the proposal that these genes form an operon in E.coli (34). There is no direct juxtaposition of the genes for resolvasome subunits and those for the translocase subunits in any genome, but the former belong to the same putative operon with the genes for one or both of the queuine-tRNA-ribosyltransferases in distant bacteria, such as Bacillus, Borrelia and Helicobacter. Furthermore, in Bacillus this putative operon also includes translocase subunit (YajC). Thus, the three groups of genes appear to be reliably linked into a genomic neighborhood and might have similar expression patterns. Since there is no indication of any specific functional interactions between the products of the three groups of genes in this neighborhood, it appears likely that the selective advantage of keeping different combinations of these genes in the same operon lies in maintaining approximately the same level and temporal pattern of expression. It is hard to decide, in this case, which group of genes is the ‘driver’ and which one is the ‘hitchhiker’ because the groups of genes are of approximately the same size and there is no single obvious functional theme in the neighborhood. This example illustrates a more equitable relationship between distinct functional groups of genes, perhaps making an association with ‘car-pooling’ more relevant than that with ‘hitchhiking’. The neighborhood also includes an uncharacterized gene (COG0217) that is conserved in all bacteria and is linked to the genes for resolvasome subunits in proteobacteria (Fig. 6). A detailed analysis of the sequences of the proteins in COG0217 failed to detect any relationships with structurally or functionally characterized proteins (E.V.Koonin, unpublished observations). Under the paradigm of context analysis, it might have been predicted that the protein encoded by this gene directly interacts with the resolvasome; however, the common occurrence of apparent genomic hitchhiking in various neighborhoods and in this neighborhood in particular makes this a viable alternative to the direct functional interpretation.
Figure 6.
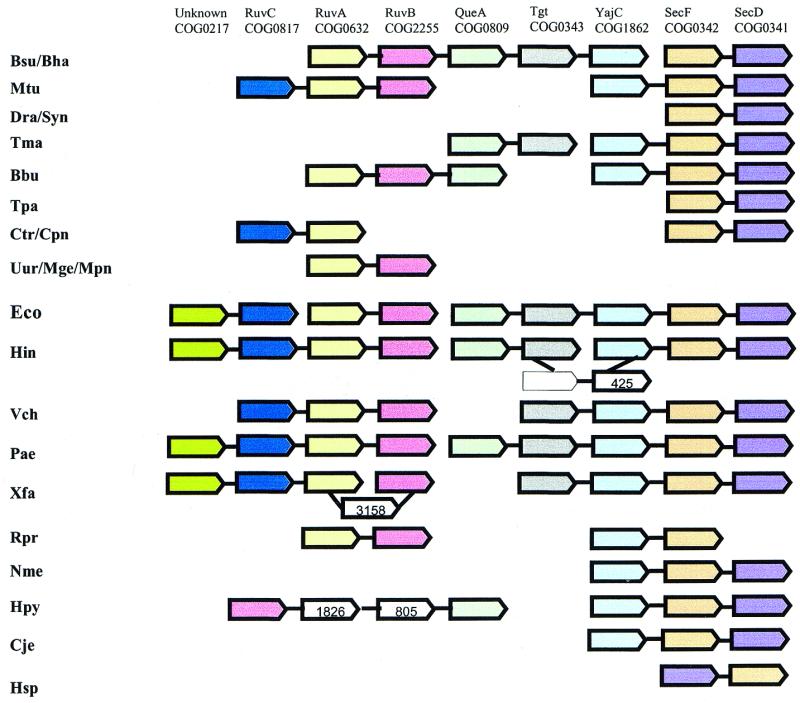
Neighborhood 20: unexpected connection between the Holliday junction resolvasome and protein translocase. COG0217, uncharacterized conserved protein; COG0817, endonuclease subunit of the resolvasome; COG2255, helicase subunit of the resolvasome; COG0809, queuine-tRNA-ribosyltransferase (QueA); COG0343, queuine-tRNA-ribosyltransferase (Tgt); COG1862, COG0342, COG0341, subunits of protein translocase (the Sec complex); COG0425, predicted regulator of disulfide bond formation; COG3158, potassium transporter; COG1826, component of a Sec-independent protein secretion pathway; COG0805, component of a Sec-independent protein secretion pathway.
The neighborhood shown in Figure 7A has a well-defined theme, translation and RNA modification, which is represented by two translation factors, a ribosomal protein and the pseudouridine synthase TruB. The gene for transcription elongation factor NusA and the polynucleotide phosphorylase gene seem to join this theme because, in bacteria, transcription, translation and RNA degradation are coupled, and the advantages of co-regulating the corresponding genes are obvious (35). The gene for an uncharacterized conserved protein (COG0779) is almost inseparable from the nusA gene and, as already predicted previously (10), is likely to be a direct functional partner of NusA. In addition, the neighborhood includes an apparent hitchhiker, the gene for FAD synthase. The association of the FAD synthase gene with this neighborhood is not as tight as the connections between the genes belonging to the theme, but is seen in bacteria from different major lineages, such as two species of Bacillus, T.maritima, D.radiodurans and the mycoplasmas. This pattern is compatible with an ancient fusion that was subsequently disrupted in many bacteria. Notably, in another distinct set of bacterial genomes the FAD synthase gene belongs to another smaller neighborhood, which includes two translation-related genes, those for Ile-RS and a different type of pseudouridine synthase (Fig. 7B). The apparently independent incorporation of the FAD synthase gene in two distinct translation-associated neighborhoods suggests an as yet not understood requirement for tight expressional coupling of this gene with translation system components; the alternative possibility of an unknown second function of FAD synthase, which might be specifically linked to translation, cannot be ruled out either. The neighborhood shown in Figure 7B additionally includes the genes for lipoprotein signal peptidase and two other membrane proteins. In this case, the cause of the association of these genes with those for translation components might be direct coupling between translation and protein secretion.
Figure 7.


Probable gene hitchhiking: independent incorporation of the FAD synthase gene in two translation-related neighborhoods. (A) Neighborhood 14: The list of COGs is as in Figure 3. (B) Neighborhood 50: COG0728, uncharacterized membrane protein; COG0196, FAD synthase; COG0060, isoleucyl-tRNA synthetase; COG0597, lipoprotein signal peptidase; COG1047, FKBP-like peptidyl-prolyl cis–trans isomerase; COG0761, membrane protein, penicillin tolerance determinant.
At face value, the gene neighborhood shown in Figure 8 does not seem to have one or two clearly defined functional themes. However, the presence of a conserved gene module that includes the genes for the phosphate starvation-induced ATPase PhoH, a predicted metal-dependent hydrolase (COG0319) and a CBS domain-containing protein (COG1253) seems to suggest the theme of signal transduction. The secondary theme could be, once again, translation and RNA degradation as suggested by the presence of the genes for the ribosome-associated Era GTPase (36) and RNase III. This neighborhood emerges as a particularly notable example of apparent genomic hitchhiking/car-pooling, with genes of various functions combined in overlapping arrays, possibly reflecting similar patterns of co-regulation. It is also notable that this neighborhood consists of two distinct modules (LepA–PdxJ and FeS-cluster oxidoreductase–CBS domain-containing protein). The two modules are held together by the PhoH–COG1480–COG0319-Era array, which is conserved among Gram-positive bacteria (Fig. 8).
Figure 8.

Apparent operon car-pooling: association of diverse functional themes (neighborhood 13). COG0481, membrane-associated GTPase; COG0681, signal peptidase; COG0571, RNase III; COG1159, ribosome-associated GTPase; COG1381, recombinational repair pathway component; COG0854, enzyme of pyridoxal phosphate biosynthesis; COG0621, 2-methylthioadenine synthetase; COG1702, predicted ATPase involved in phosphate regulon regulation; COG1480, predicted hydrolase of the HD family; COG0319, predicted metal-dependent hydrolase; COG1253, CBS-domain-containing protein; COG0818, diacylglycerol kinase; COG0295, cytidine deaminase.
Developing algorithms for the reconstruction of optimal evolutionary scenarios for the larger genomic neighborhoods identified with the present approach is an extremely complex task (37), which is beyond the scope of the present work. However, for small to moderate size neighborhoods, plausible scenarios can be easily constructed manually. Figure 9 shows such a scenario for neighborhood 14, which is depicted in Figure 7A. Here we postulate that the ancestral form of this neighborhood resembled the most complete version seen in extant genomes, those of the two Bacillus species. Under this assumption, the evolution of this neighborhood in different lines of descent can be easily represented by postulating four types of events: break of gene arrays, gene deletion, gene insertion and rearrangement of arrays (Fig. 9). In this particular scenario, breaks of arrays dominate among the postulated evolutionary events, but this is determined, in part, by our assumption that the ancestral form resembled the largest known array consisting of genes from this neighborhood. If a different ancestral state was assumed, the relative contributions of different types of events could differ substantially.
Figure 9.

A tentative scenario for the evolution of a gene neighborhood. The example analyzed is neighborhood 14, which is shown in Figure 7A. The designations of the genes are as in Figure 7A. The four types of postulated evolutionary events are shown by color-coded circles.
DISCUSSION AND CONCLUSIONS
The comparative genomic approach used in this work was deliberately inclusive and aimed at the detection of large, complex gene neighborhoods. Accordingly, many of the resulting objects are complicated conglomerates of numerous overlapping gene arrays. Most of these arrays, let alone the larger neighborhoods, are not represented in their entirety in any particular genome. The very fact that the neighborhoods detected are branched structures consisting of overlapping gene arrays indicates that they are neither reconstructions of an ancestral gene order nor functional domains (regulons) in any particular genome, although some of the constituent gene arrays might meet each of these objectives. Taken as a whole, each neighborhood represents the repertory of alternative configurations of genes within a distinct gene set, which form various (predicted) operons. Overlapping portions of these neighborhoods are, to a varying extent, conserved during evolution, which confers functional relevance on the entire neighborhoods.
The sets of genes comprising a neighborhood can typically be viewed as a theme with variations in terms of the functions of the encoded proteins (smaller neighborhoods are less likely to include any variations, and in a few neighborhoods it may be difficult to define a clear theme; see Table 1 and above). The theme with variations pattern suggests that there might be more to the evolution of gene order in prokaryotes than selection for co-expression of genes whose functions are directly linked. Some of the selection seems to operate at the level of genomic hitchhiking whereby a gene without a direct functional connection with a particular operon hitches a ride with the operon and the association is maintained due to the advantage of the hitchhiker being expressed at a particular (perhaps most often high) level and under the distinct regulatory pattern characteristic of the given operon. Particularly notable cases of probable genomic hitchhiking include incorporation of genes for metabolic enzymes into operons coding for components of the translation machinery, which are generally characterized by high expression rates. On other occasions, two or more operons may car-pool, with the connection once again being stabilized by selection for similar levels of expression and regulatory patterns. The evolutionarily stable association of apparently unrelated genes in prokaryotic genomes reflects, in part, our ignorance of multiple functions of some of these genes, and in part true hitchhiking/car-pooling effects. It cannot be ruled out that thorough experimental studies on the corresponding proteins and operon expression patterns show that ‘hidden’ functions are more common than hitchhiking. Whatever the outcome, such studies will undoubtedly shed light on our understanding of prokaryotic genome functioning. In the meantime, these observations call for cautious and flexible interpretation of the results of genome context analysis.
Availability of complete results and programs
The complete list of delineated gene neighborhoods, with their projections on each genome, are accessible at ftp://ftp.ncbi.nih.gov/pub/koonin/gene_neighborhoods/. The program EM_TRAILS used for the reconstruction of gene arrays, a detailed description of the algorithm for detecting end-maximal trails and programs used for detection of conserved gene pairs and clustering of gene arrays are available by NSanonymous ftp at the same location. In addition, we provide on the same site the program CLUP for projecting gene clusters onto any genome, for which a list of correspondence between COGs and genes is available (these can be obtained by ftp through the Genome Division of the Entrez system at the NCBI).
REFERENCES
- 1.Jacob F., Perrin,D., Sanchez,C. and Monod,J. (1960) L’Operon: groupe de genes a expression coordonee par un operateur. C. R. Acad. Sci., 250, 1727–1729. [PubMed] [Google Scholar]
- 2.Jacob F. and Monod,J. (1961) Genetic regulatory mechanisms in the synthesis of proteins. J. Mol. Biol., 3, 318–356. [DOI] [PubMed] [Google Scholar]
- 3.Miller J.H. and Reznikoff,W.S.E. (1978) The Operon. Cold Spring Harbor Laboratory Press, Cold Spring Harbor, NY.
- 4.Mushegian A.R. and Koonin,E.V. (1996) Gene order is not conserved in bacterial evolution. Trends Genet., 12, 289–290. [DOI] [PubMed] [Google Scholar]
- 5.Dandekar T., Snel,B., Huynen,M. and Bork,P. (1998) Conservation of gene order: a fingerprint of proteins that physically interact. Trends Biochem. Sci., 23, 324–328. [DOI] [PubMed] [Google Scholar]
- 6.Lawrence J.G. and Roth,J.R. (1996) Selfish operons: horizontal transfer may drive the evolution of gene clusters. Genetics, 143, 1843–1860. [DOI] [PMC free article] [PubMed] [Google Scholar]
- 7.Lawrence J. (1999) Selfish operons: the evolutionary impact of gene clustering in prokaryotes and eukaryotes. Curr. Opin. Genet. Dev., 9, 642–648. [DOI] [PubMed] [Google Scholar]
- 8.Watanabe H., Mori,H., Itoh,T. and Gojobori,T. (1997) Genome plasticity as a paradigm of eubacteria evolution. J. Mol. Evol., 44, S57–S64. [DOI] [PubMed] [Google Scholar]
- 9.Tatusov R.L., Mushegian,A.R., Bork,P., Brown,N.P., Hayes,W.S., Borodovsky,M., Rudd,K.E. and Koonin,E.V. (1996) Metabolism and evolution of Haemophilus influenzae deduced from a whole-genome comparison with Escherichia coli. Curr. Biol., 6, 279–291. [DOI] [PubMed] [Google Scholar]
- 10.Wolf Y.I., Rogozin,I.B., Kondrashov,A.S. and Koonin,E.V. (2001) Genome alignment, evolution of prokaryotic genome organization and prediction of gene function using genomic context. Genome Res., 11, 356–372. [DOI] [PubMed] [Google Scholar]
- 11.Overbeek R., Fonstein,M., D’Souza,M., Pusch,G.D. and Maltsev,N. (1998) Use of contiguity on the chromosome to predict functional coupling. In Silico Biol., 2, 93–108. [PubMed] [Google Scholar]
- 12.Overbeek R., Fonstein,M., D’Souza,M., Pusch,G.D. and Maltsev,N. (1999) The use of gene clusters to infer functional coupling. Proc. Natl Acad. Sci. USA, 96, 2896–2901. [DOI] [PMC free article] [PubMed] [Google Scholar]
- 13.Fujibuchi W., Ogata,H., Matsuda,H. and Kanehisa,M. (2000) Automatic detection of conserved gene clusters in multiple genomes by graph comparison and P-quasi grouping. Nucleic Acids Res., 28, 4029–4036. [DOI] [PMC free article] [PubMed] [Google Scholar]
- 14.Kolesov G., Mewes,H.W. and Frishman,D. (2001) SNAPping up functionally related genes based on context information: a colinearity-free approach. J. Mol. Biol., 311, 639–656. [DOI] [PubMed] [Google Scholar]
- 15.Galperin M.Y. and Koonin,E.V. (2000) Who’s your neighbor? New computational approaches for functional genomics. Nat. Biotechnol., 18, 609–613. [DOI] [PubMed] [Google Scholar]
- 16.Huynen M., Snel,B., Lathe,W. and Bork,P. (2000) Exploitation of gene context. Curr. Opin. Struct. Biol., 10, 366–370. [DOI] [PubMed] [Google Scholar]
- 17.Huynen M., Snel,B., Lathe,W.,III and Bork,P. (2000) Predicting protein function by genomic context: quantitative evaluation and qualitative inferences. Genome Res., 10, 1204–1210. [DOI] [PMC free article] [PubMed] [Google Scholar]
- 18.Lathe W.C.,III, Snel,B. and Bork,P. (2000) Gene context conservation of a higher order than operons. Trends Biochem. Sci., 25, 474–479. [DOI] [PubMed] [Google Scholar]
- 19.Tatusova T.A., Karsch-Mizrachi,I. and Ostell,J.A. (1999) Complete genomes in WWW Entrez: data representation and analysis. Bioinformatics, 15, 536–543. [DOI] [PubMed] [Google Scholar]
- 20.Tatusov R.L., Koonin,E.V. and Lipman,D.J. (1997) A genomic perspective on protein families. Science, 278, 631–637. [DOI] [PubMed] [Google Scholar]
- 21.Tatusov R.L., Natale,D.A., Garkavtsev,I.V., Tatusova,T.A., Shankavaram,U.T., Rao,B.S., Kiryutin,B., Galperin,M.Y., Fedorova,N.D. and Koonin,E.V. (2001) The COG database: new developments in phylogenetic classification of proteins from complete genomes. Nucleic Acids Res., 29, 22–28. [DOI] [PMC free article] [PubMed] [Google Scholar]
- 22.Yellen J. and Gross,J.L. (1998) Graph Theory and its Applications. CRC Press, Boca Raton, FL.
- 23.West D.B. (2001) Introduction to Graph Theory, 2nd Edn. Prentice Hall, New York.
- 24.Salgado H., Moreno-Hagelsieb,G., Smith,T.F. and Collado-Vides,J. (2000) Operons in Escherichia coli: genomic analyses and predictions. Proc. Natl Acad. Sci. USA, 97, 6652–6657. [DOI] [PMC free article] [PubMed] [Google Scholar]
- 25.Ermolaeva M.D., White,O. and Salzberg,S.L. (2001) Prediction of operons in microbial genomes. Nucleic Acids Res., 29, 1216–1221. [DOI] [PMC free article] [PubMed] [Google Scholar]
- 26.Wolf Y.I., Rogozin,I.B., Grishin,N.V., Tatusov,R.L. and Koonin,E.V. (2001) Genome trees constructed using five different approaches suggest new major bacterial clades. BMC Evol. Biol., 1, 8. [DOI] [PMC free article] [PubMed] [Google Scholar]
- 27.Snel B., Lehmann,G., Bork,P. and Huynen,M.A. (2000) STRING: a web-server to retrieve and display the repeatedly occurring neighbourhood of a gene. Nucleic Acids Res., 28, 3442–3444. [DOI] [PMC free article] [PubMed] [Google Scholar]
- 28.Huynen M.A. and Snel,B. (2000) Gene and context: integrative approaches to genome analysis. Adv. Protein Chem., 54, 345–379. [DOI] [PubMed] [Google Scholar]
- 29.Makarova K.S., Aravind,L., Grishin,N.V., Rogozin,I.B. and Koonin,E.V. (2002) A DNA repair system specific for thermophilic archaea and bacteria predicted by genomic context analysis. Nucleic Acids Res., 30, 482–496. [DOI] [PMC free article] [PubMed] [Google Scholar]
- 30.Py B., Higgins,C.F., Krisch,H.M. and Carpousis,A.J. (1996) A DEAD-box RNA helicase in the Escherichia coli RNA degradosome. Nature, 381, 169–172. [DOI] [PubMed] [Google Scholar]
- 31.Kuhnel K. and Luisi,B.F. (2001) Crystal structure of the Escherichia coli RNA degradosome component enolase. J. Mol. Biol., 313, 583–592. [DOI] [PubMed] [Google Scholar]
- 32.Koonin E.V., Wolf,Y.I. and Aravind,L. (2001) Prediction of the archaeal exosome and its connections with the proteasome and the translation and transcription machineries by a comparative-genomic approach. Genome Res., 11, 240–252. [DOI] [PMC free article] [PubMed] [Google Scholar]
- 33.Levchenko I., Seidel,M., Sauer,R.T. and Baker,T.A. (2000) A specificity-enhancing factor for the ClpXP degradation machine. Science, 289, 2354–2356. [DOI] [PubMed] [Google Scholar]
- 34.Reuter K., Slany,R., Ullrich,F. and Kersten,H. (1991) Structure and organization of Escherichia coli genes involved in biosynthesis of the deazaguanine derivative queuine, a nutrient factor for eukaryotes. J. Bacteriol., 173, 2256–2264. [DOI] [PMC free article] [PubMed] [Google Scholar]
- 35.Lupski J.R. and Godson,G.N. (1989) DNA–DNA and DNA–RNA–protein: orchestration by a single complex operon. Bioessays, 10, 152–157. [DOI] [PubMed] [Google Scholar]
- 36.Sayed A., Matsuyama,S. and Inouye,M. (1999) Era, an essential Escherichia coli small G-protein, binds to the 30S ribosomal subunit. Biochem. Biophys. Res. Commun., 264, 51–54. [DOI] [PubMed] [Google Scholar]
- 37.Pevzner P.A. (2000) Computational Molecular Biology. An Algorithmic Approach. MIT Press, Cambridge, MA.