

Abstract
Objective:
To demonstrate bioequivalence and safety for a ready-to-use room-temperature liquid-stable glucagon administered subcutaneously (SC) through a glucagon autoinjector (GAI) or a glucagon vial and syringe kit (GVS), versus a glucagon prefilled syringe (G-PFS).
Methods:
Healthy adults (N = 32) were randomly assigned to receive 1-mg glucagon as GAI or G-PFS, and then as the alternative three to seven days later. Other healthy adults (N = 40) were randomly assigned to receive 1-mg glucagon as GVS or G-PFS, and then as the alternative two days later. Samples for plasma glucagon were obtained through 240 minutes after glucagon injection. Bioequivalence was declared when the geometric mean estimate ratio of the area under-the-concentration-versus-time curve from 0 to 240 minutes (AUC0-240) and maximum concentration (Cmax) for plasma glucagon between treatment groups was contained within the bounds of 80% and 125%. Adverse events (AEs) were recorded.
Results:
The 90% confidence intervals (CIs) for AUC0-240 and Cmax geometric mean ratios for G-PFS to GAI and GVS to G-PFS were contained within the bounds 80% to 125% (G-PFS:GAI AUC0-240 95.05%, 119.67% and Cmax 88.01%, 120.24%; GVS:G-PFS AUC0-240 87.39%, 100.66% and Cmax 89.08%, 106.08%). At least one AE occurred in 15.6% (5/32) participants with GAI, 25% (18/72) with G-PFS, and 32.5% (13/40) with GVS. Sixty-nine of 73 (94.5%) AEs were mild, and none were serious. Nausea was the most common (33/73 [45%]).
Conclusions:
Bioequivalence and safety were established after 1 mg of this ready-to-use room-temperature liquid-stable glucagon, administered SC to healthy adults, by autoinjector, prefilled syringe, or vial and syringe kit.
Keywords: glucagon, glucagon autoinjector, glucagon bioequivalence, glucagon prefilled syringe, hypoglycemia, ready-to-use glucagon
Introduction
Rescue glucagon is indicated for the treatment of persons with diabetes who have level 2 hypoglycemia (blood glucose < 54 mg/dL) or who have severe hypoglycemia (level 3 hypoglycemia; assistance needed). 1 In 2019, US Food and Drug Administration (FDA) approved a ready-to-use, room-temperature, liquid-stable glucagon formulation for treatment for severe hypoglycemia (Gvoke Package Insert, Xeris Pharmaceuticals, Inc., 2019). This formulation is available as single doses for subcutaneous (SC) administration in a glucagon autoinjector (GAI, Gvoke HypoPen), in a glucagon prefilled syringe (G-PFS, Gvoke PFS), and as a ready-to-use glucagon vial and syringe kit (GVS, Gvoke Kit). The GAI has been shown to be noninferior to lyophilized glucagon emergency kit in restoring plasma glucose after insulin-induced hypoglycemia in adults with type 1 diabetes.2,3 However, G-PFS and GVS have not been similarly evaluated. To obviate concerns for any differences in pharmacokinetics (PK) and pharmacodynamics (PD) of this glucagon among delivery methods, primary objectives of these two, phase 1 studies were to demonstrate glucagon bioequivalence, with 1-mg glucagon as GAI versus G-PFS and as GVS versus G-PFS, and to determine safety and tolerability.
Methods
Each study was a randomized, controlled, open-label, two-sequence, two-way crossover study that included healthy persons. To determine eligibility, screening (eg, history, physical examination, clinical chemistry) occurred between 1 and 14 days before first study treatment visit (day 0). First and second treatment visits for GAI versus G-PFS (study A) were three to seven days apart, whereas first and second treatment visits for GVS versus G-PFS (study B) were two days apart. Study A was performed before study B. Follow-up telephone calls occurred one to three days after completing the second treatment visit or at time of early termination, to elicit safety and tolerability problems.
Studies were conducted in accordance with current FDA regulations, Good Clinical Practices guidelines, Good Laboratory Practices guidelines, Belmont Principles, and local ethical and regulatory requirements. Study protocols and amendments and informed consent forms were approved by an Institutional Review Board before participant enrollment. Participants provided written informed consent prior to study procedures.
Study Participants and Designs
Participants, investigators, and clinical research centers (CRCs) differed between studies. For both, key inclusion criteria were healthy males and females aged 18 to 64 years and with body mass index of 18.5 to 29.9 kg/m2. Because these studies were phase 1 studies, healthy adults were selected as participants. Key exclusion criteria were having type 1 or type 2 diabetes; serum creatinine >3.0 mg/dL; serum alanine aminotransferase or aspartate aminotransferase activities ≥ 3 times upper limit of normal; serum albumin < 3.0 g/dL; hematocrit ≤ 30%; arterial blood pressure < 90 or > 150 mm Hg; or history of pheochromocytoma, insulinoma, or hypersensitivity to glucagon or glucagon-like products.
Study A: GAI versus G-PFS
Participants arrived at the CRC the day before each scheduled treatment visit and were given a standard meal. Participants remained at the CRC overnight and were instructed to fast for ≥ 10 hours, ingesting nothing but water and any prescription medications after midnight. The next morning before treatment, capillary blood samples were collected to confirm glucose ranged 70 to 120 mg/dL. If not, treatment visit was rescheduled ≥ 3 days later. Otherwise, participants were eligible for continuing.
Participants were randomly assigned to treatment sequence: GAI or G-PFS at the first treatment visit, and alternative treatment at the second. Treatments were administered SC to the abdomen (near umbilicus). For consistency, study-site members attempted to ensure the same member performed all injections. At study end, participants received a snack comprising slowly absorbed carbohydrates and were discharged from the CRC when glucose > 70 mg/dL and participants appeared medically stable.
Study B: GVS versus G-PFS
Protocol for the GVS versus G-PFS study was similar except participants remained at the CRC for study duration (four days). Participants were randomly assigned to treatment sequence: GVS or G-PFS for the first treatment, and then alternative treatment for the second. At study end, participants received a standard meal and, when deemed as clinically stable, were permitted to leave the CRC.
Study Drug
Ready-to-use, room-temperature, liquid-stable glucagon formulation comprised synthetic glucagon peptide dissolved in dimethyl sulfoxide solvent and trehalose (excipient). Glucagon was filled into a 1-mL, long Crystal Zenith cyclic olefin polymer (plastic) syringe. The prefilled syringe was loaded into a Molly single-dose, disposable autoinjector packaged in a sealed polyfoil pouch (GAI). A prefilled syringe alone was similarly packaged (G-PFS). Vial and syringe kit (GVS) consisted of a glass vial with glucagon and a modified insulin syringe (had custom markings).
Blood Samples
Plasma glucagon was determined from blood samples collected up to 15 minutes before treatment (time 0) and then 10, 20, 30, 45, 60, 90, 120, 180, and 240 post-treatment. In study A, plasma glucose was determined immediately before each treatment (average glucose for two samples considered as time 0), every 5 minutes for 45 minutes, and then 60, 90, 120, 180, and 240 minutes post-treatment. Plasma samples were stored at −70°C and sent in batches to a bioanalytical laboratory for glucagon determination through liquid chromatography-tandem mass spectrometry. Plasma samples for glucose were submitted to a local hospital laboratory. Pharmacokinetic and PD parameters included area under-the-concentration-versus-time curve from time 0 to 240 minutes (AUC0-240; combined linear-logarithmic trapezoidal methods), and from inspection of each participant’s plasma concentration-time profiles, maximum concentration (Cmax) and time to Cmax (tmax). Clearance (CL/F), volume of distribution (Vext/F), and half-life (t1/2) were determined for glucagon after GAI or G-PFS (study A). Pharmacokinetic and PD parameters were calculated with Phoenix WinNonlin v8.0 or higher (Certara USA, Inc., Princeton, NJ).
Primary Endpoint
Primary endpoint for each study was to demonstrate AUC0-240 and Cmax for 1-mg glucagon as GAI or GVS was bioequivalent to 1-mg glucagon as G-PFS after SC administration in the abdomen.
Secondary Endpoints
Secondary endpoints were to compare tmax for 1-mg glucagon as GAI versus G-PFS or GVS versus G-PFS and determine PK for 1-mg glucagon as GAI or G-PFS classified by those who identified as African American, Hispanic, or non-Hispanic white. Also for GAI versus G-PFS, other secondary endpoints included plasma glucose AUC0-240, Cmax, and tmax.
Safety
Local tolerability
Participants enrolled in study A, GAI versus G-PFS, used a Visual Analog Scale (VAS) to assess injection site discomfort at 10 ± 5 and 30 ± 5 minutes plus 240 ± 5 minutes after glucagon only if VAS at 30 ± 5 minutes > 0 mm. Participants completed Injection Site Discomfort Description and Duration Questionnaire at 10 ± 5 minutes after glucagon. If discomfort continued after 10 minutes, the questionnaire was repeated to document final duration for discomfort.
Participants enrolled in study B, GVS versus G-PFS, self-reported scores for Numerical Rating Scale for Injection Site Discomfort at 10 ± 2 and 240 ± 5 minutes after glucagon. Score of zero indicated no discomfort and 10 indicated maximum discomfort.
Investigators used a modified Draize scale 4 to assess erythema and edema formation at injection sites at 10 ± 5 and 30 ± 5 minutes after GAI or G-PFS or at 30 ± 5 and 240 ± 5 minutes after GVS or G-PFS. Erythema and edema scores each ranged from 0 to 4; 0 indicated no erythema or edema and 4 indicated severe erythema or edema. Injection site with score > 0 for erythema or edema at 30 minutes after GAI or G-PFS was re-evaluated for erythema and edema at 240 ± 5 minutes. If any score remained > 1 at 240 minutes, participants could leave the CRC but were instructed to contact CRC staff if erythema or edema persisted.
Statistical Analysis
Sample size
Minimum sample size of 32 participants allowed > 80% power to establish equivalent PK and PD responses when glucagon was administered as GAI or G-PFS. Sample size was based on standard deviation (SD) 0.41, correlation between GAI and G-PFS 0.45, and ratio of geometric mean (X 100%) glucagon AUC0-240 for the two treatments between 80% and 125%, bounds for bioequivalence. Study GVS versus G-PFS also required 32 participants, but the aim was to enroll 40 due to possible dropout. Sample size was calculated with R software v3.1.1 (The R Foundation, Vienna, Austria).
Primary endpoint
Plasma glucagon AUC0-240 and Cmax for GAI (study A) or GVS (study B) were used to determine bioequivalence to G-PFS. Natural log transformation was applied to raw data before analysis. For AUC assessments, 0.05 ng/mL—50% of quantitation limit (0.10 ng/mL) for glucagon assay—was used in calculations for values below quantitation limit or were missing at time 0 or 240 minutes after treatment. Other missing values were not substituted. Mixed-effects models were used to compare differences between GAI and G-PFS and between GVS and G-PFS. For study A, models included terms for treatment, period, and treatment by period as fixed effects, participant as random/repeated factor, and weight and age as covariates. For study B, models included terms for period, sequence, and treatment as fixed effects and subject nested within sequence as random effect. The 90% confidence interval (CI) was estimated for ratio G-PFS AUC0-240:GAI AUC0-240 or for ratio GVS AUC0-240:G-PFS AUC0-240. Bioequivalence was established when the 90% CI was within bounds 80% and 125%. Similarly, bioequivalence was established when the 90% CI for ratio G-PFS Cmax:GAI Cmax or for ratio GVS Cmax:G-PFS Cmax was contained within the same bounds. Analyses were performed with SAS v9.4 (SAS Institute Inc., Cary, NC).
Data were summarized by descriptive statistics including mean (arithmetic and geometric), SD, and minimum, median, and maximum values. For study A, descriptive statistics classified by treatment sequence—GAI and then G-PFS, or G-PFS and then GAI—were also determined.
Secondary endpoints
Secondary endpoints comprised plasma glucagon tmax for both studies; plasma glucose AUC0-240, Cmax, and tmax for study A (GAI versus G-PFS); and, for study A, plasma glucagon Cmax, tmax, and AUC0-240 stratified by ethnicities/races: African American, Hispanic, and non-Hispanic white. Mixed-effects models were used to compare PK and PD. Analyses and reporting for the primary endpoint were applied for the secondary endpoints except data from both GAI and G-PFS were pooled for ethnicity/race analysis.
Results
Study A: GAI Versus G-PFS
Participants
Participants’ (N = 32) mean (SD) age was 44.6 (12.6) years and mean (SD) body weight was 74.7 (14.2) kg (Table 1). Sixteen (50%) participants identified as female, nine (28%) as African American, and 13 (41%) as Hispanic or Latino.
Table 1.
Demographics for Participants Enrolled in Each Study: Study A, Glucagon as Autoinjector (GAI) Versus Glucagon as Prefilled Syringe (G-PFS); Study B, Glucagon as Vial and Syringe Kit (GVS) Versus G-PFS.
| Demographic | Statistic | GAI vs G-PFS (N = 32) | GVS vs G-PFS (N = 40) |
|---|---|---|---|
| Age, y | Mean (SD) | 44.6 (12.6) | 39.3 (10.6) |
| Height, cm | Mean (SD) | 170.9 (9.5) | 172.6 (9.1) |
| Body weight, kg | Mean (SD) | 74.7 (14.2) | 75.4 (10.3) |
| Category | No. (%) of participants | ||
| Sex | Female | 16 (50) | 17 (42.5) |
| Male | 16 (50) | 23 (57.5) | |
| Race | Black or African American | 9 (28.1) | 19 (47.5) |
| White | 23 (71.9) | 21 (52.5) | |
| Ethnicity | Hispanic or Latino | 13 (40.6) | 6 (15) |
| Non-Hispanic or non-Latino | 19 (59.4) | 34 (85) | |
Pharmacokinetics
Mean plasma glucagon AUC0-240 and Cmax were similar between treatments (Table 2; Figure 1). Ratios of geometric mean estimates for AUC0-240 and Cmax had 90% CIs within bounds 80% to 125%, thereby satisfying bioequivalence criteria. Mean plasma glucagon tmax was similar between treatments. The 90% CIs for G-PFS/GAI for other glucagon parameters—CL/F, Vext/F, and t1/2—were between 80% and 125% (Table 3).
Table 2.
Plasma Glucagon Pharmacokinetic Parameters AUC0-240 and Cmax—the Primary Study Endpoints—and tmax—a Secondary Study Endpoint—After Glucagon as GAI or G-PFS (Study A; N = 32 Participants Each), or as GVS or G-PFS (Study B; N = 40 Participants Each). For AUC0-240, 90% CIs for the Geometric Mean Estimates for G-PFS/GAI or GVS/G-PFS X 100% Indicated Bioequivalence When They Were Between 80% and 125%. Similarly, for Cmax, 90% CIs for G-PFS/GAI or GVS/G-PFS X 100% Indicated Bioequivalence When They Were Between 80% and 125%.
| PK parameter | Study A | Study B | ||
|---|---|---|---|---|
| AUC0-240 (ng∙min/mL) | GAI | G-PFS | GVS | G-PFS |
| Geometric mean estimate (SE) | 166.4 (1048.2) | 177.4 (1117.9) | 161.4 (–) | 172.0 (–) |
| G-PFS/GAI | GVS/G-PFS | |||
| Ratio of geometric mean estimates (SE [%]) | 106.65 (7.2) | 93.79 (–) | ||
| Ratio 90% CI (%) | 95.05, 119.67 | 87.39, 100.66 | ||
| Cmax (ng/mL) | GAI | G-PFS | GVS | G-PFS |
| Geometric mean estimate (SE) | 2.1 (15.7) | 2.1 (16.1) | 2.0 (–) | 2.1 (–) |
| G-PFS/GAI | GVS/G-PFS | |||
| Ratio of geometric mean estimates (SE [%]) | 102.87 (9.44) | 97.54 (–) | ||
| Ratio 90% CI (%) | 88.01, 120.24 | 89.08, 106.08 | ||
| tmax (min) | GAI | G-PFS | GVS | G-PFS |
| Geometric mean estimate (SE) | 37.0 (255.7) | 39.9 (275.4) | 37.8 (–) | 39.3 (–) |
– = not determined.
Abbreviations: PK, pharmacokinetics; AUC, area under-the-concentration-versus-time curve; GAI, glucagon autoinjector; G-PFS, glucagon prefilled syringe; GVS, glucagon vial and syringe kit; SE, standard error; CI, confidence interval.
Figure 1.

Mean plasma glucagon and glucose concentrations from 0 to 240 minutes after subcutaneous administration of glucagon in an autoinjector (GAI) or in a prefilled syringe (G-PFS; study A).
Abbreviations: GAI-BG, plasma glucose for participants administered glucagon as GAI; GAI-PK, plasma glucagon for participants administered glucagon as GAI; G-PFS-BG, plasma glucose for participants administered glucagon as G-PFS; G-PFS-PK, plasma glucagon in participants administered glucagon as G-PFS.
Table 3.
Additional Plasma Glucagon Pharmacokinetic Parameters—Clearance (CL/F), Volume of Distribution (Vext/F), and Half-Life (t1/2)—After Glucagon as GAI or G-PFS in Study A. These Parameters Were not Determined After Glucagon as GVS or G-PFS in Study B. Bioequivalence was Confirmed When 90% CIs of Geometric Mean Estimates for G-PFS/GAI X 100% were Between 80% and 125%.
| Geometric mean estimate (SE) CL/F (mL/min) | |
|---|---|
| GAI | G-PFS |
| 6011.3 (37 875.4) | 5636.3 (35 513.0) |
| G-PFS/GAI (%; 90% CI) | |
| 93.76 (6.35; 83.57, 105.20) | |
| Geometric mean estimate (SE) Vext/F (mL) | |
| GAI | G-PFS |
| 1996.3 (31 136.3) | 1625.4 (25 351.0) |
| G-PFS/GAI (%; 90% CI) | |
| 81.42 (14.46; 60.21, 110.10) | |
| Geometric mean estimate (SE) t1/2 (min) | |
| GAI | G-PFS |
| 38.3 (181.0) | 35.5 (167.6) |
| G-PFS/GAI (%; 90% CI) | |
| 92.61 (5.40; 83.88, 102.26) | |
Abbreviations: GAI, glucagon autoinjector; G-PFS, glucagon prefilled syringe; GVS, glucagon vial and syringe kit; CI, confidence interval; SE, standard error.
Plasma glucagon AUC0-240 and Cmax analyzed by treatment sequence were greater after treatment sequence GAI and then G-PFS (mean [SD] AUC0-240, 199.7 [64.5] ng.min/mL; mean [SD] Cmax, 2.7 [1.2] ng/mL), than after treatment sequence G-PFS and then GAI (AUC0-240, 173.2 [62.7]; Cmax, 2.1 [1.0]; Table 4).
Table 4.
Mean (SD) Plasma Glucagon Pharmacokinetic (PK) Parameters and Plasma Glucose Pharmacodynamic (PD) Parameters Determined by Analysis by Treatment Sequence: (1) GAI and then G-PFS, or (2) G-PFS and then GAI (Study A).
| Plasma glucagon PK parameter | GAI → G-PFS (N = 16) | G-PFS → GAI (N = 16) |
|---|---|---|
| AUC0-240 (ng∙min/mL) | 199.7 (64.5) | 173.2 (62.7) |
| Cmax (ng/mL) | 2.7 (1.2) | 2.1 (1.0) |
| tmax (min) | 38.7 (9.7) | 44.3 (16.3) |
| CL/F (mL/min) | 5932.4 (2545.4) | 6866.6 (2503.9) |
| Vext/F (mL) | 2637.1 (2657.8) | 4077.8 (4724.0) |
| t1/2 (min) | 37.6 (12.1) | 39.8 (12.9) |
| Plasma glucose PD parameter | GAI → G-PFS (N = 16) | G-PFS → GAI (N = 16) |
| AUC0-240 (mg∙min/dL) | 27 329.0 (5386.1) | 25 882.9 (1772.6) |
| Cmax (mg/dL) | 178.9 (35.1) | 169.0 (21.5) |
| tmax (min) | 50.7 (16.6) | 49.9 (10.6) |
Abbreviations: GAI, glucagon autoinjector; G-PFS, glucagon prefilled syringe; AUC, area under-the-concentration-versus-time curve.
Plasma glucagon AUC0-240, Cmax, and tmax were summarized by ethnicity/race (Table 5). Comparison of plasma glucagon revealed approximately 25% lower glucagon AUC0-240 and Cmax in those who identified as African American than in those who identified as Hispanic and non-Hispanic white. Comparison of plasma glucagon tmax revealed < 7% difference among groups. Graph of each participant’s plasma glucagon AUC0-240 versus body weight by group suggested that as body weight increased, AUC0-240 decreased (Figure 2). Body weight did not clinically significantly affect overall inferential bioequivalence analyses.
Table 5.
Arithmetic Mean (SD) Plasma Glucagon Pharmacokinetic Parameters Classified by Ethnicity/Race After Glucagon as GAI and G-PFS (Study A).
| Parameter | African American (n = 9) | Hispanic (n = 13) | Non-Hispanic white (n = 10) |
|---|---|---|---|
| AUC0-240 (ng∙min/mL) | 144.7 (56.2) | 206.3 (59.5) | 198.3 (64.1) |
| Cmax (ng/mL) | 1.90 (1.17) | 2.75 (1.20) | 2.45 (0.85) |
| tmax (min) | 43.3 (17.5) | 41.2 (14.0) | 40.3 (9.4) |
Abbreviations: GAI, glucagon autoinjector; G-PFS, glucagon prefilled syringe; AUC, area under-the-concentration-versus-time curve.
Figure 2.
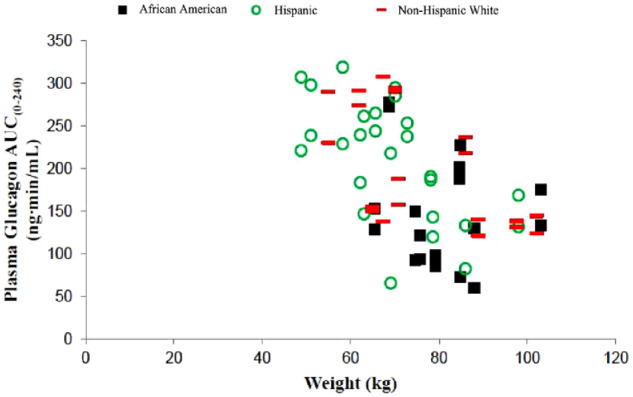
Plasma glucagon AUC0-240 versus body weight by ethnicity/race after subcutaneous administration of glucagon in an autoinjector (GAI) or in a prefilled syringe (G-PFS; study A). African American, n = 9; Hispanic, n = 13; non-Hispanic white, n = 10.
Abbreviation: AUC, area under-the-concentration-versus-time curve.
Pharmacodynamics
Geometric mean estimate plasma glucose AUC0-240, Cmax, and tmax were similar between treatments (Table 6). Through visual inspection of a dot plot for each participant’s plasma glucose AUC0-240 result versus plasma glucagon AUC0-240 result after GAI or G-PFS, various plasma glucagon AUC0-240 results yielded similar plasma glucose AUC0-240 results (Figure 3). Evaluated by treatment sequence, plasma glucose AUC0-240 and Cmax were lower with G-PFS and then GAI (mean [SD] AUC0-240, 25 882.9 [1772.6] mg.min/mL; Cmax, 169.0 [21.5] mg/mL) than with GAI and then G-PFS (AUC0-240, 27 329.0 [5386.1] mg.min/mL; mean [SD] Cmax, 178.9 [35.1] ng/mL; Table 4).
Table 6.
Secondary Endpoints of Plasma Glucose Pharmacodynamic Parameters AUC0-240, Cmax, and tmax for GAI versus G-PFS (Study A). The 90% CIs for the Geometric Mean Estimates of G-PFS/GAI X 100% Indicated Bioequivalence When They Were Between 80% and 125%.
| Parameter, geometric mean estimate (SE) | GAI | G-PFS | G-PFS/GAI (%; 90% CI) |
|---|---|---|---|
| AUC0-240 (mg∙min/dL) | 26 441.3 (63 907.2) | 26 178.8 (63 273.0) | 99.01 (1.67; 96.22, 101.88) |
| Cmax (mg/dL) | 173.7 (527.5) | 169.3 (514.3) | 97.5 (1.8; 94.5, 100.5) |
| tmax (min) | 47.8 (242.1) | 47.8 (242.2) | 100.01 (90.19, 110.91) |
Abbreviations: AUC, area under-the-concentration-versus-time curve; GAI, glucagon autoinjector; G-PFS, glucagon prefilled syringe; CI, confidence interval; SE, standard error.
Figure 3.

Plots for each participant in study A (GAI versus G-PFS) for plasma glucose AUC0-240 versus plasma glucagon AUC0-240 after glucagon as GAI or G-PFS.
Abbreviations: GAI, glucagon autoinjector; G-PFS, glucagon prefilled syringe; AUC, area under-the-concentration-versus-time curve.
Study B: GVS Versus G-PFS
Participants
Participants’ (N = 40) mean (SD) age was 39.3 (10.6) years and mean (SD) body weight was 75.4 (10.3) kg (Table 1). Seventeen (42.5%) participants identified as female, 19 (47.5%) as black or African American, and 6 (15%) as Hispanic or Latino.
Pharmacokinetics
Mean plasma glucagon AUC0-240 and Cmax were slightly lower after GVS than after G-PFS (Table 2). Ratios of geometric mean estimates for AUC0-240 and Cmax had 90% CIs within bounds 80% to 125%, thereby satisfying bioequivalence criteria. Differences in tmax between treatments were small.
Safety and Tolerability
Study A: GAI versus G-PFS
At least one AE was experienced by 15.6% (5/32) participants with GAI and 9.4% (3/32) with G-PFS (Table 7). Most common was nausea for GAI (n = 5 [15.6%]) and G-PFS (3 [9.4%]). All AEs were considered related to treatment, and 12 of 16 (75%) were mild and four (25%) were moderately severe. No deaths, serious AEs, nor discontinuations due to AEs were reported.
Table 7.
Treatment-Emergent AEs (TEAEs) Observed in Bioequivalence Study A, GAI Versus G-PFS, and in Bioequivalence Study B, GVS Versus G-PFS.
| Incidence of TEAEs | GAI vs G-PFS (N = 32) | GVS vs G-PFS (N = 40) | ||||||
|---|---|---|---|---|---|---|---|---|
| GAI | G-PFS | GVS | G-PFS | |||||
| No. (%) affected participants | No. events | No. (%) affected participants | No. events | No. (%) affected participants | No. events | No. (%) affected participants | No. events | |
| At least one TEAE | 5 (15.6) | 10 | 3 (9.4) | 6 | 13 (32.5) | 22 | 15 (37.5) | 35 |
| Gastrointestinal disorders | 5 (15.6) | 6 | 3 (9.4) | 5 | 12 (30.0) | 15 | 14 (35.0) | 21 |
| Nausea | 5 (15.6) | 5 | 3 (9.4) | 3 | 11 (27.5) | 11 | 14 (35.0) | 14 |
| Vomiting | 1 (3.1) | 1 | 2 (6.3) | 2 | 2 (5.0) | 3 | 3 (7.5) | 5 |
| Diarrhea | – | – | – | – | 1 (2.5) | 1 | 2 (5.0) | 2 |
| General disorders | 1 (3.1) | 1 | 0 | 0 | 4 (10.0) | 4 | 8 (20.0) | 9 |
| Asthenia | – | – | – | – | 2 (5.0) | 2 | 2 (5.0) | 2 |
| Fatigue | – | – | – | – | 0 | 0 | 2 (5.0) | 2 |
| Feeling hot | – | – | – | – | 1 (2.5) | 1 | 1 (2.5) | 1 |
| Vessel puncture site swelling | – | – | – | – | 1 (2.5) | 1 | 0 | 0 |
| Hyperhidrosis | 1 (3.1) | 1 | 0 | 0 | 0 | 0 | 4 (10.0) | 4 |
| Nervous system disorders | 3 (9.4) | 3 | 1 (3.1) | 1 | 2 (5.0) | 2 | 2 (5.0) | 2 |
| Dizziness | 1 (3.1) | 1 | 0 | 0 | 2 (5.0) | 2 | 2 (5.0) | 2 |
| Postural dizziness | 1 (3.1) | 1 | 0 | 0 | – | – | ||
| Headache | 1 (3.1) | 1 | 1 (3.1) | 1 | – | – | ||
| Vascular disorders | – | – | – | – | 1 (2.5) | 1 | 3 (7.5) | 3 |
| Flushing | – | – | – | – | 1 (2.5) | 1 | 2 (5.0) | 2 |
| Hot flush | – | – | – | – | 0 | 0 | 1 (2.5) | 1 |
– = not reported.
Abbreviations: GAI, glucagon autoinjector; G-PFS, glucagon prefilled syringe; GVS, glucagon vial and syringe kit.
The VAS for injection site discomfort was > 0 mm for one participant at 10 minutes after G-PFS, not at another time after G-PFS nor at any time after GAI. The VAS returned to 0 mm at 30 minutes. This same participant at 10 minutes after G-PFS reported pain, itching, and tingling, twitching, or numbness. The VAS scores did not significantly differ between treatments at 10 minutes (P = .32). Participants after GAI, versus G-PFS, had higher incidence of erythema and edema at 10 and 30 minutes (Table 8).
Table 8.
Summary of Erythema and Edema Scores Determined With Modified Draize Scales After GAI, G-PFS, or GVS (10 ± 5 and 30 ± 5 Minutes After GAI or G-PFS [Study A; N = 32] or at 30 ± 5 and 240 ± 5 Minutes After GVS or G-PFS [Study B; N = 40]). Any Injection Site With a Score > 0 for Erythema or Edema at 30 Minutes (GAI Versus G-PFS) was Re-Evaluated for Both Erythema and Edema at 240 ± 5 Minutes.
| Erythema | Edema | ||||||||
|---|---|---|---|---|---|---|---|---|---|
| Study A No. (%) of participants | Study B No. (%) of participants | Study A No. (%) of participants | Study B No. (%) of participants | ||||||
| Time (min) | Scale | GAI | G-PFS | GVS | G-PFS | GAI | G-PFS | GVS | G-PFS |
| 10 | 0 | 20 (62.5) | 25 (78.1) | NP | NP | 22 (68.8) | 26 (81.3) | NP | NP |
| 1 | 7 (21.9) | 4 (12.5) | NP | NP | 5 (15.6) | 5 (15.6) | NP | NP | |
| 2 | 3 (9.4) | 3 (9.4) | NP | NP | 3 (9.4) | 0 | NP | NP | |
| 3 | 2 (6.3) | 0 | NP | NP | 2 (6.3) | 1 (3.1) | NP | NP | |
| 4 | 0 | 0 | NP | NP | 0 | 0 | NP | NP | |
| 30 | 0 | 22 (68.8) | 26 (81.3) | 19 (47.5) | 13 (32.5) | 25 (78.1) | 26 (81.3) | 28 (70) | 28 (70) |
| 1 | 10 (31.3) | 6 (18.8) | 17 (42.5) | 16 (40) | 6 (18.8) | 6 (18.8) | 11 (27.5) | 7 (17.5) | |
| 2 | 0 | 0 | 4 (10) | 10 (25) | 0 | 0 | 0 | 4 (10) | |
| 3 | 0 | 0 | 0 | 1 (2.5) | 1 (3.1) | 0 | 1 (2.5) | 1 (2.5) | |
| 4 | 0 | 0 | 0 | 0 | 0 | 0 | 0 | 0 | |
| 240 | 0 | 32 (100) | 32 (100) | 38 (95) | 33 (82.5) | 29 (90.6) | 32 (100) | 40 (100) | 39 (97.5) |
| 1 | 0 | 0 | 2 (5) | 7 (17.5) | 2 (6.3) | 0 | 0 | 1 (2.5) | |
| 2 | 0 | 0 | 0 | 0 | 1 (3.1) | 0 | 0 | 0 | |
| 3 | 0 | 0 | 0 | 0 | 0 | 0 | 0 | 0 | |
| 4 | 0 | 0 | 0 | 0 | 0 | 0 | 0 | 0 | |
Score 0, no erythema or edema; 1, very slight erythema or edema; 2, well-defined (study A) or slight (study B) erythema or edema; 3, moderate erythema or edema; 4, severe erythema or edema.
Abbreviations: GAI, glucagon autoinjector; G-PFS, glucagon prefilled syringe; GVS, glucagon vial and syringe kit; NP, not performed.
Study B: GVS versus G-PFS
At least one AE was experienced by 32.5% (13/40) participants with GVS and 37.5% (15/40) with G-PFS (Table 7). Most common was nausea for GVS (n = 11 [27.5%]) and G-PFS (14 [35.0%]). All 57 AEs were mild and 54 were considered related to treatment. No deaths, serious AEs, nor discontinuations due to AEs were reported.
Ten minutes after GVS or G-PFS, scores were similar for Numerical Rating Scale for Injection Site Discomfort (mean, 1.4; range, 0-9 [0, no discomfort; 10, maximum discomfort]). At 240 minutes, scores were similar between GVS (mean, 0.2; range, 0-2) and G-PFS (0.3; range, 0-2).
Incidence of erythema 30 and 240 minutes after G-PFS was higher than after GVS, whereas incidence of edema after G-PFS or GVS was similar. Incidence of erythema at 30 minutes after G-PFS was higher in study B (27/40 [68%]) than in study A (6/32 [19%]); incidence of edema at 30 minutes after G-PFS was likewise higher (study B, 12/40 [30%]; study A, 6/32 [19%]).
Discussion
Results from these two, two-way crossover bioequivalence studies indicated criteria were met for primary endpoint of bioequivalence, based on plasma glucagon AUC0-240 and Cmax, for GAI and G-PFS (study A) or for GVS and G-PFS (study B). Likewise, achieved were secondary endpoints of glucagon tmax for both studies and plasma glucose AUC0-240, Cmax, and tmax for study A.
Plasma glucagon Cmax and tmax were similar after GAI between healthy adults in the present study and adults with diabetes in two phase 3 studies. 2 However, plasma glucagon AUC0-240 in study A was approximately six times that in one of those phase 3 studies. 2 Also in study A, plasma glucagon AUC0-240 and Cmax were lower after sequence G-PFS and then GAI, than after GAI and then G-PFS. In addition, plasma glucagon AUC0-240 was slightly lower after GVS than after G-PFS in study B. Causes are unknown for these differences. Importantly, lower glucagon AUC0-240 did not yield lower plasma glucose response, based on visual inspection of a dot plot of each participant’s plasma glucose AUC0-240 versus plasma glucagon AUC0-240. Rather, various plasma glucagon AUCs yielded similar plasma glucose AUCs.
Plasma glucose AUC0-240 and Cmax were proportionally (to AUC from 0 to 90 minutes; AUC0-90) or numerically (Cmax) similar between healthy adults after GAI and adults with diabetes after GAI in three, phase 3 studies.2,3 However, tmax occurred approximately 70 minutes earlier in study A after GAI or G-PFS, than tmax for adults with type 1 diabetes after GAI2,3; but tmax variability was high in study A. Lower plasma glucagon AUC0-240 suggests different absorption and elimination between these healthy adults and adults with type 1 diabetes and may be the causes for tmax difference. Contrarily, geometric mean glucose tmax occurred at approximately 49 minutes in adults with type 1 diabetes, 5 similar to tmax approximately 48 minutes in healthy adults in study A, after SC administration of the same glucagon formulation, but at approximately one-tenth dose and through automated insulin delivery. Therefore, variable absorption and elimination may instead be person specific, rather than specific to a population of healthy adults or of adults with diabetes.
Subgroup analyses for study A (GAI versus G-PFS) by ethnicity/race revealed participants who identified as African American had lower plasma glucagon exposure. This finding is most likely explained by higher body weight among those participants but should be interpreted cautiously because of the small sample size (n = 9). Additional similar analyses were not performed by ethnicity/race and body weight for study B (GVS versus G-PFS)—and post-hoc analysis was not possible owing to how study data were recorded—nor for studies with other injectable formulations of glucagon.5,6 One phase 3 study for this liquid-stable glucagon formulation includes glucagon PK parameters among participants by ethnicity/race. 2 But only four persons identified as African American and graphed results for glucagon concentration versus time yielded similar curves among African American, Hispanic, and non-Hispanic white populations. 2 Yet, in study A, various plasma glucagon AUCs did not affect plasma glucose AUCs, so clinical significance is most likely low for lower glucagon exposure in those who identify as African American. A 1-mg dose of this liquid-stable glucagon is FDA-approved for all adults, regardless of ethnicity/race (Package Insert; Gvoke HypoPen, Gvoke PFS, and Gvoke Kit; Xeris Pharmaceuticals, Inc., 2021).
Overall, GAI, G-PFS, and GVS were well tolerated. Nausea was the most common AE regardless of delivery method, consistent with the formulation2,3 and other formulations.5,6 Erythema and edema, although common, were most often very slight. Most AEs were mild; none were severe nor serious. No participants discontinued studies due to AEs.
Conclusions
Bioequivalence between GAI and G-PFS and between GVS and G-PFS was demonstrated in healthy adults through plasma glucagon AUC0-240 and Cmax and plasma glucose AUC0-240, Cmax, and tmax. Most AEs were mild, commonly nausea.
Acknowledgments
The authors acknowledge Martin Cummins for conceptualization and project administration and Richard S. Perry, PharmD, paid by Xeris Pharmaceuticals, Inc., for editorial assistance, for the Gvoke PFS versus Gvoke HypoPen study. In addition, the authors acknowledge David Sequeira, PhD, for investigation and supervision for both studies.
Footnotes
Abbreviations: AE, adverse event; AUC, area under-the-concentration-versus-time curve; AUC0-90, area under-the-concentration-versus-time curve from 0 to 90 minutes; AUC0-240, area under-the-concentration-versus-time curve from 0 to 240 minutes; CL/F, apparent clearance; Cmax, maximum concentration; CI, confidence interval; CRC, clinical research center; GAI, glucagon autoinjector; G-PFS, glucagon prefilled syringe; GVS, glucagon vial and syringe kit; PD, pharmacodynamics; PK, pharmacokinetics; SC, subcutaneous; t1/2, half-life; tmax, time to maximum concentration; VAS, Visual Analog Scale; Vext/F, apparent volume of distribution.
Author Contributions: M. Khaled Junaidi, MD, and Valentina Conoscenti, MD, as representatives of the sponsor, contributed to the conception, design, analysis, interpretation, drafting, revision, and final approval of the manuscript. Matthew R. Krecic, DVM, MS, MBA, contributed to the interpretation, drafting, revision, and final approval of the manuscript. Nicole C. Close, PhD, created the statistical plan, performed statistical analyses, and contributed to the interpretation, drafting, revision, and final approval of the manuscript.
The author(s) declared the following potential conflicts of interest with respect to the research, authorship, and/or publication of this article: M. Khaled Junaidi, Matthew R. Krecic, and Valentina Conoscenti are full-time employees of Xeris Pharmaceuticals, Inc. Nicole C. Close was a consultant of Xeris Pharmaceuticals, Inc., at the time of this study.
Funding: The author(s) disclosed receipt of the following financial support for the research, authorship, and/or publication of this article: Xeris Pharmaceuticals, Inc.
ORCID iD: Matthew R. Krecic  https://orcid.org/0000-0002-9383-5415
References
- 1. El Sayed N, Aleppo G, Aroda VR, et al. ; American Diabetes Association. 6. Glycemic targets: standards of care in diabetes – 2023. Diabetes Care. 2023;46(Suppl 1):S97-S110. doi: 10.2337/dc23-5006. [DOI] [PMC free article] [PubMed] [Google Scholar]
- 2. Christiansen MP, Cummins M, Prestrelski S, Close NC, Nguyen A, Junaidi K. Comparison of a ready-to-use liquid glucagon injection administered by autoinjector to glucagon emergency kit for the symptomatic relief of severe hypoglycemia: two randomized crossover non-inferiority studies. BMJ Open Diabetes Res Care. 2021;9(1):e002137. doi: 10.1136/bmjdrc-2021-002137. [DOI] [PMC free article] [PubMed] [Google Scholar]
- 3. Pieber TR, Aronson R, Christiansen MP, et al. Efficacy, safety, tolerability, and noninferiority phase 3 study of glucagon as a ready-to-use room temperature liquid stable formulation versus a lyophilized formulation for the biochemical recovery and symptomatic relief of insulin-induced severe hypoglycaemia in adults with type 1 diabetes. Diabetes Obes Metab. 2022;24:1394-1397. [DOI] [PubMed] [Google Scholar]
- 4. Draize JH, Woodard G, Calvery HO. Methods for the study of irritation and toxicity of substances applied topically to the skin and mucous membranes. J Pharmacol Exp Ther. 1944;82(3):377-390. [Google Scholar]
- 5. Castle JR, Youssef JE, Branigan D, et al. Comparative pharmacokinetic/pharmacodynamic study of liquid stable glucagon versus lyophilized glucagon in type 1 diabetes subjects. J Diabetes Sci Technol. 2016;10(5):1101-1107. [DOI] [PMC free article] [PubMed] [Google Scholar]
- 6. Bailey TS, Willard J, Klaff LJ, et al. Dasiglucagon, a next-generation glucagon analogue, for treatment of severe hypoglycemia via an autoinjector device: results of phase 3, randomized, double-blind trial. Diabetes Obes Metab. 2021;23(10):2329-2335. [DOI] [PubMed] [Google Scholar]