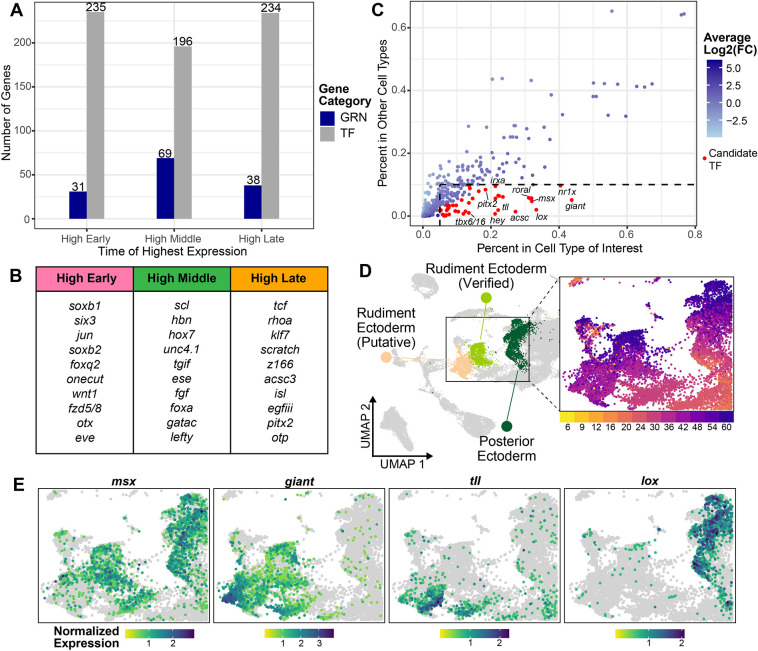
Fig. 8.
Different gene regulatory suites appear to control the development of the larval and adult body plans. (A) Chart showing the number of TFs (gray) and embryonic GRN genes (blue) in the He genome with expression peaks in each temporal category. (B) The top 10 expressed embryonic GRN genes with expression peaks in each temporal category. (C) Plot showing the percentage of cells showing expression of TFs with late peaks in cell types of interest (rudiment ectoderm and posterior ectoderm) versus all other cell types, colored by their average log2-fold change in the cell types of interest (as a measure of enrichment). Points colored red indicate genes with average log2-fold changes >0.9 and that were expressed in >5% of cells in the cell type of interest and <10% of cells in the other cell types. (D) UMAP of He development highlighting the adult rudiment clusters. (E) UMAPs of He development zoomed in on the adult rudiment clusters, colored by expression levels for TFs potentially controlling adult rudiment morphogenesis.

