

Abstract
Background
The interaction between soil characteristics and microbial communities is crucial for poplar growth under different planting densities. Yet, little is understood about their relationships and how they respond to primary environmental drivers across varying planting densities.
Results
In this study, we investigated poplar growth metrics, soil characteristics, and community assembly of soil bacterial and fungal communities in four poplar genotypes (M1316, BT17, S86, and B331) planted at low, medium, and high densities. Our findings reveal that planting density significantly influenced poplar growth, soil nutrients, and microbial communities (P < 0.05). Lower and medium planting densities supported superior poplar growth, higher soil nutrient levels, increased microbial diversity, and more stable microbial co-occurrence networks. The assembly of bacterial communities in plantation soils was predominantly deterministic (βNTI < -2), while fungal communities showed more stochastic assembly patterns (-2 < βNTI < 2). Soil available phosphorus (AP) and potassium (AK) emerged as pivotal factors shaping microbial communities and influencing bacterial and fungal community assembly. Elevated AP levels promoted the recruitment of beneficial bacteria such as Bacillus and Streptomyces, known for their phosphate-solubilizing abilities. This facilitated positive feedback regulation of soil AP, forming beneficial loops in soils with lower and medium planting densities.
Conclusions
Our study underscores the critical role of planting density in shaping soil microbial communities and their interaction with poplar growth. This research carries significant implications for enhancing forest management practices by integrating microbiological factors to bolster forest resilience and productivity.
Supplementary Information
The online version contains supplementary material available at 10.1186/s12870-024-05648-7.
Keywords: Density effect, Microbial community, Soil nutrients, Community assembly, Key taxa
Background
Populus tomentosa are renowned for their rapid growth, high wood yield, ease of hybridization, and genetic enhancement [1]. Studies have indicated that the growth, phenology, and yield of poplar stands are significantly influenced by plantation density—the number of plants planted per unit area, crucial for the rational spatial arrangement of forest populations [2]. Afforestation density plays a pivotal role in forest tree cultivation, impacting resource availability and inter-tree competition patterns in artificial forests [3].
Higher plantation density results in spatial “crowding”, which reduces resource use efficiency and limits individual tree growth. Conversely, lower plantation density decreases tree density per unit area, potentially wasting forest land and reducing stand yield and stability [4]. The essence of optimal plantation density lies in maximizing space utilization within the stand population to achieve high productivity and desired diameter classes.
Optimal plantation density enhances tree potential by efficiently utilizing environmental and nutrient resources, thereby optimizing resource allocation (light, water, nutrients) to individual trees. This optimization promotes tree height, diameter at breast height, wood volume, resistance to adverse conditions, and growth stability, ultimately increasing stand productivity and achieving greater ecological and economic benefits [5].
Soil serves as the primary site for material exchange and energy transfer within ecosystems, facilitating crucial physiological processes such as plant growth, element cycling, and transpiration [6]. Soil type, texture, and structure directly influence the growth and development of trees, thereby impacting both the quality and quantity of wood produced [7]. Several factors within the soil, including water, nutrients, serve as foundational elements essential for tree growth and development. Among these, phosphorus and potassium are critical nutrients that support plant growth and microbial activity, integral to the biogeochemical cycling alongside carbon and nitrogen. Their availability in the soil profoundly affects plant growth and the balance of elemental stoichiometry, which is crucial for sustaining ecosystem services, structure, and functions.
Microbes play a crucial role in soil ecosystems, driving essential processes such as nutrient cycling, organic matter decomposition, alteration of soil structure, suppression of plant diseases, and support of plant productivity [8]. The presence and activity of microbes significantly influence soil structure and hydraulic properties through various mechanisms. Recent research highlights microbes as key agents in soil recovery, capable of fundamentally transforming soil functionality [9]. The composition of the soil microbial community is influenced by forest biomass and tree characteristics, although these effects vary depending on environmental conditions [10]. Plantation density directly impacts the soil microenvironment, affecting factors such as light exposure, temperature, and humidity, which in turn shape the structure and functions of the soil microbial community [11]. Higher plantation densities typically reduce surface light availability and increase soil moisture, intensifying resource competition among microbes. Consequently, some microbial communities may face heightened competitive pressures.
High density plantation affects some factors such as light and humidity in the forest, which in turn affects the growth of potentially pathogenic fungi in soil [12]. It also may hinder the development of photosynthetic bacteria and other light-dependent microorganisms [13, 14]. Thus, understanding how plantation density influences soil microbial dynamics is crucial for managing ecosystem health and productivity in planted forests.
Current research on plantation density primarily focuses on its impact on tree performance, assessing changes in growth, health status, and overall forest productivity in response to varying planting densities [15]. However, there is a noticeable gap in comprehensive studies that examine the complex interactions among plantation density, tree species identity, soil characteristics, and microbial community dynamics. Specifically, there is a lack of systematic investigation into how soil microbial communities adapt to changes in planting density, particularly concerning different genotypes of poplar trees. Furthermore, many studies found cultivable microbial species played a critical role in plant-microbe interactions [16, 17]. Some bacteria contribute to a positive feedback regulation in soil nutrient, further enhancing nutrient availability [18]. Some key cultivable bacterial species were isolated, cultured and tried to apply them to forest soil improvement [19]. However, it’s not clear whether cultivable bacteria change with the density of poplar plantation and what specific roles play in response to alterations in poplar plantation density. This knowledge gap hinders a deeper insight into the mechanisms through which microbial communities influence and are influenced by plantation practices.
In this study, we investigated the changes and interactive relationships among poplar growth, soil characteristics, and key microbial communities across four genotypes of poplar planted at different planting densities. Our aim was to uncover how soil physicochemical factors influence the composition of microbial communities, especially key groups, across different planting densities, and to identify the primary drivers of these relationships. We hypothesized that: (1) Poplar growth, soil physicochemical properties, and the composition and structure of soil microbial communities would exhibit significant effects due to planting density variations. (2) Microbial co-occurrence networks would display more complex relationships in response to different plantation densities, with soil physicochemical factors significantly influencing microbial community composition and assembly processes. (3) Key culturable microbial communities would demonstrate varied feedback responses to different plantation densities. By addressing these hypotheses, we aimed to enhance understanding of how plantation density influences soil microbial dynamics and to elucidate the mechanisms through which soil physicochemical factors shape microbial community structure and function.
Methods
Study site and stands of different densities
The study was conducted at the Weixian Nursery Experimental Forest (115°13’-115°14’E, 36°52’-37°18’N) in Xingtai City, Hebei Province, northern China. This location benefits from a favorable natural environment, situated in the southern part of the North China Plain. The area features a flat terrain and a distinct four-season climate characterized by a warm-temperate continental semi-arid monsoon climate. The annual average precipitation is 584 mm, with an average temperature of 13.4 °C. The coldest month (January) averages − 2.3 °C, with extreme minimum temperatures reaching − 19 °C, while the hottest month (July) averages 26.9 °C, with extreme maximum temperatures reaching 42.5 °C. The frost-free period spans 198 days, and the annual sunshine duration is 2,574.8 h. The experimental site has flat topography and consists of recent alluvial parent material deposited by river sedimentation. The soil is classified as sandy loam and is fertile.
Populus tomentosa (P. tomentosa), a fast-growing native tree species in northern China, is highly esteemed for its rapid growth, high-quality wood, and pleasing aesthetics. It is renowned for its adaptability, making it a preferred choice for timber production, protective plantation, and landscaping in regions such as North China and Northwest China [20]. In this study, we selected four 13-year-old planting density trial established by Beijing Forestry University at Weixian, Hebei Province, China, and established forest plots with low, medium, and high planting densities. The study included four hybrid clones B331, M1316, S86, and BT17 (Table 1). The trials consisted of three triploid hybrid clones (B331, S86, and BT17) and one diploid clone (M1316) in each planting density. The triploid hybrids were created through pollen chromosome doubling. Clone S86, B331, and BT17 were triploid with superior traits. The diploid clone M1316 was a superior tree of Chinese white poplar with a higher growth rate in northern China. Under the premise of the same management level, the experimental forest layout followed a spider-web density trial design, akin to the Nelder system (1962). Each square plot was divided into four equally sized experimental areas along the diagonal. Starting from the center and moving outward, planting density decreased progressively, resulting in high density plots with approximately 2500 trees per hectare, medium density plots with around 1667 trees per hectare, and low-density plots with approximately 1111 trees per hectare.
Table 1.
Identity and origin of the hybrid clones
| No. | Clone Identity | Parents | Level of Ploidy | Sex |
|---|---|---|---|---|
| 1 | B331 | (P. alba × P. glandulosa) × P. tomentosa | Triploid | female |
| 2 | M1316 | P. tomentosa × P. tomentosa | Diploid | male |
| 3 | S86 | (P. tomentosa × P. bolleana) × (P. alba × P. glandulosa) | Triploid | male |
| 4 | BT17 | (P. tomentosa × P. bolleana) × P. tomentosa | Triploid | female |
Growth measurements
The tree height (TH), diameter at breast height (DBH) and the stem wood volume (V) of each tree were measured or calculated fusing the following formula, as specified in the standard issued by the Ministry of Agriculture and Forestry of the People’s Republic of China (LY 208 − 77):
V = 0.000065678245 × DBH1.9410626 × TH0.84929086,
where V represents the volume of each tree in cubic meters (m3); TH denotes the tree height in meters (m); and DBH signifies the diameter in centimeters (cm).
Soil sampling
Soil samples from each genotype were collected uniformly at S-shaped points within low, medium, and high density forest areas. The specific procedure for soil sampling involved removing surface debris with a shovel, sampling within a 0–1 m radius from the tree trunk, and collecting soil from a depth of 5–20 centimeters below the surface. The samples were immediately sieved to remove visible litter, animal residues, stones, and debris, following the method of Richardson and Simpson [21].
A total of 72 soil samples were collected, encompassing three tree densities, four genotypes (S86, B331, BT17, and M1316), two ecological niches (rhizosphere soil, bulk soil), and three replicates for each combination. Each sample was divided into three subsamples: one air-dried for physicochemical property analysis, one stored at 4 °C for microbial isolation, and the third frozen at -80 °C for soil DNA extraction and high-throughput sequencing.
Soil physicochemical parameters
Soil pH and electrical conductivity (EC) were measured using a pH meter and a conductivity meter with a glass electrode in a suspension of 1 g of soil in 5 ml of distilled water. Soil moisture content (SMC) was determined by oven-drying the samples to obtain their dry weight. Various soil properties were measured as follows:
Available phosphorus (AP) using the molybdenum blue method; Available potassium (AK) using flame photometry; Available nitrogen (AN) using the potassium persulfate oxidation method; Total phosphorus (TP) using sulfuric acid-perchloric acid digestion; Total potassium (TK) using hydrofluoric acid-perchloric acid digestion; Total nitrogen (TN) using the Kjeldahl method [22]; Soil organic matter (SOM) and soil organic carbon (SOC) using the dichromate oxidation method [23]. Soil C/N, C/P, and N/P ratios were then calculated [24].
DNA extraction, amplification, and sequencing
Total DNA was extracted from 0.6–0.8 g of soil using the FastDNA® SPIN Kit (MP Biomedicals, Solon, USA) according to the manufacturer’s protocol. The V3–V4 region of bacterial 16S rRNA was amplified using primers 338F (5’-ACTCCTACGGGAGGCAGCA-3’) and 806R (5’-GGACTACHVGGGTWTCTAAT-3’), while the ITS regions of fungi were amplified using primers ITS1F (5’-CTTGGTCATTTAGAGGAAGTAA-3’) and ITS1R (5’-GCTGCGTTCTTCATCGATGC-3’). The purified PCR products were sequenced on the Illumina MiSeq PE300 platform at Guangdong Magigene Biotechnology Co. Ltd. (Guangzhou, China).
Raw sequencing data were assembled and quality-filtered according to literature [25], and chimeric sequences were removed using the QIIME2 tool. The Ribosomal Database Project Classifier tool classified all bacterial sequences (16 S rRNA genes) into different taxonomic groups using the SILVA128 database, while the BLAST tool classified all fungal sequences (ITS1 genes) against the Unite database. Sequences matching archaea, mitochondria, and chloroplasts were removed [26], and the remaining effective sequences were clustered into amplicon sequence variants (ASVs) at 100% similarity. To avoid potential bias caused by differences in sequencing depth, the number of sequences in each sample was rarefied to 90,682 for bacterial 16 S rRNA and 78,082 for fungal ITS1. The raw sequencing data were deposited in the Sequence Read Archive at NCBI with the accession number PRJNA1144091 and were processed.
High-throughput cultivation of soil bacteria and functional characterization
Fresh soil samples were diluted tenfold in 10% Tryptic Soy Broth (TSB) medium (3 g/L TSB, pH 7.0). After determining the optimal dilution gradient, the diluent was dispensed into 96-well cell culture plates, with 160 µL per well. The plates were incubated at 28℃ for 2 weeks, resulting in a colony formation rate of approximately 30% per well [5].
The V5-V7 region of bacterial 16 S rDNA was sequenced using a double-barcode PCR method via Illumina sequencing, enabling the identification and taxonomic annotation of cultivable bacteria. Bacteria in the 96-well plates were identified by amplifying the V5-V7 region using two-step PCR primers with well-specific and plate-specific barcodes. Target strains were selectively cultured and purified on 1/2 Tryptic Soy Agar (TSA) medium [5].
The isolated strains were assessed for their abilities in nitrogen fixation, inorganic phosphorus solubilization, organic phosphorus solubilization, potassium solubilization, iron carrier production, and indole-3-acetic acid (IAA) production. The function of strains was determined by Ashby nitrogen-free medium, potassium-solubilizing medium, inorganic phosphate-solubilizing medium, organic phosphate-solubilizing medium, and CAS assay (for siderophore production) [27–29]. Validation of these isolates was performed through Sanger sequencing using the 27 F and 1492R primers [30, 31].
Statistical analyses
All statistical analyses were performed using RStudio and SPSS. Normality was assessed with the Shapiro-Wilk test, and homogeneity of variances was evaluated using Bartlett’s test. Analysis of variance (ANOVA) was conducted to determine significant differences in multiple comparisons. Alpha-diversity indices were calculated using the “vegan” package in R [32]. Principal component analysis (PCA) based on a Bray-Curtis distance matrix was visualized with the “ggplot2” package, creating 2D graphical outputs [33]. Distance-based redundancy analysis (RDA) was used to assess the relationship between community structure and soil physicochemical properties. The individual effects of each soil factor were examined using the “rdacca. hp” package [34]. Variation partitioning analysis (VPA) was conducted in R 4.0.3 [35]. The “psych” package generated a species correlation matrix and calculated genus correlations based on Spearman analyses [36]. Node and edge files were exported via Gephi for further network mapping and correlation parameter calculations [37].
Microbial community assembly was analyzed using the “NST0,” “picante,” and “ape” packages to calculate βNTI indices, with phylogenetic trees constructed using MEGA7.0 software. The physicochemical properties driving soil microorganisms were analyzed with the “linkET” and “dplyr” packages. The “vegan”, “RandomForest,” and “reshape” packages were used to identify biomarkers and environmental drivers. The correlation network was further mapped using Cytoscape 3.8.2. Linear discriminant analysis and a significance test via linear discriminant analysis effect size (LEfSe) were used to explore the most discriminating genus between treatments [38].
Results
Changes in growth performance and soil physicochemical properties of poplar trees in different density plantations
Plantation density plays a pivotal role in shaping the growth patterns of poplar trees and influencing soil characteristics. The TH, DBH, and V of poplars in low, medium, and high density forest areas are shown in Fig. 1. The differences in these factors were statistically significant (ANOVA, P < 0.05).
Fig. 1.
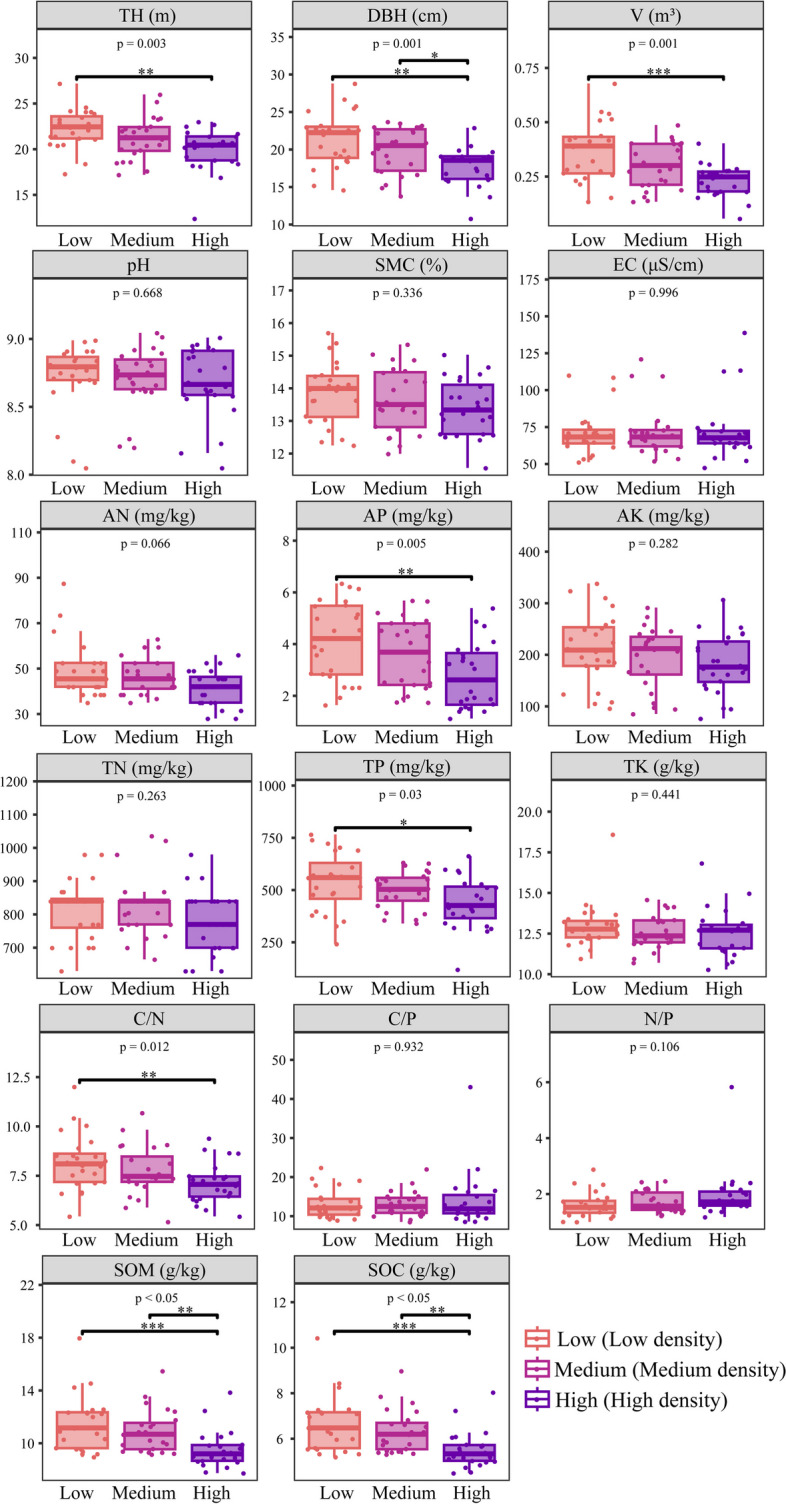
Growth indicators, soil physicochemical properties and stoichiometric characteristics at different densities of poplar. Low: Low density, Medium: Medium density, High: High density, pH: pH (a measure of the acidity or alkalinity of the soil), SMC: Soil Moisture Content, EC: Electrical Conductivity, AN: Available Nitrogen, AP: Available Phosphorus, AK: Available Potassium, TN: Total Nitrogen, TP: Total Phosphorus, TK: Total Potassium, SOM: Soil Organic Matter, SOC: Soil Organic Carbon, C/N: Carbon to Nitrogen Ratio, C/P: Carbon to Phosphorus Ratio, N/P: Nitrogen to Phosphorus Ratio, TH: Tree Height, DBH: Diameter at Breast Height, V: Volume
In the high-density forest, the average height was 22.26 m, DBH was 21.37 cm, and timber volume was 0.37 m³. In the medium density forest, the average height was 21.20 m, DBH was 19.84 cm, and timber volume was 0.30 m³. In the high density forest, the average height was 20.00 m, DBH was 17.69 cm, and timber volume was 0.23 m3. These results indicate that planting density has a significant impact on poplar growth, with TH, DBH, and V values decreasing significantly (P < 0.05) as density increases. The growth parameters for different poplar genotypes (B331, M1316, S86, BT17) in the three density forest areas are shown in Table 2. The differences in these factors within the same density forest area were statistically significant (ANOVA, P < 0.05). Genotype S86 exhibited heights ranging from 21.84 to 24.10 m, DBH from 18.94 to 23.00 cm, and timber volumes from 0.28 to 0.42 m3; genotype BT17 showed heights from 20.84 to 23.26 m, DBH from 18.62 to 25.16 cm, and timber volumes from 0.25 to 0.51 m³. In comparison, genotype M1316 had heights from 18.12 to 20.64 m, DBH from 16.02 to 19.56 cm, and timber volumes from 0.19 to 0.29 m3. Genotype B331 had heights from 18.60 to 21.10 m, DBH from 16.66 to 18.52 cm, and timber volumes from 0.19 to 0.26 m³. Overall, genotypes S86 and BT17 showed better growth performance than M1316 and B331 within the same density forests.
Table 2.
Growth and soil physicochemical factors of different genotypes of poplar in planting density soils
| pH | SMC | EC | AN | AP | AK | TN | TP | ||
|---|---|---|---|---|---|---|---|---|---|
| Low | B331 | 8.79 ± 0.08a | 13.17 ± 0.92b | 68.32 ± 4.48b | 46.08 ± 5.15a | 4.73 ± 1.46a | 211.82 ± 90.07a | 898.33 ± 68.82a | 608.29 ± 87.14ab |
| M1316 | 8.92 ± 0.05a | 14.71 ± 0.67a | 59.93 ± 7.43b | 43.75 ± 4.82a | 4.30 ± 1.79a | 216.50 ± 29.60a | 793.33 ± 84.77ab | 404.40 ± 117.79c | |
| S86 | 8.75 ± 0.09a | 14.16 ± 0.84ab | 65.97 ± 8.08b | 49.00 ± 7.00a | 3.88 ± 1.08a | 250.67 ± 65.74a | 791.33 ± 68.08ab | 657.72 ± 111.79a | |
| BT17 | 8.44 ± 0.34b | 13.43 ± 0.55b | 90.25 ± 18.20a | 57.17 ± 21.65a | 3.52 ± 1.74a | 167.45 ± 66.73a | 774.67 ± 93.57b | 476.10 ± 94.84bc | |
| Medium | B331 | 8.72 ± 0.11ab | 12.56 ± 0.47b | 90.94 ± 25.10a | 41.71 ± 4.48a | 3.676 ± 1.13a | 153.61 ± 64.46b | 754.83 ± 57.45b | 499.41 ± 117.02a |
| M1316 | 8.90 ± 0.13a | 14.33 ± 0.56a | 59.64 ± 4.00b | 49.00 ± 7.34a | 3.99 ± 1.66a | 233.34 ± 9.24a | 920.50 ± 103.42a | 517.93 ± 57.39a | |
| S86 | 8.70 ± 0.09ab | 14.50 ± 0.69a | 65.30 ± 8.23b | 50.17 ± 9.04a | 3.56 ± 1.27a | 220.73 ± 56.52ab | 832.17 ± 25.46ab | 475.18 ± 108.09a | |
| BT17 | 8.53 ± 0.33b | 13.17 ± 0.42b | 71.62 ± 5.34b | 46.08 ± 8.18a | 3.18 ± 1.53a | 174.75 ± 61.31ab | 792.17 ± 67.20b | 501.36 ± 81.93a | |
| High | B331 | 8.75 ± 0.17ab | 13.03 ± 0.59bc | 71.19 ± 3.51a | 37.92 ± 6.03a | 2.79 ± 1.06a | 132.95 ± 49.02b | 793.33 ± 114.31a | 490.26 ± 70.93a |
| M1316 | 8.94 ± 0.05a | 14.09 ± 0.91a | 86.57 ± 39.79a | 37.33 ± 6.88a | 3.34 ± 1.83a | 188.42 ± 30.63ab | 695.33 ± 63.64a | 315.49 ± 111.90b | |
| S86 | 8.63 ± 0.10bc | 13.86 ± 0.48ab | 68.33 ± 4.12a | 43.75 ± 10.56a | 2.41 ± 1.03a | 211.88 ± 40.58a | 821.67 ± 63.06a | 458.73 ± 98.52ab | |
| BT17 | 8.41 ± 0.30c | 12.66 ± 0.59c | 64.81 ± 4.04a | 47.25 ± 3.67a | 2.55 ± 1.11a | 199.00 ± 74.53ab | 805.00 ± 96.49a | 480.03 ± 123.20a |
| TK | SOM | SOC | C/N | C/P | N/P | TH | DBH | V | |
|---|---|---|---|---|---|---|---|---|---|
| Low | 12.65±0.61a | 10.84±1.88a | 6.29±1.09a | 7.05±1.48b | 10.36±1.21b | 1.50±0.20b | 21.10±1.41bc | 18.52±1.91c | 0.26±0.06b |
| 12.32±0.56a | 11.18±1.16a | 6.48±0.67a | 8.19±0.51ab | 17.10±4.45a | 2.10±0.59a | 20.56±1.83c | 19.14±3.16bc | 0.28±0.10b | |
| 13.15±0.59a | 12.34±1.36a | 7.16±0.79a | 9.07±1.00a | 11.04±1.38b | 1.23±0.23b | 24.10±1.67a | 22.66±0.42ab | 0.42±0.02a | |
| 13.85±2.60a | 11.39±3.45a | 6.61±2.00a | 8.45±1.83ab | 13.92±2.79ab | 1.66±0.19ab | 23.26±1.20ab | 25.16±3.29a | 0.37±0.14a | |
| Medium | 11.89±0.40b | 9.91±0.76b | 5.75±0.44b | 7.68±1.16a | 12.11±3.23a | 1.57±0.34a | 18.60±1.09c | 16.66±2.63c | 0.19±0.06c |
| 12.41±0.47b | 11.01±1.47ab | 6.39±0.85ab | 7.03±1.33a | 12.48±2.39a | 1.80±0.34a | 20.64±1.40bc | 19.56±2.94bc | 0.29±0.10bc | |
| 12.19±1.16b | 12.47±1.81a | 7.23±1.05a | 8.69±1.20a | 15.81±3.85a | 1.84±0.49a | 23.28±1.94a | 23.00±0.55a | 0.42±0.04a | |
| 13.94±0.55a | 10.24±1.10b | 5.94±0.64b | 7.53±0.95a | 12.03±1.80a | 1.63±0.38a | 22.24±1.19ab | 20.14±1.77ab | 0.32±0.06b | |
| High | 12.06±1.04a | 9.24±1.17a | 5.36±0.68a | 6.85±1.20a | 11.14±2.28a | 1.64±0.28a | 19.18±0.93bc | 17.18±1.64a | 0.20±0.05a |
| 12.43±0.75a | 9.10±0.49a | 5.28±0.27a | 7.63±0.57a | 19.95±11.59a | 2.64±1.59a | 18.12±3.31c | 16.02±3.51a | 0.19±0.09a | |
| 12.04±0.98a | 10.44±2.29a | 6.06±1.33a | 7.36±1.44a | 13.67±4.31a | 1.85±0.33a | 21.84±1.11a | 18.94±2.38a | 0.28±0.08a | |
| 13.70±2.25a | 9.21±0.81a | 5.34±0.47a | 6.67±0.30a | 11.63±2.70a | 1.75±0.42a | 20.84±0.48ab | 18.62±1.02a | 0.25±0.03a |
Low: Low density, Medium: Medium density, High: High density, pH: pH (a measure of the acidity or alkalinity of the soil), SMC: Soil Moisture Content, EC: Electrical Conductivity, AN: Available Nitrogen, AP: Available Phosphorus, AK: Available Potassium, TN: Total Nitrogen, TP: Total Phosphorus, TK: Total Potassium, SOM: Soil Organic Matter, SOC: Soil Organic Carbon, C/N: Carbon to Nitrogen Ratio, C/P: Carbon to Phosphorus Ratio, N/P: Nitrogen to Phosphorus Ratio, TH: Tree Height, DBH: Diameter at Breast Height, V: Volume
The pH of the poplar plantation forest soil ranged from 8.68 to 8.73, SMC from 13.41 to 13.78%, EC from 71.12 to 72.72 µS/cm, AN from 41.56 to 49.00 mg/kg, TN from 778.83 to 814.42 mg/kg, TK from 12.56 to 12.99 g/kg, AK from 183.06 to 211.61 mg/kg, TP from 436.13 to 536.63 mg/kg, AP from 2.77 to 4.11 mg/kg, SOM from 9.50 to 11.44 g/kg, SOC from 5.51 to 6.63 g/kg, C/N from 7.13 to 8.19, C/P from 13.11 to 14.10, and N/P from 1.62 to 1.97. Among these, AP, TP, C/N, SOM, and SOC were significantly higher (P < 0.05) in low planting density soil compared to high planting density soil (Fig. 1).
Regarding the soils of BT17, M1316, S86, and B331 genotypes (Table 2): genotype S86 exhibited significantly higher contents of AK (227.76 mg/kg), TP (530.54 mg/kg), SOM (11.75 g/kg), and SOC (6.82 g/kg) compared to other genotypes (P < 0.05). Genotype BT17 had the highest concentrations of AN (50.17 mg/kg) and TK (13.83 g/kg). Genotype M1316 showed the highest pH (8.92) and SMC (14.38%). Thus, among the four genotypes, S86 had the highest nutrient content, followed by BT17, while B331 and M1316 had relatively lower nutrient contents.
In general, plantation density significantly impacts both plant growth and soil characteristics. Poplar growth and soil nutrient levels were optimal at low densities. As plantation density increases, both the growth performance of poplar trees and soil nutrient content decrease. Among the genotypes at the same density, S86 and BT17 showed better growth performance compared to M1316 and B331.
Changes in Microbial community composition in planting density soil
The α-diversity of soil bacterial and fungal communities for different poplar genotypes (B331, M1316, S86, BT17) in low, medium, and high density forest areas were calculated (Fig. 2A and D). The results indicate that planting density significantly affects the structure and diversity of bacterial and fungal communities in poplar plantation soils. The Shannon index for the bacterial community (5.22–6.84) is higher than that for the fungal community (2.13–4.46).
Fig. 2.

The diversity and composition of soil microbial communities of different genotypes poplar with varying densities. (A) Shannon index of bacterial communities. (B) Principal Component Analysis (PCA) of bacterial communities. (C) Stacked percentage abundance chart of dominant bacterial phyla and genera. (D) Shannon index of fungal communities. (E) PCA of fungal communities. (F) Stacked percentage abundance chart of dominant fungal phyla and genera. Low: Low density, Medium: Medium density, High: High density
For different planting densities, the Shannon index of both bacterial and fungal communities is highest at medium density, followed by low and high densities. Significant differences are observed in the bacterial communities among the four poplar genotypes at low and medium densities. In low planting density soils, the Shannon index of bacterial communities is B331 (6.62) > S86 (6.60) > M1316 (6.47) > BT17 (6.35). In medium planting density soils, it is BT17 (6.69) > B331 (6.67) > M1316 (6.61) > S86 (6.49).
PCA analysis revealed similarities in soil microbial communities across different poplar genotypes (B331, M1316, S86, BT17) in low, medium, and high planting density forest areas. As shown in Fig. 2B and E, the bacterial and fungal communities for different poplar genotypes in low, medium, and high planting density soils were clustered, indicating significant differences among the four poplar genotypes (P < 0.05) and among different planting density soils (P < 0.05). The influence of density on the bacterial community (R = 0.1492) and fungal community (R = 0.3527) is greater than that of genotype (R = 0.106; R = 0.11).
In the low, medium, and high planting density soils, the predominant bacterial phyla include Proteobacteria (28.17-36.00%), Acidobacteriota (18.49-31.64%), Actinobacteriota (7.19-16.24%), Gemmatimonadota (5.99-9.11%), Chloroflexi (4.39-6.04%), Bacteroidota (4.90-6.04%), and Verrucomicrobiota (3.18-4.35%), among others (Fig. 2C). The dominant bacterial genera include RB41, Rhodococcus, Haliangium, Nordella, Terrimonas, Niastella, Steroidobacter, Bryobacter, Solirubrobacter, Nitrospira, Bacillus, Methylobacterium, Sphingomonas, and Pseudomonas. Potentially beneficial bacteria, such as Rhodococcus (1.60%), Bryobacter (1.80%), Niastella (1.69%), and Terrimonas (2.43%), have a higher relative abundance in low planting density soil. In contrast, Steroidobacter (2.78%) and Bacillus (4.60%) are more abundant in medium planting density soil. Among the four genotypes: The soil of genotype S86 has a higher relative abundance of Bacillus, Sphingomonas, and Terrimonas. BT17 exhibits a higher relative abundance of Rhodococcus and Nordella. M1316 shows a higher relative abundance of Methylobacterium, Pseudomonas, and Niastella.
In the low, medium, and high planting density soils, predominant fungal phyla include Basidiomycota (24.00-30.41%), Ascomycota (19.73-21.41%), Mortierellomycota (17.96-19.49%), Zoopagomycota (2.33-3.56%), Kickxellomycota (1.48-2.63%), Chytridiomycota (0.0005-0.12%), Rozellomycota (0.003-0.027%), Calcarisporiellomycota (0.0024-0.015%), and Mucoromycota (0.0004-0.023%) (Fig. 2F). Dominant fungal genera include Inocybe, Helvellosebacina, Hebeloma, Mycosphaerella, Dactylonectria, Tomentella, Trichoderma, Gibberella, Clitopilus, Penicillium, Remispora, Trichothecium, Pseudogymnoascus, Solicoccozyma, Cladosporium, Alternaria, Talaromyces, etc. Among these genera, Tomentella (2.43%), Hebeloma (5.14%), Clitopilus (1.39%), and Penicillium (1.31%) show higher relative abundance in low planting density soil. Helvellosebacina (10.05%), Remispora (1.45%), Trichothecium (1.70%), Pseudogymnoascus (2.50%), Solicoccozyma (1.33%), Cladosporium (1.96%), Alternaria (1.13%), Talaromyces (2.51%), and Mycosphaerella (4.65%) are more abundant in medium planting density soil. Dactylonectria (5.46%), Inocybe (48.86%), Trichoderma (1.07%), and Gibberella (1.37%) are predominant in high planting density soil.
Regarding genotypes: soil from S86 shows higher relative abundance of Remispora, Solicoccozyma, Trichothecium, and Helvellosebacina. BT17 soil has a higher abundance of Talaromyces. Penicillium and Dactylonectria are enriched in M1316 soil. Tomentella, Gibberella, Clitopilus, Pseudogymnoascus, and Mycosphaerella are enriched in B331 soil.
Effects of environmental factors on microbial communities
Mantel analysis revealed significant correlations between bacterial communities in soils of high planting density forest and environmental factors, including pH, AN, AP, AK, SOM, SOC, EC, and growth indicators such as DBH and V (Fig. 3A). In medium planting density soils, bacterial communities showed significant correlations with AP, AK, TP, SOM, and the N/P ratio, while in high planting density soils, correlations were found with AP, AK, SOM, and SOC (P < 0.05). Fungi in low planting density soils showed significant associations with AN, and those in medium planting density soils correlated with AP, TN, and the N/P ratio (P < 0.05) (Fig. 3E).
Fig. 3.

Effects of soil conditions and poplar growth under different plantation densities on soil microbial communities. (A, E) The correlation between environmental factors and microorganisms was analyzed using Mantel tests. The thickness of the lines represents the magnitude of the correlation, and different colors indicate the significance level (p-value). The upper part corresponds to bacteria, while the lower part corresponds to fungi. (B, F) Redundancy Analysis (RDA) assessed the relationship between soil properties and microbial communities of different genotypes poplar trees under three plantation densities. (C, G) Illustrates the individual effects of each soil property. Different colors indicate the significance levels of p-values. (D, H) VPA determined the proportion of environmental factors explaining changes in microbial community structure. Low: Low density, Medium: Medium density, High: High density
Redundancy analysis (RDA) and the ranking of individual environmental factors identified AP (R² = 0.53) and AK (R² = 0.51) as primary determinants influencing bacterial communities in poplar plantation soils (Fig. 3B and C). Following these, SOM (R² = 0.16), SOC (R² = 0.16), the C/N ratio (R² = 0.16), SMC (R² = 0.13), and TP (R² = 0.09) also influenced bacterial communities significantly. Similarly, AP (R² = 0.56) and AK (R² = 0.36) were key factors affecting fungal communities, followed by TP (R² = 0.24), the N/P ratio (R² = 0.20), SOM (R² = 0.16), SOC (R² = 0.16), the C/P ratio (R² = 0.12), and EC (R² = 0.09) (Fig. 3F and G).
Variance Partitioning Analysis (VPA) quantified the contribution of environmental factors to the structural variation of bacterial and fungal communities (Fig. 3D and H). Soil properties explained 27.96% of the variation in bacterial community structure, with soil nutrients contributing 23.20% and soil elemental stoichiometry characteristics contributing 4.76%. The growth of poplar trees contributed 16.03% to the variation. In fungal communities, soil properties explained 25.55% of the variation, with soil nutrients contributing 21.58%, soil elemental stoichiometry characteristics contributing 3.97%, and the growth of poplar trees contributing 15.70% to the variation.
Co-occurrence network analysis and the evaluation of the microbial assembly process under density effect
The impact of planting density is evident in shaping the complexity and stability of microbial networks (Fig. 4A and B). The low planting density soil microbes exhibits the most intricate network with 615 nodes and 12,321 edges. Additionally, it has the highest average degree (20.03), graph density (0.033), average path length (4.678), and average clustering coefficient (0.647) compared to the other densities. The medium density network shows the highest modularity (0.772), indicative of its “small-world” properties and nonrandom network topology. The high planting density soil microbial network displays the highest number of negative links. Thus, the order of microbial network complexity and stability from highest to lowest is low, medium, high planting density soils.
Fig. 4.

Analysis of soil microbial co-occurrence networks, community assembly and influencing factors in different planting densities. (A) Density forest soil microbial network map at genus level. Co-occurrence patterns of bacterial-fungal interkingdom networks in whole plantation soil, low, medium and high planting density soil. The two colors represent bacteria and fungi, the red line represents positive correlation, the green line represents negative correlation, and the size of the dot represents the height of the degree. (B) Topological parameters of different microbial networks. (C, E) Assembly mechanism of bacterial and fungal communities in soils of different densities. (D, F) Randomforest analyze the environmental factors that drive the assembly of bacterial and fungal communities. Low: Low density, Medium: Medium density, High: High density
Using null models to assess microbial community assembly processes, the weighted microbial community assembly index (βNTI) reveals insights into the roles of determinism and stochasticity in microbial community dynamics (Fig. 4C and E). Bacterial community assembly in density forest soils is predominantly deterministic (βNTI < -2), whereas fungal community assembly is largely stochastic (2 > βNTI > -2). Specifically, bacterial communities are influenced by homogeneous selection (83.33-100%), dispersal limitation (0-16.67%), and undominated processes (0-1.52%). In contrast, fungal communities experience heterogeneous selection (0-1.52%), homogeneous selection (15.15-28.79%), dispersal limitation (54.55-72.72%), and undominated processes (3.03-30.30%).
Further exploration of environmental factors influencing microbial community assembly highlights the critical role of readily available nutrients such as AP, AN, and AK for bacterial communities, whereas AP, AK, SOM, and SOC are crucial for fungal communities (Fig. 4D and F). This underscores the differential responses of bacterial and fungal communities to soil nutrient availability, with AP and AK emerging as primary influencing factors.
Key microbial taxa in low, medium, high planting density soils
Structural Equation Modeling (SEM) identified a significant positive relationship between microbial community composition and plant growth indices (R = 0.21, P < 0.05; Fig. 5A). Specifically, bacteria showed a positive impact (R = 0.6816), while fungi exhibited a negative influence (R = -0.7442) on the microbial community, suggesting that bacteria may play a more positive role in plant growth under varying planting densities. Consequently, we further identified key bacteria crucial to the microbial community (Fig. 5A).
Fig. 5.

Key bacteria taxa in different planting densities. (A) Structural Equation Modeling (SEM) accounting for the relationship between soil environmental properties, microbial community composition and plant growth indices. SOM: Soil Organic Matter, SOC: Soil Organic Carbon, C/N: Carbon to Nitrogen Ratio, C/P: Carbon to Phosphorus Ratio, N/P: Nitrogen to Phosphorus Ratio. (B) LEfSe analysis looked for bacterial species with significant differences in low, medium and high planting density soils. (C) Random forest was used to find bacterial biomarkers. The bubble chart shows the abundance of the Biomarker among the three groups of samples and the bar chart shows the importance of the top 20 genus, and the correlation matrix shows the association between the top 20 genus and environmental factors. (D) Hubs were identified in the co-occurrence network by the concepts of intra-module connectivity (Zi) and inter-module connectivity (Pi). Low: Low density, Medium: Medium density, High: High density
Using a combination of LEfSe (Linear Discriminant Analysis Effect Size), random forest analysis, and microbial network analysis, we identified key bacterial taxa in soils of different planting densities (Fig. 5B, C and D). LEfSe analysis highlighted significant bacterial genera: Ellin6067, Haliangium, SWB02, Flavitalea, Virgisporangium, Caenimonas, Rubrivirga, Flaviaesturariibacter, Geodermatophilus, Phaselicystis, Promicromonospora, Paraburkholderia, Derxia, and Blyi10 were key in low planting density soil; Bacillus, Streptomyces, Aeromicrobium, Actinomadura, Aquabacterium, Agromyces, Pseudonocardia, Actinophytocola, Hirschia, and Conexibacter were prominent in medium planting density soil; Pectobacterium, FFCH5858, Gaiella, and Sorangium were significant in high planting density soil (Fig. 5B).
The random forest machine-learning model identified the top 20 bacterial biomarkers across different planting densities, including Acidibacter, Adhaeribacter, Agromyces, Anaeromyxobacter, Bauldia, Cellulomonas, Comamonas, Dongia, FFCH7168, Iamia, Ilumatobacter, Janthinobacterium, Micromonospora, MND1, Panacagrimonas, Rhodomicrobium, Solirubrobacter, Sphingomonas, Streptomyces, and Tenggerimyces (Fig. 5C).
Furthermore, bacterial hubs within the microbial networks were identified based on their within-module degree (Zi > 2.5) and among-module connectivity (Pi > 0.62) [39]. In low planting density soil, notable hubs included AKYG587, Caenimonas, Segetibacter, OLB13, and E1B-B3-114. Medium planting density soil exhibited 12 hubs, such as Fluviicola, Taibaiella, Carnobacterium, Geomicrobium, Alcaligenes, Phycicoccus, Streptosporangium, Dysgonomonas, Xanthobacter, Turneriella, Georgenia, and Pseudochrobactrum. In high planting density soil, the identified hubs were Gaiella, Pseudomonas, Rhodococcus, Flavobacterium, Altererythrobacter, Virgisporangium, Ilumatobacter, Brevundimonas, Fluviicola, and Pseudoxanthomonas (Fig. 5D).
Response of culturable key bacteria to soil properties under density effect
To investigate how key bacterial taxa respond to planting density in poplar plantations, we employed high-throughput culturing techniques to isolate previously identified key bacterial taxa from planting density soil samples, characterized their functions, and correlated them with environmental factors (Fig. 6). A total of 2,224 bacterial isolates were obtained, and after sequence alignment, 278 distinct Amplicon Sequence Variants (ASVs) were identified, predominantly from Proteobacteria, Actinobacteria, Firmicutes, and Bacteroidetes, encompassing 61 genera (Fig. 6A). Culturable key bacterial genera, as analyzed in Sect. 3.5, included Bacillus, Streptomyces, Caenimonas, Aquabacterium, Micromonospora, and Pseudomonas.
Fig. 6.

Correlation analysis between cultivable key bacteria and environmental factors. (A) Bacterial ASVs obtained through high-throughput cultivation and identification technique, with colors representing genera; the outer bar chart represents the number. (B) Correlation network between cultivable key bacteria and environmental factors identified; red lines indicate positive correlations, while white lines denote negative correlations. (C) Regression analysis between Bacillus and Streptomyces with AP and AK across three planting densities (Low density, Medium density, High density)
To assess how these cultivable key bacteria are influenced by planting density, we constructed a correlation network between these bacteria and environmental factors in density forest soils (Fig. 6B). The results highlighted positive correlations between AP, AK, SOM, and SOC with cultivable key bacteria, whereas C/P and N/P ratios showed predominantly negative correlations. Further analysis focused on significantly strong correlations (P < 0.05, |R| > 0.6), revealing that Bacillus and Streptomyces were significantly positively correlated with AP and AK. Based on these findings, we conducted regression analyses to correlate the relative abundance of Bacillus and Streptomyces with AP and AK content across different planting density soils (Fig. 6C).
Regression analysis indicated that AP exhibited the strongest positive correlation with Bacillus in low planting density soil (R2 = 0.38, P = 0.0013) and with Streptomyces in medium planting density soil (R2 = 0.65, P < 0.001). AK also exerted a strong positive impact on Bacillus and Streptomyces in low planting density soil (R2 = 0.26, P = 0.013; R2 = 0.49, P = 0.00013).
To further investigate the response of key culturable bacteria to planting density, we validated the abilities of strains from key bacterial genera in nitrogen fixation, inorganic phosphate solubilization, organic phosphorus solubilization, potassium solubilization, siderophore production, and IAA production (Table S1). Pseudomonas strains demonstrated proficiency in nitrogen fixation, inorganic phosphate solubilization, organic phosphorus solubilization, potassium solubilization, siderophore production, and IAA production. Bacillus strains exhibited capabilities in nitrogen fixation, as well as inorganic and organic phosphorus solubilization, siderophore production, and IAA production. Streptomyces strains were found to solubilize inorganic and organic phosphorus and produce siderophores. Notably, key culturable strains of Bacillus and Streptomyces, such as Q2 (Bacillus velezensis), Q35 (Bacillus cereus), and Q36 (Streptomyces sp.), all demonstrated the ability to solubilize inorganic phosphorus, with Q35 (Bacillus cereus) and Q36 (Streptomyces sp.) also capable of solubilizing organic phosphorus.
Discussion
Plantation density significantly affects poplar growth, soil physicochemical properties and soil microbial community composition
Density regulation and forest type can profoundly impact various soil environmental factors, including physical properties, nutrient levels, microbial community composition, understory vegetation diversity, and litter decomposition rates [40]. This study demonstrates that planting density significantly influences poplar growth, soil physicochemical properties, and soil microbial community composition and structure. Low density plantation promotes better poplar growth, whereas high density planting tends to stunt growth due to increased competition among trees [3].
Soil physicochemical properties varied significantly with planting density. Compared to high planting density soils, low planting density soils exhibited superior nutrient conditions, with higher levels of available phosphorus (AP), available potassium (AK), soil organic matter (SOM), and soil organic carbon (SOC). Low density plantation creates canopy gaps that enhance light penetration, soil enzyme activity, and forest transpiration, thereby promoting litter decomposition and nutrient cycling [41]. These nutrients are crucial for microbial metabolism and plant growth, indicating that low density plantation fosters a more favorable soil environment for both microbes and plants.
The microbial community composition was also significantly influenced by planting density. Our study revealed that microbial diversity was highest in low and medium planting density soils and lowest in high density plantation. This pattern suggests that different planting densities create distinct microhabitats that influence the structure and function of microbial communities. In low planting density soils, increased nutrient availability and improved soil conditions supported a more diverse and stable microbial community. In contrast, high density plantation reduced the availability of essential nutrients, increased root exudates and plant debris, and created competitive and stressful conditions for microbes [42]. These factors contributed to decreased microbial diversity and altered community composition.
In our study, low and medium planting density soils hosted diverse and functionally rich microbial communities, including beneficial bacteria such as Rhodococcus, Bacillus, Bryobacter, Steroidobacter, and Niastella, as well as beneficial fungi like Tomentella, Hebeloma, Clitopilus, and Penicillium. Rhodococcus is renowned for its biodegradation capabilities and finds extensive applications in environmental pollution control [43]. Steroidobacter, known for nitrogen metabolism, represents a potential key taxon [44]. Bacillus, a common soil probiotic, enhances plant growth and health, with certain species producing antibiotics that inhibit pathogenic microbes [45]. Bryobacter, a member of the Rhizobiaceae family, contributes to nitrogen and carbon cycling, aiding in nutrient cycling, nitrogen fixation, and organic matter decomposition, thus helping to maintain soil nutrient balance and ecological stability [46]. Niastella and Terrimonas play roles in soil carbon and nitrogen cycling, participating in organic matter decomposition and nutrient transformation [47]. Some species of Tomentella are ectomycorrhizal (ECM) fungi, forming symbiotic relationships that enhance nutrient absorption by plants [48]. Clitopilus, a wood-decaying fungus, acts as an endophytic symbiont of Quercus spp. roots, contributing to organic matter decomposition in forests and potentially interacting with the rhizosphere ecosystem, thereby demonstrating potential as a beneficial microbe [49] Penicillium is recognized for its production of enzymes and antibiotics [28]. These genera are pivotal for biodegradation, nitrogen metabolism, and promoting plant growth. Their presence underscores the positive impact of low and medium density plantation on soil microbial communities, promoting soil health and enhancing plant growth.
In contrast, regions with high planting density exhibited higher abundances of potential pathogenic fungi such as Mortierella, Dactylonectria, Inocybe, and Gibberella. Mortierella and Dactylonectria are known pathogens capable of causing crown rot, root rot, stem rot, seedling blight, and head blight in various plants. Gibberella, on the other hand, is a major pathogen responsible for Fusarium head blight in wheat and barley [50, 51]. This suggests that high planting densities may create stressful conditions that favor opportunistic pathogens, leading to a community shift towards potential pathogens. Such shifts could further compromise soil health and hinder plant growth in high density forests.
Planting density effect on soil microbial communities: interactions, stability, and key nutrient drivers
Forest density significantly influences interactions and stability within microbial communities. Different planting densities create diverse environmental conditions that can either promote positive interactions and community stability or foster negative interactions and instability among microbial populations. Crucial nutrients such as available phosphorus (AP) and potassium (AK) play pivotal roles in shaping these microbial communities.
Low density plantations generally provide more space and resources per tree, reducing competition for nutrients, water, and sunlight. This less competitive environment fosters a diverse and stable microbial community. Positive interactions among microbes, such as mutualism and commensalism, are more likely to occur under these conditions. Our study found an abundance of beneficial microorganisms like mycorrhizal fungi and nitrogen-fixing bacteria in low density plantations. Mycorrhizal fungi establish symbiotic relationships with tree roots, enhancing nutrient uptake and tree health. This symbiosis not only supports tree growth but also stabilizes the microbial community by creating a favorable environment for other beneficial microbes. Previous research indicates that such positive interactions can increase microbial diversity and community stability [52]. It could be further investigated that the functional diversity of fungal communities at different planting densities, in particular ECM fungi, and their role in nutrient cycling, isolating key culturable fungi to assess their potential in improving soil health and enhancing plant disease resistance.
In contrast, high density plantation soils create a more competitive and stressful environment for microbial communities, as evidenced by increased negative interactions in their microbial co-occurrence networks. Competition and antagonism among microbes are more prevalent under these conditions, leading to microbial community instability. Soil conditions in high density forests often include soil compaction, reduced aeration, and limited nutrient availability. These stressors favor the proliferation of pathogens that can outcompete beneficial microbes. For instance, high density plantations may experience an uptick in pathogenic fungi such as Fusarium and Phytophthora, known to cause diseases in trees and disrupt soil microbial balance [53].
The correlation analysis between soil microbial communities and environmental factors revealed significant associations between AP and AK with both bacterial and fungal communities. These findings underscored a robust relationship between soil nutrient levels, particularlyphosphorus and potassium, and the composition or abundance of microbial communities. They highlighted the pivotal role of phosphorus and potassium availability in shaping the structure and diversity of microbial communities.
Further investigation into the assembly processes of microbial communities using random forest analysis identified AP, AK, and AN as key drivers of bacterial community assembly, while AP, AK, SOM, and SOC influenced fungal community assembly. Notably, AP and AK emerged as primary influencing factors driving the assembly of the entire microbial community in density forest soil.
The impact of density regulation on cultivable key bacteria and their feedback responses
A total of 2,224 bacterial isolates were cultured from poplar plantation soils, revealing 278 distinct amplicon sequence variants (ASVs) through 16 S rRNA gene sequencing, predominantly from Proteobacteria, Actinobacteria, Firmicutes, and Bacteroidetes phyla. Among these, six genera were identified as key cultivable bacteria: Bacillus, Streptomyces, Caenimonas, Aquabacterium, Micromonospora, and Pseudomonas. Bacillus, Streptomyces, and Pseudomonas were highlighted as key cultivable bacteria due to their significant functionalities. Pseudomonas and Bacillus strains exhibited diverse capabilities, including inorganic phosphorus solubilization, nitrogen fixation, potassium solubilization, and siderophore production, while Streptomyces strains demonstrated abilities in solubilizing both inorganic and organic phosphorus, alongside siderophore production.
The regulation of poplar planting density significantly influenced the composition and functionality of these key cultivable bacteria in soil. We observed positive correlations between AP and AK levels and the abundance of cultivable key bacteria, while C/P and N/P ratios showed negative correlations with most cultivable key bacteria. This suggests that soil nutrient status, particularly the content and elemental ratios, profoundly impacts specific microbial communities. Phosphorus and potassium availability were identified as critical factors limiting the growth of key cultivable microbes, essential for various physiological processes related to plant growth and microbial metabolism [54]. Recent studies, such as those underscored how AP and AK influence microbial community diversity and stability in black loam soils, guiding their phylogeny [55]. This impact extends to ecosystem services such as food production [56], biodiversity conservation, erosion control, and biogeochemical cycling [57].
The negative correlation of C/P and N/P ratios with cultivable key bacteria suggests that high ratios of carbon to phosphorus could limit microbial growth and metabolism. Even under conditions with ample carbon and nitrogen resources, the relative deficiency of phosphorus may restrict microbial utilization of these resources.
Soil microbial communities in plantation ecosystems are known to be influenced by environmental changes [10, 11]. This study revealed distinct feedback responses of microbial communities to varying plantation densities (Fig. 7). In low and medium planting density soils, we observed higher microbial diversity, more stable microbial co-occurrence networks, and a richer presence of potentially beneficial bacteria, fostering strong positive interactions within the microbial community. Specifically, cultivable key bacteria such as Bacillus and Streptomyces were found to thrive in soils with higher available phosphorus (AP) content.
Fig. 7.

Modeling feedback regulation of soil microorganisms on soil nutrients under planting density
Previous studies have highlighted the role of functional microorganisms in soil, contributing to phosphorus solubilization, promoting plant growth, enhancing soil fertility, and facilitating nutrient cycling [54, 57]. Our findings indicate that enriched cultivable strains of Bacillus and Streptomyces genera have the ability to convert insoluble phosphate in the soil into forms readily available for plant uptake. This process increases soil phosphorus content, thereby positively influencing soil fertility and supporting tree growth. Such nutrient cycling enhancement represents a direct feedback response of cultivable key bacteria to changes in planting density.
Conclusion
The density effects of poplar plantations play a pivotal role in shaping forest ecosystems and the structure of soil microbial communities. Plantation density significantly influences poplar growth and the soil microecosystem, regulating the diversity and composition of soil microbiota. As planting density decreases, poplar growth and soil nutrient levels tend to increase, leading to higher microbial community diversity, a richer presence of potentially beneficial bacteria, and more stable microbial communities with strong positive interactions. Bacterial communities appear to play a prominent role in modulating poplar growth. Soil available phosphorus (AP) and potassium (AK) emerged as key factors influencing microbial communities, primarily by shaping the assembly of bacterial and fungal communities and attracting key bacteria. Bacillus and Streptomyces, identified as cultivable key bacteria, were recruited in response to AP, demonstrating their capability to solubilize insoluble phosphates. This recruitment potentially creates a positive feedback loop, enhancing available phosphorus in the soil, particularly in low and medium density plantations. Therefore, there is a critical need to focus on cultivable key bacteria and their roles in plant-soil interactions under varying planting densities. This study offers deeper insights into the intricate relationships among poplar growth, soil characteristics, and key microbial communities under different plantation densities.
Supplementary Information
Acknowledgements
We express our gratitude to all those who contributed to the completion of this work. This research was made possible through the generous support of National Key Research and Development Program of China [2021YFD2201205], and Australian Research Council [FT210100902]. Hui Guo is grateful to China Scholarship Council (CSC) for funding her research to University of Western Australia.
Authors’ contributions
RY. Q.: Conceptualization, Methodology, Experiment, Data analysis, Visualization, Writing - Original Draft;Z. S.: Methodology, Investigation, Experiment, Formal analysis, Writing -Review & Editing;YL. C.: Writing -Review & Editing, Investigation, Formal analysis;MZ. X.: Methodology, Investigation;QQ. Y.: Methodology, Investigation;XL. S.: Visualization, Investigation;DY. Y.: Visualization, Investigation;PD. Z.: Funding acquisition, Supervision;CJ. D.: Supervision, Project administration;H. G.: Conceptualization, Methodology, Formal analysis, Writing - Review & Editing, Supervision, Funding acquisition.
Funding
This work was funded by National Key Research and Development Program of China [2021YFD2201205], and Australian Research Council [FT210100902].
Availability of data and materials
The raw sequencing data were deposited in the Sequence Read Archive at NCBI with the accession number PRJNA1144091 and were processed.
Declarations
Consent for publication
Not applicable.
Competing interests
The authors declare no competing interests.
Ethical approval
Not applicable.
Footnotes
Publisher’s note
Springer Nature remains neutral with regard to jurisdictional claims in published maps and institutional affiliations.
Rongye Qiao and Zhen Song contributed equally to this work.
Zhen Song co-first author.
References
- 1.Li L, Du J, Ma L, Ding C, Zhang P, Kang X. Regional testing of triploid hybrid clones of populus tomentosa. Bmc Plant Biol. 2023;23(1):277. [DOI] [PMC free article] [PubMed] [Google Scholar]
- 2.Wan C, Gao S, Wang J, Lei X, Ge J, Tao J, Wang Q, Dang P, Wang M, Yang P, Gao J. Optimal planting density combined with phosphorus input promotes common buckwheat resource use efficiency and productivity to increase grain yield. Agric Water Manag. 2023;287: 108468. [Google Scholar]
- 3.Cao J, Liu H, Zhao B, Li Z, Liang B, Shi L, Wu L, Cressey EL, Quine TA. High forest stand density exacerbates growth decline of conifers driven by warming but not broad-leaved trees in temperate mixed forest in northeast asia. Sci Total Environ. 2021;795: 148875. [DOI] [PubMed] [Google Scholar]
- 4.Büntgen U, Krusic PJ, Piermattei A, Coomes DA, Esper J, Myglan VS, Kirdyanov AV, Camarero J, Crivellaro J, Korner A. Limited capacity of tree growth to mitigate the global greenhouse effect under predicted warming. Nat Commun. 2019;10(1):2171. [DOI] [PMC free article] [PubMed] [Google Scholar]
- 5.Zhang J, Liu Y-X, Guo X, Qin Y, Garrido-Oter R, Schulze-Lefert P, Bai Y. High-throughput cultivation and identification of bacteria from the plant root microbiota. Nat Protoc. 2021;16(2):988–1012. [DOI] [PubMed] [Google Scholar]
- 6.Banwart SA, Bernasconi SM, Blum WEH, de Souza DM, Chabaux F, Duffy C, Kercheva M, Krám P, Lair GJ, Lundin L, Menon M, Nikolaidis NP, Novak M, Panagos P, Ragnarsdottir KV, Robinson DA, Rousseva S, de Ruiter P, van Gaans P, Weng L, White T, Zhang B. 2017. Chapter one - soil functions in earth’s critical zone: key results and conclusions, In: Banwart, S.A., Sparks, D.L, editors, Advances in Agronomy. Academic Press, pp. 1–27.
- 7.Mensah S, Noulèkoun F, Dimobe K, Seifert T, Glèlè Kakaï R. Climate and soil effects on tree species diversity and aboveground carbon patterns in semi-arid tree savannas. Sci Rep. 2023;13(1):11509. [DOI] [PMC free article] [PubMed] [Google Scholar]
- 8.Wang Y, Chen Y, Wu W. Potassium and phosphorus transport and signaling in plants. J Integr Plant Biol. 2021;63(1):34–52. [DOI] [PubMed] [Google Scholar]
- 9.Coban O, Deyn GB, Ploeg M. Soil microbiota as game-changers in restoration of degraded lands. Sci (New York N Y). 2022;375:abe0725. [DOI] [PubMed] [Google Scholar]
- 10.Hawkins AP, Crawford KM. Interactions between plants and soil microbes may alter the relative importance of intraspecific and interspecific plant competition in a changing climate. Aob Plants. 2018;10(4):ply039. [Google Scholar]
- 11.Selvalakshmi S, Vasu D, Yang X. Planting density affects soil quality in the deep soils of pine plantations. Appl Soil Ecol. 2022;178: 104572. [Google Scholar]
- 12.Termorshuizen AJ. Ecology of Fungal Plant pathogens. Microbiol Spectr. 2016;4(6): 4.6.15. 10.1128/microbiolspec.funk-0013-2016. [DOI] [PubMed] [Google Scholar]
- 13.Zhang L. Effects of mixed biocrusts on soil nutrients and bacterial community structure: a case study from Hilly Loess Plateau, China. Sci Rep. 2024;14(1):21265. [DOI] [PMC free article] [PubMed] [Google Scholar]
- 14.Nawaz T, Saud S, Gu L, Khan I, Fahad S, Zhou R. Cyanobacteria: harnessing the power of microorganisms for plant growth promotion, stress alleviation, and phytoremediation in the era of sustainable agriculture. Plant Stress. 2024;11: 100399. [Google Scholar]
- 15.Depauw L, De Lombaerde E, Dhiedt E, Blondeel H, Abdala-Roberts L, Auge H, Barsoum N, Bauhus J, Chu C, Damtew A, Eisenhauer N, Fagundes MV, Ganade G, Gendreau-Berthiaume B, Godbold D, Gravel D, Guillemot J, Hajek P, Hector A, Hérault B, Jactel H, Koricheva J, Kreft H, Liu X, Mereu S, Messier C, Muys B, Nock CA, Paquette A, Parker JD, Parker WC, Paterno GB, Perring MP, Ponette Q, Potvin C, Reich PB, Rewald B, Scherer-Lorenzen M, Schnabel F, Sousa-Silva R, Weih M, Zemp DC, Verheyen K, Baeten L. Enhancing tree performance through species mixing: review of a quarter-century of treedivnet experiments reveals research gaps and practical insights. Curr Rep. 2024;10(1):1–20. [Google Scholar]
- 16.Li Z, Song Z, Qiao R, Xu M, Wu X, Chen Y, Zhang P, Ding C, Chen Y, Guo H. The beneficial and pathogenic flora, environmental drivers, and community assembly mechanism of perennial poplar plantation. Plant Soil. 2024;498(1):259–77. [Google Scholar]
- 17.Durán P, Thiergart T, Garrido-Oter R, Agler M, Kemen E, Schulze-Lefert P, Hacquard S. Microbial interkingdom interactions in roots promote Arabidopsis Survival. Cell. 2018;175(4):973–e983914. [DOI] [PMC free article] [PubMed] [Google Scholar]
- 18.Jansson JK, McClure R, Egbert RG. Soil microbiome engineering for sustainability in a changing environment. Nat Biotechnol. 2023;41(12):1716–28. [DOI] [PubMed] [Google Scholar]
- 19.Ruan Z, Chen K, Cao W, Meng L, Yang B, Xu M, Xing Y, Li P, Freilich S, Chen C, Gao Y, Jiang J, Xu X. Engineering natural microbiomes toward enhanced bioremediation by microbiome modeling. Nat Commun. 2024;15(1):4694. [DOI] [PMC free article] [PubMed] [Google Scholar]
- 20.Yang X, Zhao T, Rao P, Gao K, Yang X, Chen Z, An X. Transcriptome profiling of populus tomentosa under cold stress. Ind Crop Prod. 2019;135:283–93. [Google Scholar]
- 21.Richardson AE, Simpson RJ. Soil microorganisms mediating phosphorus availability update on microbial phosphorus. Plant Physiol. 2011;156(3):989–96. [DOI] [PMC free article] [PubMed] [Google Scholar]
- 22.Lin L, Gao Z, Liu X. Estimation of soil total nitrogen using the synthetic color learning machine (SCLM) method and hyperspectral data. Geoderma. 2020;380: 114664. [Google Scholar]
- 23.Shen Y, Cheng R, Xiao W, Zeng L, Wang L, Sun P, et al. Temporal dynamics of soil nutrients in the riparian zone: effects of water fluctuations after construction of the three gorges dam. Ecol Indic. 2022;139: 108865. [Google Scholar]
- 24.Wang L, Zhang G, Zhu P, Xing S, Wang C. Soil c, n and p contents and their stoichiometry as affected by typical plant communities on steep gully slopes of the loess plateau, China. CATENA. 2022;208: 105740. [Google Scholar]
- 25.Caporaso JG, Kuczynski J, Stombaugh J, Bittinger K, Bushman FD, Costello EK, Fierer N, Peña AG, Goodrich JK, Gordon JI, Huttley GA, Kelley ST, Knights D, Koenig JE, Ley RE, Lozupone CA, McDonald D, Muegge BD, Pirrung M, Reeder J, Sevinsky JR, Turnbaugh PJ, Walters WA, Widmann J, Yatsunenko T, Zaneveld J, Knight R. Qiime allows analysis of high-throughput community sequencing data. Nat Methods. 2010;7(5):335–6. [DOI] [PMC free article] [PubMed] [Google Scholar]
- 26.Bolyen E, Rideout JR, Dillon MR, Bokulich NA, Abnet CC, Al-Ghalith GA, Alexander H, Alm EJ, Arumugam M, Asnicar F, Bai Y, Bisanz JE, Bittinger K, Brejnrod A, Brislawn CJ, Brown CT, Callahan BJ, Caraballo-Rodríguez AM, Chase J, Cope EK, Da Silva R, Diener C, Dorrestein PC, Douglas GM, Durall DM, Duvallet C, Edwardson CF, Ernst M, Estaki M, Fouquier J, Gauglitz JM, Gibbons SM, Gibson DL, Gonzalez A, Gorlick K, Guo J, Hillmann B, Holmes S, Holste H, Huttenhower C, Huttley GA, Janssen S, Jarmusch AK, Jiang L, Kaehler BD, Kang KB, Keefe CR, Keim P, Kelley ST, Knights D, Koester I, Kosciolek T, Kreps J, Langille MGI, Lee J, Ley R, Liu Y-X, Loftfield E, Lozupone C, Maher M, Marotz C, Martin BD, McDonald D, McIver LJ, Melnik AV, Metcalf JL, Morgan SC, Morton JT, Naimey AT, Navas-Molina JA, Nothias LF, Orchanian SB, Pearson T, Peoples SL, Petras D, Preuss ML, Pruesse E, Rasmussen LB, Rivers A, Robeson MS, Rosenthal P, Segata N, Shaffer M, Shiffer A, Sinha R, Song SJ, Spear JR, Swafford AD, Thompson LR, Torres PJ, Trinh P, Tripathi A, Turnbaugh PJ, Ul-Hasan S, van der Hooft JJJ, Vargas F, Vázquez-Baeza Y, Vogtmann E, von Hippel M, Walters W, Wan Y, Wang M, Warren J, Weber KC, Williamson AD, Xu ZZ, Zaneveld JR, Zhang Y, Zhu Q, Knight R, Caporaso JG. Reproducible, interactive, scalable and extensible microbiome data science using qiime 2vol 37, pg 852, (2019). Nat Biotechnol. 2019;37(9):1091. [DOI] [PubMed] [Google Scholar]
- 27.Adhya T, Gattupalli NK, Reddy G, Podile A, Hameeda B, Samantaray B. Microbial mobilization of soil phosphorus and sustainable P management in agricultural soils. Curr Sci. 2015;108:1280–7. [Google Scholar]
- 28.Kumar A, Asthana M, Gupta A, Nigam D, Mahajan S. Chapter 3 - secondary metabolism and antimicrobial metabolites of penicillium. In: Gupta VK, Rodriguez-Couto S, editors. New and Future developments in Microbial Biotechnology and Bioengineering. Amsterdam: Elsevier; 2018. pp. 47–68.
- 29.Sun X, Xu Z, Xie J, Hesselberg-Thomsen V, Tan T, Zheng D, Strube ML, Dragoš A, Shen Q, Zhang R, Kovács ÁT. Isolation and identification of potassium-solubilizing bacteria from mikania micrantha rhizospheric soil and their effect on m. Micrantha plants Glob Ecol Conserv. 2020;23:e01141. [Google Scholar]
- 30.Li PD, Zhu ZR, Zhang Y, Xu J, Wang H, Wang Z, Li H. The phyllosphere microbiome shifts toward combating melanose pathogen. Microbiome. 2022;10(1):56. [DOI] [PMC free article] [PubMed] [Google Scholar]
- 31.Zhang X, Xu D, Wang Z. Optimizing spatial layout of afforestation to realize the maximum benefit of water resources in arid regions: a case study of alxa, China. J Clean Prod. 2021;320: 128827. [Google Scholar]
- 32.Yu Z, Liu Z, Sun L, Dong C, Jin Y, Hu B, Cheng D. Mobile genetic elements mediate the cross-media transmission of antibiotic resistance genes from pig farms and their risks. Sci Total Environ. 2024;926: 172115. [DOI] [PubMed] [Google Scholar]
- 33.Chen W, Ren K, Isabwe A, Chen H, Liu M, Yang J. Stochastic processes shape microeukaryotic community assembly in a subtropical river across wet and dry seasons. Microbiome. 2019;7(1):138. [DOI] [PMC free article] [PubMed] [Google Scholar]
- 34.Qi L, Li R, Wu Y, Ibeanusi V, Chen G. Spatial distribution and assembly processes of bacterial communities in northern florida freshwater springs. Environ Res. 2023;235: 116584. [DOI] [PubMed] [Google Scholar]
- 35.Zhang W, Munkholm LJ, An T, Liu X, Zhang B, Xu Y, Ge Z, Zhang Y, Zhang J, Li S, Wang J. Influence of environmental factors on soil organic carbon in different soil layers for Chinese mollisols under intensive maize cropping. Sci Total Environ. 2022;835: 155443. [DOI] [PubMed] [Google Scholar]
- 36.Xiang Q, Qiao M, Zhu D, Giles M, Neilson R, Yang X-R, Zhu Y-G, Chen Q-L. Seasonal change is a major driver of soil resistomes at a watershed scale. ISME Commun. 2021;1(1):17. [DOI] [PMC free article] [PubMed] [Google Scholar]
- 37.Zheng W, Wu Q, Guo X, Zhou P, Wu J, Yan W. Rocky desertification succession alters soil microbial communities and survival strategies in the karst context. Sci Total Environ. 2024;927: 172171. [DOI] [PubMed] [Google Scholar]
- 38.Harkes P, van Steenbrugge JJM, van den Elsen SJJ, Suleiman AKA, de Haan JJ, Holterman MHM, Helder J. Shifts in the active rhizobiome paralleling low meloidogyne chitwoodi densities in fields under prolonged organic soil management. Front Plant Sci. 2020;10:1697. [DOI] [PMC free article] [PubMed] [Google Scholar]
- 39.Deng Y, Jiang Y, Yang Y, He Z, Luo F, Zhou J. Molecular ecological network analyses. BMC Bioinformatics. 2012;13(1):113. [DOI] [PMC free article] [PubMed] [Google Scholar]
- 40.Fernandez M, Vincent G, Dorr E, Bakker S, Lerch TZ, Leloup J, Korboulewsky N, Bazot S. Does forest stand density affect soil microbial communities? Appl Soil Ecol. 2024;195: 105244. [Google Scholar]
- 41.Trentini CP, Campanello PI, Villagra M, Ritter L, Ares A, Goldstein G. Thinning of loblolly pine plantations in subtropical argentina: impact on microclimate and understory vegetation. Ecol Manage. 2017;384:236–47. [Google Scholar]
- 42.Solomon W, Janda T, Molnár Z. Unveiling the significance of rhizosphere: implications for plant growth, stress response, and sustainable agriculture. Plant Physiol Biochem. 2024;206: 108290. [DOI] [PubMed] [Google Scholar]
- 43.Nazari MT, Simon V, Machado BS, Crestani L, Marchezi G, Concolato G, Ferrari V, Colla LM, Piccin JS. Rhodococcus: a promising genus of actinomycetes for the bioremediation of organic and inorganic contaminants. J Environ Manage. 2022;323:116220. [DOI] [PubMed] [Google Scholar]
- 44.Xun W, Liu Y, Li W, Ren Y, Xiong W, Xu Z, Zhang N, Miao Y, Shen Q, Zhang R. Specialized metabolic functions of keystone taxa sustain soil microbiome stability. Microbiome. 2021;9(1):35. [DOI] [PMC free article] [PubMed] [Google Scholar]
- 45.Sun X, Xu Z, Xie J, Hesselberg-Thomsen V, Tan T, Zheng D, Strube ML, Dragoš A, Shen Q, Zhang R, Kovács ÁT. Bacillus velezensis stimulates resident rhizosphere pseudomonas stutzeri for plant health through metabolic interactions. ISME J. 2022;16(3):774–87. [DOI] [PMC free article] [PubMed] [Google Scholar]
- 46.Dedysh SN. In: Trujillo ME, Dedysh S, DeVos P, Hedlund B, Kämpfer P, Rainey FA, Whitman WB, editors. Bryobacter, in: Bergey’s Manual of Systematics of Archaea and Bacteria. New York: John Wiley & Sons, Inc.; 2019. pp. 1–5.
- 47.Li A, Wang Y, Wang Y, Dong H, Wu Q, Mehmood K, Chang Z, Li Y, Chang Y-F, Shi L, Tang Z, Zhang H. Microbiome analysis reveals soil microbial community alteration with the effect of animal excretion contamination and altitude in Tibetan plateau of China. Int Soil Water Conserv Res. 2021;9(4):639–48. [Google Scholar]
- 48.Lu X, Cao T, Nguyen T, Yuan H. Six new species of tomentella (thelephorales, basidiomycota) from tropical pine forests in central Vietnam. Front Microbiol. 2022;13:864198. [DOI] [PMC free article] [PubMed] [Google Scholar]
- 49.Jin W, Peng L, Zhang X, Sun H, Yuan Z. Effects of endophytic and ectomycorrhizal basidiomycetes on quercus virginiana seedling growth and nutrient absorption. J Sustain for. 2019;38(5):457–70. [Google Scholar]
- 50.Chen Q, Yin SL, Zhang XG, Ma XY, Zhong S, Zhang GZ. Dactylonectria species associated with black root rot of strawberry in China. Austral Plant Pathol. 2021;50(5):501–11. [Google Scholar]
- 51.Santiago R, Reid LM, Arnason JT, Zhu X, Martinez N, Malvar RA. Phenolics in maize genotypes differing in susceptibility to gibberella stalk rot (fusarium graminearum schwabe). J Agric Food Chem. 2007;55(13):5186–93. [DOI] [PubMed] [Google Scholar]
- 52.Smith JE. Mycorrhizal symbiosis (third edition). Soil Sci Soc Am J. 2009;73(2):694. [Google Scholar]
- 53.Raaijmakers JM, Paulitz TC, Steinberg C, Alabouvette C, Moënne-Loccoz Y. The rhizosphere: a playground and battlefield for soilborne pathogens and beneficial microorganisms. Plant Soil. 2009;321(1):341–61. [Google Scholar]
- 54.Huang J, Hu B, Qi K, Chen W, Pang X, Bao W, Tian G. Effects of phosphorus addition on soil microbial biomass and community composition in a subalpine spruce plantation. Eur J Soil Biol. 2016;72:35–41. [Google Scholar]
- 55.Yuan M, Zhu X, Sun H, Song J, Li C, Shen Y, Li S. The addition of biochar and nitrogen alters the microbial community and their cooccurrence network by affecting soil properties. Chemosphere. 2023;312: 137101. [DOI] [PubMed] [Google Scholar]
- 56.Carpenter S, Bennett E. Reconsideration of the planetary boundary for phosphorus. Environ Res Lett. 2011;6:14009. [Google Scholar]
- 57.Bai Y, Cotrufo MF. Grassland soil carbon sequestration: current understanding, challenges, and solutions. Volume 377. New York, N.Y.: Science; 2022. pp. 603–8. [DOI] [PubMed] [Google Scholar]
Associated Data
This section collects any data citations, data availability statements, or supplementary materials included in this article.
Supplementary Materials
Data Availability Statement
The raw sequencing data were deposited in the Sequence Read Archive at NCBI with the accession number PRJNA1144091 and were processed.