

SUMMARY
mRNAs interact with RNA-binding proteins (RBPs) throughout their processing and maturation. While efforts have assigned RBPs to RNA substrates, less exploration has leveraged protein-protein interactions (PPIs) to study proteins in mRNA life-cycle stages. We generated an RNA-aware, RBP-centric PPI map across the mRNA life-cycle in human cells by immunopurification-mass spectrometry of ~100 endogenous RBPs with and without RNase, augmented by size exclusion chromatography-mass spectrometry. We identify 8,742 known and 20,802 unreported interactions between 1,125 proteins and determine that 73% of IP interactions are RNA-regulated. Our interactome links many proteins, some with unknown functions, to specific mRNA life-cycle stages, with nearly half associated with multiple stages. We demonstrate the value of this resource by characterizing splicing and export functions of ERH and by showing that SNRNP200 interacts with stress granule proteins and binds cytoplasmic RNA differently during stress.
Keywords: RNA-binding proteins, protein-protein interactions, interactome, RNA-dependent protein interactions, SNRNP200, ERH, IP-MS, SEC-MS
eTOC Blurb
Street, Rothamel, Brannan et al. generate an RNA-aware RBP protein-protein interactome across the mRNA life-cycle in human cells, leading to discovery of previously unknown RBP interactions and functions. Investigation into the functions of the two most-connected proteins, ERH and SNRNP200, reveal the utility of the network for multifunctional RBP discovery.
Graphical Abstract

INTRODUCTION
RNA molecules associate with thousands of RNA-binding proteins (RBPs) to construct functional ribonucleoprotein complexes (RNPs)1–3 that are dynamic across RNA life-cycle steps, with RBPs rearranging and exchanging both RNA substrates and protein interactors to orchestrate enzymatic processing, subcellular localization, mRNA translation, and degradation. Recent work on RBPs has focused on identifying these proteins through computational predictions and/or mass spectrometry approaches4–15, identifying over 4,000 potential RBPs, the majority of which have unknown functions. In addition, a lot of effort has been directed at identifying the RNA targets of individual RBPs, especially using crosslinking and immunoprecipitation (CLIP)16–24. CLIP methods are powerful for obtaining individual RBP binding profiles but are blind to RNP-complex membership and dynamics. Because RBPs can be found in multiple RNP complexes, contain diverse RNA-binding domain (RBD) combinations, and shuttle between subcellular locales, they likely have multiple functions that can be uncovered by RBP-focused protein-protein interaction (PPI) networks25. RBP protein partners modulate RNA-binding affinity, specificity, and functionality. Therefore to characterize multifunctional RBPs, it is critical to define both RNA-targets and protein-interactors of RBPs26–28.
Systematic large-scale efforts to characterize protein-protein interactions (PPIs) across cell types via affinity-purification mass spectrometry, such as OpenCell29, Bio-ID30–32, BioPlex33–35, and the Human Interactome36 rely on fusion of affinity tags and bait over-expression, which can produce non-physiological interactomes. Moreover, while some of these networks have considerable RBP representation, they fail to assess the RNA-dependency of these interactions, and therefore cannot distinguish if PPIs are direct or RNA-mediated. RBP-focused attempts to delineate RBP PPI networks, such as the yeast two-hybrid screen rec-Y2H37, have similar limitations, including lack of RNA-aware interaction information and use of exogenous tags or nuclear-localization signals. Recently an RNA-aware RBP interactome was generated in yeast38, but we still lack an RNA-aware RBP interactome in human cells.
As an orthogonal method, size exclusion chromatography followed by mass spectrometry (SEC-MS), can infer interactions by measuring the co-elution of protein pairs or complexes across size exclusion fractions39–45. SEC-MS complements IP-MS as it is not biased by antibody or bait selection and can therefore detect prey-prey interactions, allowing the assignment of proteins to distinct complexes. Co-elution approaches have been previously used to study RBPs, but mainly to identify RBPs or interactions that are RNA-associated, and not to define which PPIs are RNA-dependent46,47.
We combined the strengths of IP-MS and SEC-MS to gain insight into the PPI networks of RBPs across the mRNA life-cycle. We employed RNase-coupled proteomics to capture RNA-mediated and direct PPIs of known RBPs in HEK293XT cells. Our PPI network is centered around 92 IP-MS targeted RBPs, which are found across all mRNA life-cycle stages. Combining this IP-MS data with global SEC-MS, we generated a network of 1125 proteins, forming 29,544 interactions, which we classified into specific interaction categories and compared to other established PPI networks. To uncover uncharacterized RNP complexes, RBP function, and mRNA life-cycle nexuses, we conducted prey-centric and betweenness centrality analyses. These analyses revealed numerous multifunctional RBPs, leading to the detailed characterization of the two most highly connected proteins ERH and SNRNP200. Our network analyses, in combination with eCLIP and functional assays, describe cellular compartment-specific functions and binding profiles of these two proteins.
RESULTS
An RBP-centric, RNA-aware PPI network captures previously unreported RBP interactions and functions across the mRNA life-cycle
Using the mRNA life-cycle as a guide to map PPIs of RBPs, we selected ~100 RBPs with roles in RNA processing at one or more mRNA life-cycle steps (Figure 1A, Supplemental Table 1). To identify both the direct and RNA-mediated protein interactors (Pis) for each bait, IP-MS was performed in triplicate in the presence and absence of RNase (Supplemental Figure 1A). After initial QC 92 bait proteins remained in the dataset. We classified interactions (Figure 1B) as follows: (1) direct Pis were detected regardless of the presence or absence of RNA. (2) RNA-mediated Pis were detected only in the presence of RNA; these interactions do not have to result from direct RNA-binding but include Pis that depend on the presence of RNA. (3) RNA-shielded Pis were detected only in the absence of RNA; and (4) undetermined Pis were those where the IP failed across one of the RNase conditions and therefore, we could not determine the RNA-dependence of the interactions (Supplemental Table 1).
Figure 1. Endogenous immunopurification (IP) followed by LC-MS/MS captures and quantifies the RNA-dependent or independent interactome of RNA-binding proteins (RBPs) across the mRNA life-cycle.

A. mRNA life-cycle assignments of baits targeted by IP-MS to build the RBP centric protein-protein interactome.
B. Types of RNA-independent and dependent interactions.
C. Percent of previously unidentified and supported interactions for each interaction type.
D. Cytoscape93 IP-MS network with bundled edge layout. Bait nodes are colored by their life-cycle stage assignments in A. The mRNA exosome (1) and U1, U2, and Sm core spliceosome complex (2, Sm core [purple], U1 specific proteins [orange], U2 specific proteins: SF3a complex [yellow], SF3b complex [pink]) interactions are zoomed in.
E. Percent of supported interactions compared to randomly shuffled interactions of all the proteins in the network for n=1000 tests, p-value < 0.001.
F. The number, types, and percent support of interactions for each bait sorted by mRNA life-cycle stage assignment. See also Figure S1 and Tables S1 and S2.
We expected most interactions to be direct or RNA-mediated, however, almost half our interactions are RNA-shielded. We found that 88.7% of shielded interaction preys are associated with the splicing and translation network hubs, and that 21% of the shielded interactions are found in the highly curated CORUM48,49 database in large, well-defined complexes such as the ribosome and spliceosome (Supplemental Figure 1B). These results indicate that large RNP complexes may be more difficult to IP in strict RNase-minus conditions, however upon partial RNA digestion, the bait proteins may be more accessible as the complexes might have been partially released from larger RNA-dependent cellular structures or have their antibody-binding residues exposed such that they can be enriched by IP. Furthermore, as RNA-shielded Pis are supported in the literature at levels similar to RNA-mediated interactions (Figure 1C), we concluded that the shielded category contains biologically relevant interactions and thus included shielded interactions in the network.
Our resulting IP-MS-generated RBP PPI network contains 1,125 distinct proteins with 4,350 interactions (Figure 1D, Supplemental Table 2). We discovered 885 direct, 1,107 RNA-mediated, 2,053 RNA-shielded, and 305 undetermined interactions, of which 497 (56.1%), 751 (67.8%), 1,401 (68.3%) and 214 (70.2%) are previously unidentified, respectively, when compared to PPI databases and large-scale interactome studies29–31,33–37,48–52 (Figure 1C; Materials and Methods). We observed that, overall, 34.2% of interactions were previously identified (Supplemental Figure 1B), and previously reported interactions were missed at similar or lower rates compared to other large-scale HEK293 PPI interactomes (Supplemental Figure 1C). To ensure that the support for our PPIs is not artificially inflated due to high connectivity, we compared our interactions to randomly shuffled interactions within the network. Our direct interactions showed nearly three times more support compared to random interactions (resampling test, n = 1,000, p-value < 1 × 10⁻³ for all interaction types, Figure 1E), and RNA-mediated and shielded interactions demonstrated approximately two times more, a trend which was even more pronounced when comparing only to CORUM PPIs48,49, a benchmark dataset (p-values < 1 × 10⁻³, Supplemental Figure 1D).
We next asked if our interactome and the RNA-dependency information confirmed our expectations for well-studied complexes (Figure 1D). As expected for stable complexes that form without an RNA scaffold, the mRNA exosome is connected by direct interactions. In contrast, the U1 and U2 spliceosome complexes are connected by a mixture of direct, RNA-mediated, and RNA-shielded interactions.
Using the RBP predictor HydRa53 we see that the prey proteins in the network have significantly higher RNA-binding prediction scores compared to our measured HEK293XT total proteome, with over 75% of preys predicted to have RNA-binding capacity (Supplemental Figure 1E, K–S test p-value < 2.2 × 10⁻¹⁶). We also find that 59.7% of preys interact with more than one bait and 48.5% interact with baits of more than one life-cycle stage (Supplemental Figure 1F). Overall, our network recapitulates known PPIs and also captures undiscovered RBP interactions, providing a comprehensive map of RBP PPIs and their RNA-dependency across the mRNA life-cycle (Figure 1F, Supplemental Figure 1G).
SEC-MS elucidates complex membership within the IP-MS interactome
IP-MS experiments capture PPIs with high sensitivity across a range of stoichiometric ratios; however, they only capture bait-prey interactions and cannot define complex membership amongst prey proteins. If a bait protein is a member of two complexes, IP-MS can capture the members of those complexes but cannot disentangle which preys are members of one complex versus the other. To address this limitation, we performed size-exclusion chromatography followed by mass spectrometry (SEC-MS) in HEK293XT cells (Figure 2A, Supplemental Figure 2A). We focused our analysis on discovering the composition of protein complexes in our IP-MS interactome, by testing for statistically significant co-elution of interacting proteins as compared to a decoy interaction set. The strength of this approach is that it fills in our targeted IP-MS network by incorporating both IP-MS interactions with orthogonal SEC-MS support and prey-prey interactions, providing a more complete understanding of the complex interactions involved in the mRNA life-cycle.
Figure 2. Size exclusion chromatography (SEC) followed by LC-MS/MS identifies prey-prey interactions and provides orthogonal support for the IP-MS network, creating a comprehensive network with modular structure.

A. Schematic of the SEC-MS experimental workflow.
B. The combined IP-MS and SEC-MS interactome93. Bait nodes are colored by life-cycle stage assignments and the mRNA exosome and Sm core, U1 and U2 spliceosome complexes are zoomed-in as in Figure 1C.
C. Percent of possible CORUM interactions found in the RBP interactome, and the OpenCell and BioPlex 3.0 datasets.
D. RNase-plus versus -minus SEC-MS data. Minimum peak distances between bait and prey SEC elution peaks for preys that are only identified in direct or RNA-mediated interactions. Minimum peak distances in RNase-plus versus -minus conditions are plotted (Wilcoxon test p-values are shown).
E. Co-localization of interacting proteins in the network based on the proteins’ Human Protein Atlas localization assignments. Interacting proteins where 100% of their assignments were shared are labeled as “full overlap”, where only some were shared are “partial overlap”.
F. Stoichiometric ratios of interactions found in the highly curated CORUM database. The log2 ratios of the intensities of the prey over bait in the IP-MS data is plotted against the log2 intensity ratios of the prey over bait in total proteome data.
G. Stoichiometric ratios of direct and RNA-mediated interactions are plotted as in E. See also Figure S2 and Table S2.
The resulting SEC-MS interactome identified 26,946 interactions between the 1,125 proteins in the IP-MS network, of which 1,752 interactions (40.3% of the IP-MS interactome) provide orthogonal confirmation for IP-MS interactions and 25,194 are prey-prey interactions. Of the SEC-MS interactions, 8,005 (29.7%) have been previously described in the literature and 18,941 are uncharacterized (Supplemental Figure 2B). Our resampling test confirmed that SEC interactions have 2 times more literature support than random pairs of proteins (p-value < 1 × 10⁻³, n = 1000) and about 3 times more supported in CORUM than expected by chance (p-value < 1 × 10⁻³, n = 1000) (Supplemental Figure 2C and D). Based on these results we were confident that the SEC-MS data would enhance the IP-MS interactome, so we combined both networks into a final interactome of 29,544 interactions between 1,125 proteins (Figure 2B).
SEC is particularly helpful in strengthening parts of the interactome with a lower IP-MS bait density. For example, the U1 and U2 spliceosomal interactome becomes much more connected upon addition of the SEC data (Figure 2B), enabling greater resolution of how the subcomplexes interact. Even for well-covered complexes in the IP-MS network (e.g., the mRNA exosome), SEC proved valuable for identifying prey-prey interactions and providing orthogonal support for many of the IP-MS interactions (Figure 2B).
We next looked more closely at the overlap between the IP-MS and SEC-MS interactomes. Interactions found by both methods are more likely to be validated by previous approaches than interactions identified by either method alone (Supplemental Figure 2B). Our combined IP-MS and SEC-MS network identified a larger percentage of possible CORUM interactions than previously published datasets (Figure 2C). Next, we explored whether SEC data could improve our understanding of the RNA-shielded IP-MS interactions, finding that they had proportionally more support in SEC than other interaction types (Supplemental Figure 2E). This strengthens the hypothesis that a large percentage of the RNA-shielded interactions are found in the presence of RNA, but limitations of the IP method alone prevent their accurate identification in IP-MS under strict RNase-minus conditions.
Using the orthogonal SEC approach, we tested the RNA dependency of our PPIs by performing SEC-MS in RNase-plus conditions. As in the DIF-FRAC paper47, we analyzed shifts in the elution profiles of interacting proteins of interest between RNase-minus and plus conditions. To simplify the analysis, we focused on prey proteins that were only identified as direct or RNA-mediated and calculated the minimum distance between the bait and prey apexes for each interaction in their SEC elution profiles. As predicted, RNA-mediated interactions showed a greater shift than direct interactions. Direct interactions had no significant shift in bait-prey distance, while RNA-mediated interactions showed a significant increase in distance upon RNase treatment (Figure 2D, Wilcoxon test, p-value n.s. (direct), 0.0055 (RNA-mediated)). These results indicate that direct interactions eluted together independent of the presence of RNA, while proteins forming RNA-mediated interactions did not elute as closely in the absence of RNA.
Taken together, these results indicate that combining IP-MS and SEC-MS enhances our understanding of the complexes involved in the mRNA life-cycle. The interactome is supported at levels comparable to other recent large-scale interactomes, while additionally identifying previously uncharacterized interactions, providing RNA-dependency information for the IP-MS interactions, identifying prey-prey interactions that improve complex resolution, and providing orthogonal confirmation of interactions found in both IP-MS and SEC-MS.
RNA dependency differences are reflected across network metrics
We next evaluated the RBP PPI network for network-level properties to reveal more about how RBPs function within the life-cycle. As protein localization is a reasonable proxy for function and is directly related to proteins’ ability to interact, we wondered if our interactome recapitulated previous subcellular localizations. We found that our interactions had significantly greater co-localization assignments in the Human Protein Atlas54 compared to random interactions between proteins in the interactome and were co-localized at similar levels to another large-scale dataset-BioPlex 3.035 (Supplemental Figure 2F). Analysis of how previously reported co-localizations were distributed across different types of interactions revealed that direct interactions had the greatest overlap at 46.4%, compared to 31.4% for RNA-mediated, and 32% of RNA-shielded (Figure 2E). These levels are comparable to 34% of BioPlex 3.0 interactions having co-localization.
To gain insight into how interactome proteins behave in hubs, we analyzed the stoichiometric information from our IP-MS data, which reflects interaction stoichiometries based on relative intensities of baits and preys29,36. To rule out that low stoichiometric ratios are due to lower protein abundance, we estimated the total proteome abundance by LC-MS/MS measurements of total cell lysates. We plotted the stoichiometric ratios of the interactions from the IP-MS data against the ratios from the total protein abundances and found that, as expected, interactions in CORUM, which we use as a proxy for well-defined stable complexes, were centered around 1:1 stoichiometries (Figure 2F).
We next queried whether the RNA-dependency of interactions correlates with differences in interaction stoichiometries. Direct interactions overlap well with CORUM interactions (Figure 2G, Supplemental Figure 2G, H). RNA-mediated interactions have lower and more varied stoichiometric ratios compared to direct interactions, along with a wider total proteome abundance ratio range (Figure 2G, Supplemental Figure 2G). This data is consistent with proteins whose expression and degradation are not co-regulated, unlike the co-regulation observed in stable complexes55–57. RNA-shielded interactions have interaction stoichiometries between those of direct and RNA-mediated, consistent with the large number of shielded interactions that map to the ribosome and spliceosome (Supplemental Figure 2G), meaning that the shielded distribution tended towards 1:1 ratios due to many of those interactions. The differences in ratios between interaction types indicate that direct interactions are likely more stable and represent distinct enzymatic hubs, while RNA-mediated interactions may be more transient and represent mRNPs functioning in the progression of mRNA processing. Taken together, these observations indicate that the RNA dependencies of interactions are associated with differences across a variety of protein interaction metrics including co-localization, complex membership, and interaction stoichiometry.
Transcriptome-wide binding data validates network structure
To test the hypothesis that interacting RBPs are more likely to bind to similar transcripts, we performed a co-occurrence analysis using the Jaccard index, leveraging available ENCODE eCLIP data20,22 (Supplemental Table 3). The Jaccard index measures the intersection of two sets of data divided by the sample size of each of the datasets. 72 and 63 RBPs within our network have eCLIP data in HepG2 and K562 cell-lines, respectively. We reasoned that RBPs that form complexes and interact in any manner would have a higher probability of binding the same transcripts as RBPs that do not interact. In both cell types, all interaction types in our network have significantly higher Jaccard indexes than random pairs of RBPs in the ENCODE data (Wilcoxon Rank Sum Test; Figure 3A). Despite all interaction types co-binding their RNA targets more significantly than expected by chance, direct and shielded PPIs are more likely to bind similar binding sites on transcripts than proteins that interact in an RNA-mediated manner (Figure 3A).
Figure 3. ENCODE data support RNA-aware PPI network.
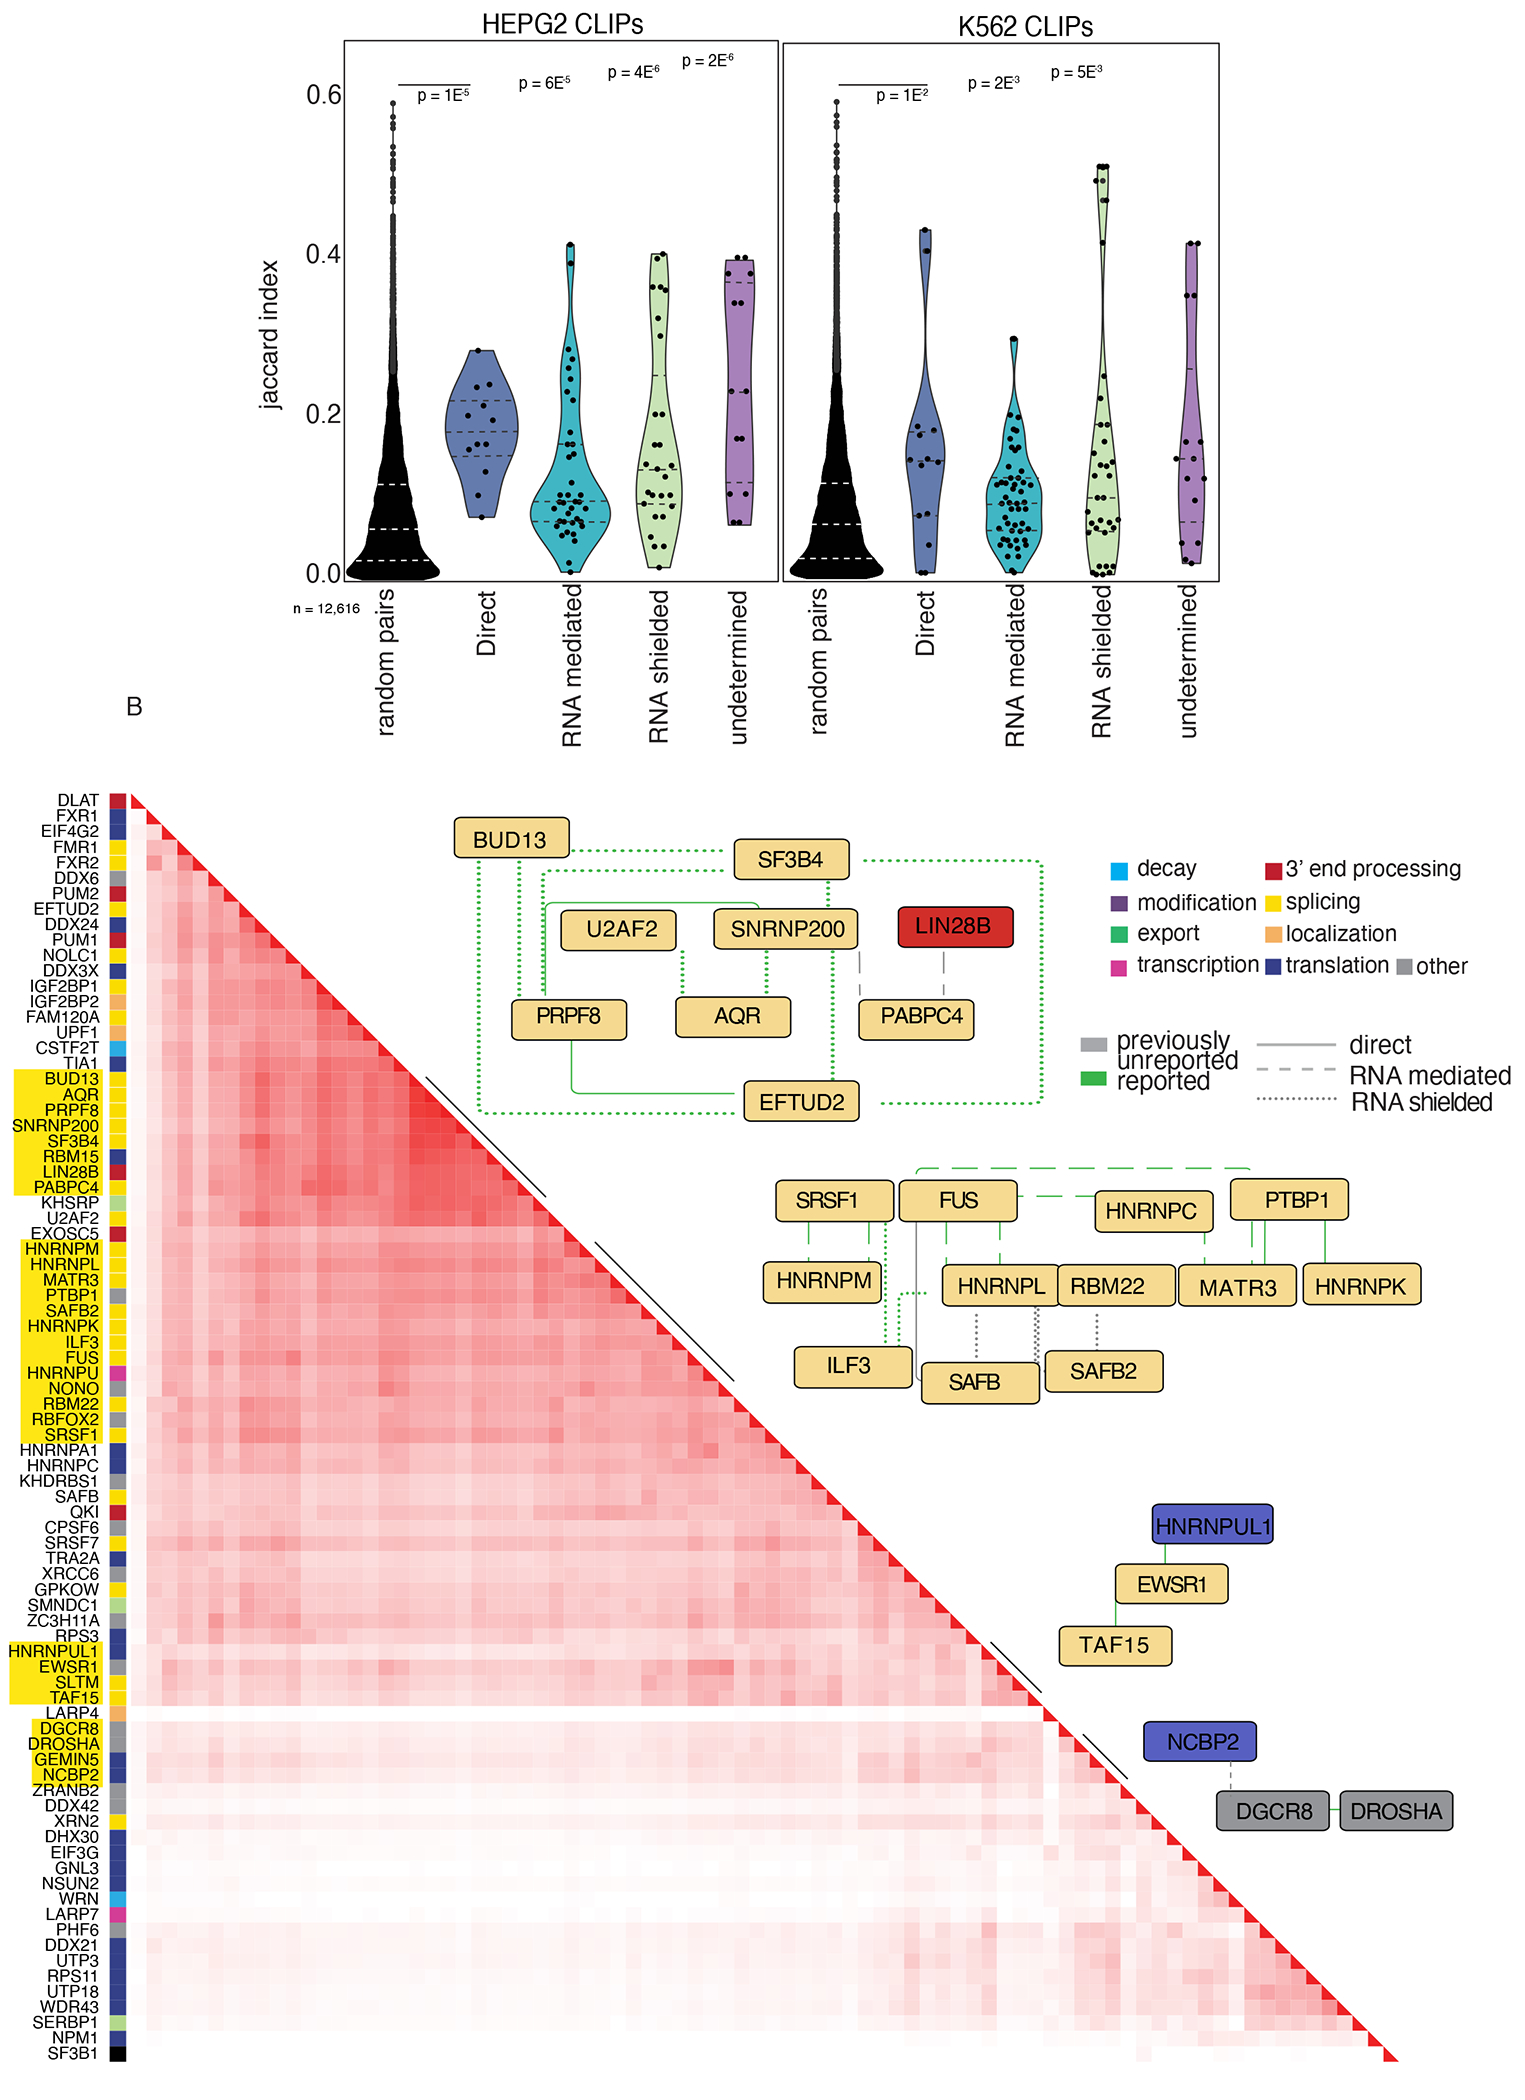
A. Violin plot of the Jaccard index scores across interaction types and cell types from ENCODE data. Each dot represents a pair of RBP interactions. The middle-dashed line represents the median and the upper and lower lines represent the first and third quartiles.
B. Hierarchical clustering heatmap of the Jaccard indices for protein pairs in K562 cells. Recapitulated network interactions are highlighted next to the corresponding Cytoscape93 plot. See Table S3.
We performed hierarchical clustering on the Jaccard indices to test if we could recapitulate PPIs within our network (Figure 3B), revealing several large clusters that mimicked distinct interactions from our network. In our network, the splicing factor HNRNPL interacts directly with HNRNPC and MATR3 and interacts in an RNA-dependent manner with ILF3 and CSTF2. MATR3, HNRNPC, and HNRNPL have been previously described as forming a multimeric splicing complex58. The core spliceosome components ETUD2, PRPF8, BUD13, SNRNP200, and SF3B4 also clustered, highlighting the precision of our network and that interactions can be recapitulated using binding site data. This also supports our hypothesis that RBPs that interact bind RNAs as a complex.
The network associates hundreds of uncharacterized RBPs to specific life-cycle stages and reveals protein complex organization
Our list of preys includes a substantial proportion of known and predicted RBPs (Supplemental Figure 1E). However, many of these candidate RBPs have yet to be functionally linked to specific RNA life-cycle stages. To investigate the functional relationships within the network and generate hypotheses about the functions of these uncharacterized preys, we examined the distribution of life-cycle steps associated with each prey by assigning each prey to the life-cycle of the majority of baits with which it interacts (Figure 4A). By linking the preys to specific life-cycle steps based on their interactions with the baits, we were able to assign and identify clusters of preys that participate across specific life-cycle steps (Supplemental Figure 3A). Interestingly, a significant portion (50%) of preys were assigned to multiple life-cycle steps (Supplemental Table 4). Additionally, a subset of preys that are associated with splicing or translation also interact with preys from other mRNA life-cycle steps, suggesting that RBPs associated with splicing and translation might have roles outside of their known functions. This analysis provides valuable interaction signatures that serve as starting points for determining the functional roles of previously uncharacterized prey proteins in our network.
Figure 4. Prey-prey correlation defines the organization of protein complexes.

A. Heatmap of hierarchical clustering of the distribution of life-cycle steps associated with each prey based on the life-cycle associations of its interacting bait(s).
B. Heatmap showing the Pearson correlation of all the preys’ interactions from the entire network. Indicated clusters are well-known CORUM complexes. Enlarged view of part of the off-diagonal clusters showing preys whose interactions correlated to PDC, SNRNP200, and ERH. Color bar indicates the life-cycle step assigned by the unsupervised clustering in A.
C. Cumulative distribution plot of the betweenness centrality scores. The top 3% of RBPs with the highest scores are plotted. See also Figure S3 and Tables S3, S5, and S6.
Given the limited number of baits relative to preys in our PPI network, we shifted our focus to a prey-centric analysis to examine the potential interactions among preys. This approach, distinct from our previous analysis, overlooks the mRNA life-cycle stages of the baits and evaluates all potential pairwise interactions between each bait and its corresponding preys. We calculated the Pearson correlation coefficient across a matrix of whether each bait and prey interact (Supplemental Table 5). The underlying rationale was that preys interacting with a similar set of baits are likely to be part of the same functional RNP complex. The heatmap of the correlation of all preys (n = 1,103) produces dense clusters corresponding to well-defined protein complexes (Figure 4B), such as the anaphase-promoting complex (ANAPAC), exosome, and the small and large ribosomal subunits. Non-uniform clusters with many off-diagonal interactions were also observed, implicating that these proteins are involved in multiple functions and complexes. One of the off-diagonal clusters connects the pyruvate dehydrogenase complex (PDC) with many eIF (translation initiation) proteins, suggesting an uncharacterized role for this enzymatic complex in mRNA translation. We also observe that stress granule proteins, such as G3BP1, FMR1, and CAPRIN, interact with ribosomal subunits and many other RBPs that regulate translation (Figure 4B). Taken together, correlating preys into an interaction map not only recapitulates well-known complexes, but more importantly, highlights the multifunctional nature of multiple RBPs and assigns uncharacterized RBPs to RNA life-cycle stages.
Betweenness centrality analysis reveals RBPs that function across multiple mRNA life-cycle steps
To systematically rank the RBPs that function across multiple steps in the mRNA life-cycle, we computed a betweenness centrality score (BCS) on each node (baits and preys) in our network. The BCS is calculated by finding all connected pairs of proteins between different life-cycle steps and then, for a given protein, measuring the number of the shortest paths from these connected pairs that pass through the given protein. The scores were normalized based on the “traffic load” (e.g., number of interactions) between the life-cycle steps (Figure 4C, Supplemental Figure 3B). We hypothesize that RBPs with high scores are multi-functional proteins that “bridge” RNA life-cycle steps and that the loss of these intermediates will significantly impact the network and subsequent RNA processing events. The RBPs with the highest centrality scores were ERH, SNRNP200, HNRNPL, CAPRIN1, and UBAP2L (Figure 4C, Supplemental Table 6). To support our claim that proteins with high BCS values are associated with multiple mRNA life-cycle steps, we conducted an analysis on the bait life-cycle step distribution for the top 30 proteins with the highest centrality scores (Supplemental Figure 3C). This analysis demonstrates that most of these proteins are associated with baits across multiple life-cycle steps, providing strong evidence that these proteins exhibit a high degree of multifunctionality and may serve as potential bridges between multiple steps. We next performed a more in-depth analysis of the roles played by the two RBPs with the highest BCS values: ERH and SNRNP200.
Enhancer of rudimentary homology (ERH) scaffolds nuclear speckle formation necessary for RNA splicing and nuclear export
Our PPI network indicates that the protein ERH interacts with multiple proteins across mRNA life-cycle steps, including transcription, splicing, degradation, and nuclear export (Figure 5A, Supplemental Figure 4A). These findings are consistent with previous reports that suggest human ERH has multiple protein partners59–62. ERH has also been previously described to form a complex with Drosha and DGCR8 and shown to be important for processing suboptimal pri-miRNAs62. Depletion of ERH was previously shown to affect differential splicing of thousands of transcripts and result in an increase in the expression of γH2AX, a marker for DNA damage63. However, ERH does not have a canonical RBD.
Figure 5. ERH interacts with many RBPs to mediate nuclear speckle organization and mRNA export.

A. Cytoscape93 plot of ERH direct and RNA-mediated interactions. Solid lines denote direct interactions, dotted lines represent RNA-mediated interactions. Proteins are colored by life-cycle steps or functional complexes.
B. Immunoblot of ERH in HEK293XT showing the shRNA knockdown vs control.
C. Immunofluorescence of nuclear speckle marker SRSF2 (SC35)94,95 and poly(A) RNA in HEK293XT.
D. Quantification of number of nuclear speckles in control cells vs ERH knockdown cells, p-value < 3x10⁻⁴ (unpaired t test).
E. Quantification of nuclear poly(A) signal intensity in knockdown cells compared to control. p-value < 1x10⁻⁴ (unpaired t test).
F. Immunofluorescence of 5-EU pulse labeling experiment 0 and 4 hours after chase with non-modified uridine.
G. Quantification of 5-EU nuclear intensity in ERH KD and CTRL samples 0 and 4 hours after 5-EU pulse-chase. p-values were determined by an unpaired t test. See also Figure S4.
To evaluate if ERH directly binds RNA, we performed Crosslinking and Solid Phase Purification (CLASP) in HEK293XT cells to capture proteins that have been covalently crosslinked to RNA after denaturing washes64. Compared to our positive controls (PCF11 and YTHDC1), ERH does not bind a significant amount of RNA (Supplemental Figure 4B). This was further confirmed by our attempt at ERH eCLIP, where we found very few enriched targets (Supplemental Table 7). Taken together, our findings suggest that ERH is not an RBP itself, but likely functions as a scaffold protein that facilitates RBP interactions.
Our identification of ERH interacting with TREX components supports the previous finding and cryo-EM structure showing that recombinant TREX-mRNA complex co-purifies with ERH65. TREX components act as a platform within or on the periphery of nuclear speckles, facilitating splicing and mRNA export66–69. Clustering and annotating the prey-prey correlation of the interacting partners of ERH, we see over 30 proteins known to be involved in nuclear speckle formation (Supplemental Figure 4C). However, ERH’s role as a TREX component and how it affects nuclear speckles is poorly understood68. We thus measured if the absence of ERH affects nuclear speckle formation. Nuclear speckles are membraneless organelles that undergo liquid-liquid phase separation and are highly enriched with splicing factors70–75. Depletion of ERH protein (Figure 5B), reduced the numbers of nuclear speckles significantly (Figure 5C, 5D).
Since nuclear speckles and TREX components are known to facilitate mRNA export out of the nucleus, we investigated the subcellular localization of poly(A) RNAs using fluorescent oligo-dT probes. Knockdown (KD) of ERH significantly increased the amount of poly(A) RNA in the nucleus (Figure 5E), suggesting a reduction in the nuclear export of mRNAs. To test if nascent RNA localization was affected by the lack ERH expression, we also performed a 5-EU pulse-chase experiment. ERH KD had a significant increase relative to control KD in the amount of nuclear RNA after 30 minutes of EU labeling similar to the poly(A) signal (Figure 5F). Four hours after the chase, ERH KD cells still had significantly more nuclear intensity of EU labeled RNA than control cells suggesting an accumulation of nuclear RNA (Figure 5G). We conclude that one of ERH’s roles is to mediate nuclear speckle formation and facilitate the export of poly(A) RNA out of the nucleus.
The canonical core spliceosome protein SNRNP200 interacts with RNA granule proteins CAPRIN and G3BP1.
The SNRNP200 protein exhibits the second highest BCS and is part of the U5 snRNP that unwinds the U4/U6 RNA duplex76–78. Our network indicates that SNRNP200 directly interacts with U5 snRNP proteins PRPF8 and CD2BP2. SNRNP200 also interacts in an RNA-shielded manner with the splicing factors EFTUD2, AQR, and SF3B4 (Figure 6A, Supplemental Figure 5A), which are part of the splicing B complex79. Interestingly, our network also showed that SNRNP200 interacts directly with proteins participating in RNA granule assemblies, such as CAPRIN1, G3BP1, USP10, and FMR1, and in an RNA-mediated manner with IGF2BP1, IGF2BP3, G3BP2, ATXN2L, FXR1, and FXR2. These interactions concur with the recent finding that SNRNP200 interacts with the central stress granule protein CARPIN1 in neuronal-like cells80, especially during oxidative stress conditions. Since G3BP1 and CAPRIN are mostly found in the cytoplasm, our results suggest that SNRNP200 forms two distinct complexes, one in the nucleus performing its well-known function in the U5 snRNP, and one in the cytoplasm whose role has not yet been explored.
Figure 6. Cytoplasmic SNRNP200 has distinct binding profiles and protein partners.

A. Cytoscape93 plot of SNRNP200 network showing only direct and RNA-mediated interactions for clarity. Proteins are colored by their previously reported mRNA life-cycle step.
B. tSNE plot of SNRNP200 whole-cell and cytoplasmic SNRNP200 eCLIP binding preference in the context of published ENCODE eCLIP datasets.
C. Metadensity profiles of whole-cell (purple) vs cytoplasmic SNRNP200 (orange) from eCLIP data.
D. Genome browser tracks of three representative transcripts (WEE1, ZC3H4, and IRFBP2) to show the eCLIP binding pattern for whole-cell SNRNP200 and cytoplasmic SNRNP200. Yellow highlights are regions within the 3’UTR where there is more signal in the cytoplasmic sample compared to the whole cell. Blue highlights indicate areas around splice sites. Grouped autoscale read counts are in the top track for each gene.
E. Most significant HOMER motif for whole-cell and cytoplasmic SNRNP200.
F. Bargraph of the RBPs with the highest Jaccard index to whole-cell SNRNP200. Inset shows the Cytoscape93 plot and interaction types of the RBPs with the highest Jaccard indexes.
G. Bargraph of the RBPs with the highest Jaccard index to cytoplasmic SNRNP200. Inset shows the Cytoscape93 plot and interaction types of the RBPs with highest Jaccard indexes. See also Figure S5 and Table S7.
To evaluate SNRNP200 protein-RNA target interactions separately in the nucleus and cytoplasm, we performed eCLIP assays in whole-cell and cytoplasmic fractions of HEK293XT cells. Global visualization of SNRNP200 gene region preferences, compared with all other ENCODE eCLIP datasets, clearly shows that whole-cell SNRNP200 target preferences are grouped with other proximal splice-site binding RBPs, while cytoplasmic SNRNP200 data clusters with RBPs that bind 3’UTRs (Figure 6B, Supplemental Table 7). Previous literature and biochemical assays have mapped and characterized SNRNP200 binding to U4 and U6 snoRNAs81. Our observations that SNRNP200 binds splice sites supports a possible function in the catalytic activity of spliceosomes, which has only been described in yeast81. We found that over 80% of whole-cell SNRNP200 binding sites are near splice sites, located directly on 5’ and 3’ splice sites, or within the CDS near exon-intron boundaries (Figure 6C and D, Supplemental Figure 5B). Moreover, whole-cell SNRNP200 binds to most of the splice sites of the expressed transcripts (n = 6,837; log2fc > 2, p-value < 0.005) within the cell. These findings suggest a crucial role for SNRNP200 in the catalytic activity of the spliceosome on most transcripts. In contrast, we found that around 60% of cytoplasmic SNRNP200 binding sites are located within the 3’UTR (Supplemental Figure 5B and C), with the strongest enrichment observed around 100 nucleotides before the poly(A) tail and 50 nucleotides after the stop codon (Figure 6C and D)82. The top terms in the GO analysis of the transcripts bound by cytoplasmic SNRNP200 are ‘viral processing’ and ‘negative regulation of RNA metabolic processing’ (Supplemental Figure 5D), suggesting that SNRNP200 regulates transcripts that encode proteins important for RNA processing. The most significant motif for whole-cell SNRNP200 is the U1 snRNP binding sites NAGGUAAGN (Figure 6E). Interestingly, the top motif for cytoplasmic SNRNP200 is the Pumilio response element, UGUAHA. These results show an increase in signal in the 3’UTR for cytoplasmic SNRNP200, while most of the signal for whole-cell SNRNP200 is concentrated near the 5’ splice sites. Our results also highlight the importance of performing eCLIP in different subcellular locations to capture differences in how an RBP binds RNA depending on subcellular context.
As RBPs that interact are more likely to bind to similar transcripts, we calculated the Jaccard index on binding sites bound by either whole-cell or cytoplasmic SNRNP200 and compared them with the K562 ENCODE eCLIP datasets (Figure 6F and G). Whole-cell SNRNP200 shared the highest number of binding sites with splicing factors and B complex components BUD13, PRPF8, and AQR, which we see in our PPIs83. Conversely, cytoplasmic SNRNP200 displayed the strongest correlation with the P-body proteins DDX6 and PUM284, as observed from ENCODE data, and the RNA granule proteins CAPRIN and G3BP1, for which we generated the CLIP data. Unlike DDX6, CAPRIN, and G3BP1, PUM2 does not interact with SNRNP200 in both our PPI network and others, suggesting they may compete for binding sites. These findings suggest that depending on its subcellular localization, SNRNP200 demonstrates target occupancy differences in both the maturation of RNA transcripts and the location of binding sites. Excitingly, these observations support the concept that SNRNP200 forms two distinct RNP complexes, each with unique functions.
To explore the transcriptome-wide binding profiles of these interacting RBPs, we plotted Metadensity profiles of transcripts that were bound by SNRNP200 and G3BP1, SNRNP200 and CAPRIN, or SNRNP200 alone (Supplemental Figure 5E)85. This analysis tests the hypothesis of whether specific partner proteins influence the binding profile or binding enrichment level. On transcripts that both G3BP1 and SNRNP200 bind, G3BP1 binds the 5’ end of the last exon within the coding region, and SNRNP200 is highly enriched near the 3’ end of the last exon (3’UTR) compared to transcripts that SNRNP200 binds without G3BP1. CAPRIN also has a more pronounced binding profile near the 5’ and 3’ ends of the first and last exons that are bound by both SNRNP200 and CAPRIN. We also find that transcripts bound by both G3BP1 or CAPRIN and SNRNP200 are more highly enriched than transcripts that were bound by G3BP1 or CAPRIN alone (Supplemental Figure 5F).
SNRNP200 localizes to stress granules independent of its spliceosome partners
Given that SNRNP200 interacts with multiple proteins found within stress granules, we confirmed these interactions using immunofluorescence (IF) and high-resolution microscopy. While SNRNP200 is present in both the nucleus and cytoplasm, it predominantly co-localizes with G3BP1 in the cytoplasm of unstressed HEK293XT cells. However, the co-localization is even more pronounced under arsenic stress conditions (Figure 7A). These findings extend beyond HEK293XT cells, as a previous study observed that SNRNP200, G3BP1, and CAPRIN also co-localize in the neuronal-like cell line SH-SY5Y80.
Figure 7. Stress granule factor SNRNP200 binds the 5’UTRs and 3’UTRs of targets during arsenic stress.

A. Immunofluorescence of SNRNP200, G3BP1, and DAPI in HEK293XT at baseline and one hour after arsenic stress. Line scan analysis indicates levels of localization for G3BP1 and SNRNP200 in μm.
B. Immunofluorescence of PRPF8, G3BP1, and DAPI in HEK293XT at baseline and one hour after arsenic stress. Line scan analysis indicates levels of localization for PRPF8 and G3BP1 in μm.
C. tSNE plot of SNRNP200 whole-cell and cytoplasmic SNRNP200 eCLIP samples during arsenic stress.
D. Metadensity profiles of cytoplasmic SNRNP200 at baseline (purple) vs cytoplasmic SNRNP200 (red) during stress.
E. Genome browser tracks showing eCLIP read density for cytoplasmic SNRNP200 without (purple) and with (red) stress at the transcripts RANBP1, ATP1B3, and SDC2. The highlighted regions are areas within the 5’UTR with a higher signal in stress cytoplasmic samples than in baseline cytoplasmic samples. Read counts are in the top right corner for each gene.
F. Cumulative distribution plot of the fraction of RNA molecules in stress granules88. G3BP1 stress targets are grouped in blue, and cytoplasmic SNRNP200 targets in red.
G. Cumulative distribution plot of the RNA expression fold change (stress/baseline)88 for cytoplasmic SNRNP200 targets. For the remaining plots, orange lines represent transcripts bound within the CDS (n = 370). Dark green represents 3’UTR bound transcripts (n = 813), and light green represents 5’UTR (n = 440) bound targets.
H. Right panel: Cumulative distribution plot of the ratio of polysome enrichment under stress compared to baseline for cytoplasmic SNRNP200 targets90. Left panel: Cumulative distribution plot of translation efficiency (ribosome footprint/RNA levels) for cytoplasmic SNRNP200 targets during arsenic stress89. See also Figure S6 and Table S7.
Moreover, we confirmed that SNRNP200 depletion affects stress granule formation, consistent with previous findings86 (Supplemental Figure 6A). SNRNP200 tightly interacts with the splicing factor PRPF8, and these two proteins have been shown to assemble in the cytoplasm and be transported to the nucleus87. However, our PPI network and IF data (Figure 7B, Supplemental Figure 6B) show that PRPF8 does not localize with granule proteins at baseline or during stress. Specifically, the SEC data show that PRPF8 and SNRNP200 elute together in larger molecular weight fractions (5-15), whereas G3BP1 and SNRNP200 elute together in smaller molecular weight fractions (30) without PRPF8 (Supplemental Figure 6C). Together with our co-IP data from our network, these observations suggest that G3BP1 and SNRNP200 form a functional RNP in the cytoplasm without PRPF8 in what is likely a distinct role outside of the spliceosome.
SNRNP200 promotes translation of CDS bound targets during stress
Next, we identified the RNA targets of SNRNP200 in HEK293XT cells during one hour of arsenic stress. We mapped the binding sites of whole-cell and cytoplasmic SNRNP200 and compared them to the targets from unstressed HEK293XT cells (Supplemental Figure 6D, E). The most significant binding motif from stressed whole-cell SNRNP200 is the same as it was at baseline (Supplemental Figure 6F). Whole-cell SNRNP200 has a very similar profile in both stress and non-stress, enriched for both 5’ and 3’ splice sites and binding a similar number of transcripts between conditions (Figure 7C, Supplemental Figure 6G). However, during arsenic stress, cytoplasmic SNRNP200 binds transcripts in the CDS and the 5’UTR in a manner distinct from the binding pattern of cytoplasmic SNRNP200 at baseline (Figure 7D, Supplemental Figure 6F). Specifically, the Metadensity plot shows, under stress, enriched binding 80 nucleotides into the first exons and less enrichment towards the distal 3’UTR compared to cytoplasmic SNRNP200 at baseline.
Directly comparing the cytoplasmic RNA targets during baseline and stress, we see a distinct set of mRNAs that are bound in just the stress condition, with nearly 60 transcripts that gain binding sites during arsenic stress (Figure 7E). GO analysis of these transcripts identified the most significant terms as ‘protein localization to endoplasmic reticulum’ and ‘viral processing’, indicating that SNRNP200 might play a role in protein trafficking and RNA metabolism (Supplemental Figure 6H).
To examine how cytoplasmic SNRNP200 regulates transcripts, we compared its target profiles with those of G3BP1 during arsenite-induced stress. First, we overlapped SNRNP200 and G3BP1’s targets with transcripts that are known to be enriched in stress granules during arsenite treatment88. We found that G3BP1-bound RNAs during stress are significantly enriched within stress granules in contrast to those of cytoplasmic SNRNP200. The targets of SNRNP200 are neither enriched nor depleted in stress granules (Figure 7F, Supplemental Figure 6I). Additionally, analysis of transcript lengths bound by both G3BP1 and SNRNP200 showed that SNRNP200 prefers binding to significantly shorter transcripts, with an average length of approximately 3800 nucleotides, and these transcripts have a higher percentage of GC content compared to both non-targets and G3BP1 targets (Supplemental Figures 6J and K).
To explore the regulatory impact of cytoplasmic SNRNP200 under stress, we analyzed RNA levels, ribosome profiling data89, and polysome sequencing data90 obtained during arsenite exposure. We found that on average, cytoplasmic SNRNP200 CDS targets are upregulated at the RNA level (Figure 7G) compared to UTR-bound targets and non-targets during arsenic stress. The upregulation suggests that these transcripts are either newly synthesized or stabilized during the early arsenite stress response. Additionally, cytoplasmic SNRNP200-bound CDS targets exhibit a higher ribosome occupancy, indicative of enhanced translation efficiency, relative to UTR-bound targets and non-targets (Figure 7H, right panel). These CDS-bound targets also have a significant enrichment within polysomes under stress conditions compared to non-targets (Figure 7H, left panel). This data suggests that SNRNP200 licenses specific subsets of mRNAs to be translated during cellular stress. Notably, of the 370 CDS targets, 51 of them are 5’ Terminal OligoPyrimidine (TOP) mRNAs, constituting over 53% of all TOP mRNAs (Supplemental Figure 6L). TOP mRNAs are preferentially translated during cellular stress and encode for ribosomal proteins and elongation factors91. Our study, leveraging the PPI network and follow-up experiments, reveal a unique role for SNRNP200 outside of its canonical function in the spliceosome.
DISCUSSION
In this study, we developed an RNA-aware PPI network centered around 92 RBPs involved in several distinct stages of the mRNA life-cycle. RNase treatments allowed us to map the RNA-dependency of these PPIs. We augmented our interactome with SEC-MS data that enabled us to add substructure to the IP-MS network by the addition of prey-prey interactions. Combining IP-MS and SEC-MS allows us to predict mRNA life-cycle functions for the large number of our PPI preys that have been detected as RBPs by previous RNA-interactome studies but not yet functionally characterized.
Based on annotations in the Human Protein Atlas (HPA)54, we found that proteins that interact in our network are significantly more co-localized than expected by chance. However, as also observed in the OpenCell network in HEK293 cells29, many interactions did not have any localization overlap. While lysis artifacts likely contribute to this lower co-localization, current localization information does not fully capture proteins’ subcellular localizations (ie. SNRNP200 is only assigned a nuclear localization in HPA). Factors such as cell-type differences, RBPs with multiple functions, or variations in protein stoichiometry across subcellular locations may play a role. As indicated by our network, many RBPs may have multiple simultaneous or context-dependent subcellular localizations to carry out functions at different stages of the mRNA life-cycle. These findings highlight the complexity of protein localization and the need for further investigation to better understand the dynamic and multifaceted nature of RBPs in cellular processes.
About 50% of preys in the network are connected to at least two life-cycle stages, indicating a greater degree of crosstalk between the different stages and processes than previously appreciated. A systematic BCS analysis identified proteins most responsible for the networks’ connectivity. Follow-up work on ERH and SNRNP200, the two most connected proteins in the network, showed how the network can be leveraged to gain new biological insight into proteins that play important roles across the life-cycle. Our study revealed unexpected characterization of SNRNP200’s functions, beyond binding and unwinding the U4-U6 RNA duplex. eCLIP assays show that SNRNP200 binds splice sites of many transcripts, suggesting involvement in the catalytic activity of the spliceosome81. We also characterized the cytoplasmic function of SNRNP200, as evidenced by its interactions with RNA granule proteins at cellular baseline and its binding to the 3’UTRs of various transcripts in the cytoplasmic fraction. Under cellular stress, SNRNP200 was found to be enriched in the CDS and the 5’UTRs of a specific set of mRNAs and we hypothesize that SNRNP200 is involved in their translational regulation. Interestingly, SNRNP200 has been found enriched in amyotrophic lateral sclerosis (ALS) patient neural protein aggregates80,92, which places it at the intersection of toxic protein aggregation and mRNA processing dysregulation.
In summary, we have developed an RNA-aware PPI network centered around RBPs and focused on the mRNA life-cycle. We have built an interactive viewer for easy exploration of the data which is available at https://github.com/mjlab-Columbia/rbp_analysis_interactive_tool. Furthermore, our network analysis has led to the identification of key RBPs and their associated proteins, while generating functional hypotheses for uncharacterized proteins. Our approach, combining two complementary methods, not only provides insights into fundamental principles governing mRNA processing and regulation, but also serves as a valuable resource for the scientific community.
Limitations of the Study
Our interactome represents a significant advancement in understanding mRNA processing and regulation, but several considerations warrant further investigation. Despite minimizing artifacts in our interactome by using endogenous antibodies and providing orthogonal support from two methods - IP-MS and SEC-MS, some interactions may be technical artifacts due to cellular lysis or antibody cross-reactivity. Furthermore, both methods select for rather stable interactions due to the time frame of the experiment and because no crosslinking is performed. Therefore, future approaches that favor transient interactions could be integrated with the RBP interactome described here to provide a more complete picture.
The characterization of RNA-shielded interactions requires further exploration, particularly their biophysical properties. Possible explanations for RNA-shielded interactions include 1) epitope exposure in the bait’s non-RNA bound state, 2) liberation of the bait from inaccessible large RNP complexes upon partial RNA digestion, or 3) spurious post-lysis interactions driven by RNase treatment. Many of these RNA-shielded interactions are part of large RNP complexes and have been previously reported in published PPI networks, indicating that they represent biologically functional interactions detected due to bait and epitope unmasking. However, we cannot rule out artifactual post-lysis interactions for this or the other two interaction types.
Additionally, the assignment of interactions as direct, RNA-mediated, or RNA-shielded depends on the cutoffs used to determine interacting proteins for each IP bait (Supplemental Figure 7). Stringent cutoffs may call an interaction RNA-mediated because it only passes our cutoffs in the RNase-minus condition, despite still being enriched, but below our cutoff criteria, in the RNase-plus IP condition. Such an interaction could therefore be described as enriched in RNase-minus. If we require an interaction to pass our stringent cutoffs in one RNase condition but allow more lenient cutoffs (log2 FC > 1, p-value < 0.05) in the other, we see the expected shift towards more direct interactions (1,954 direct, 656 RNA-mediated, 1,435 RNA-shielded, and 305 undetermined, compared to 885, 1,107, 2,053, and 305 respectively). Therefore, in Supplemental Table 2 we provide for both RNase-plus and -minus conditions, the log2FC and p-values for all interactions that passed our stringent cutoffs in any conditions. Using this table scientists can apply different cutoffs to qualify interactions as direct, RNA-mediated or -shielded.
Finally, another limitation of the study is the inability to fully separate out the nuclear function from the cytoplasmic SNRNP200 function. The knockdown of SNRNP200 results in widespread splicing and differential expression changes across the transcriptome. Consequently, discerning the cytoplasmic-specific functions in a traditional knockdown remains challenging. To overcome this hurdle, a more sophisticated set of experiments with genetic tools will need to be designed to tease apart the cytoplasmic-specific function of SNRNP200.
STAR Methods
RESOURCE AVAILABILITY
Lead Contact
Further information and requests for resources and reagents should be directed to and will be fulfilled by the Lead Contact, Gene Yeo (geneyeo@ucsd.edu).
Materials Availability
This study did not generate new unique reagents.
Data and Code availability
Raw IP-MS and SEC-MS data is deposited at the MassIVE repository. Interactive IP-MS + SEC-MS interactome explorer is available on github. eCLIP data is deposited at GEO and all are publicly available as of the data of publication. Accession numbers are listed in key resources table. Original western blot and microscopy images have been deposited at Mendeley and are publicly available as of the date of publication. The DOI is listed in the key resources table.
This paper does not report any original code
Any additional information required to reanalyze the data reported in this paper is available from the lead contact upon request
Key Resources Table
| REAGENT or RESOURCE | SOURCE | IDENTIFIER |
|---|---|---|
| Antibodies | ||
| α-SC35 (SRSF2) | Abcam | ab11826 |
| α-ERH | Bethyl | A305-401A |
| α-G3BP1 | MBL | RNO48PW |
| α-SNRNP200 | Abcam | ab176715 |
| α-PRPF8 | Bethyl (IP), Ab185547 (IF) | A303-920A, Ab185547 |
| Donkey α-Mouse IgG, Alexa Fluor 555 | Thermo | A-31570 |
| Donkey α-Rabbit IgG, Alexa Fluor 647 | Thermo | A-31573 |
| α-PCF11 (WB) | Bethyl | A303-706A |
| α-YTHDCF1 (WB) | Bethyl | A305-096A |
| α-TUBA4A (WB) | Abcam | ab7291 |
| Chemicals, peptides, and recombinant proteins | ||
| RNase | Promega | Cat#527491 |
| Trypsin | Promega | Cat#487603 |
| TMT11-131C label reagent | Thermo Scientific | Cat#A34808 |
| 5-Ethynyl uridine | Thermo Fisher Scientific | Cat#E10345 |
| Deposited data | ||
| Raw MS data | This paper | ftp://massive.ucsd.edu/v06/MSV000093915/ |
| eCLIP data | This paper | GEO: GSE230717 |
| Interactive IP-MS+SEC-MS interactome explorer | This paper | https://github.com/mjlab-Columbia/rbp_analysis_interactive_tool |
| Raw Images (Mendeley) | This paper | doi: 10.17632/6n6c8bbgd7.1 |
| Uniprot human reference proteome | The UniProt Consortium, 2023 | https://www.uniprot.org/proteomes/UP000005640 |
| Human reference genome NCBI build 38, GRCh38 | Genome Reference Consortium | http://www.ncbi.nlm.nih.gov/projects/genome/assembly/grc/human/ |
| Experimental models: Cell lines | ||
| Lenti-X 293T Cell Line | Takara Bio | Cat#632180 |
| Oligonucleotides | ||
| shRNA ERH 1 | Sigma | Cat #SHCLNG |
| shRNA ERH 2 | Sigma | Cat #SHCLNG |
| shRNA SNRNP200 1 | Sigma | Cat #SHCLNG |
| shRNA SNRNP200 2 | Sigma | Cat #SHCLNG |
| T30-ATT-488 | Biosearch Technologies | T30-ATT-488 |
| Software and algorithms | ||
| SpectroMine v3.2 | Biognosys97 | https://biognosys.com/software/spectromine/ |
| Spectronaut v16.0 | Biognosys; Bruderer et al.97 | https://biognosys.com/software/spectronaut/ |
| CCprofiler | Heusel et al.42 | https://github.com/CCprofiler/CCprofiler |
| Skipper | Boyle et al.103 | https://github.com/YeoLab/skipper/ |
| Skewer | Jiang et al.104 | https://github.com/relipmoc/skewer |
| Fastp 0.11.5 | Chen et al.105 | https://github.com/OpenGene/fastp |
| STAR v 2.7.6 | Dobin et al.106 | https://github.com/alexdobin/STAR |
| Fiji | Schindelin et al.107 | https://imagej.net/software/fiji/ |
| Metadensity (v0.0.1) | Her et al.85 | https://github.com/algaebrown/Metadensity |
| IGV | Robinson et al.82 | https://igv.org/doc/desktop/ |
| Cytoscape | Shannon et al.93 | https://cytoscape.org/ |
| Other | ||
| Yarra SEC-4000 column | Phenomenex | Cat#00H-4514-K0 |
EXPERIMENTAL MODEL AND STUDY PARTICIPANT DETAILS
Cell Culture
HEK293XT (Takara Bio Lenti-X 293T, #632180) cells were cultured in DMEM containing L-glutamine and sodium pyruvate supplemented with 10% Fetal Bovine Serum, Penicillin (100 U/mL), and Streptomycin (100 μg/mL). Cells were grown to 90–100% confluency before passage and were harvested at passages 6–20.
For harvesting, confluent HEK293XT cells in a 10 cm plate were gently washed in cold 1X PBS and dissociated from the plate with a cell scraper. Cells were then pelleted in cold PBS at 500 g for 5 minutes. Cells were then resuspended in 1 ml of ice-cold PBS and transferred to 1.5 ml Protein Lo-Bind tubes to be pelleted again and flash-frozen in liquid nitrogen and stored at −80 °C.
METHOD DETAILS
Immunopurifications
Cell pellets were thawed on ice and lysed in 400 μl of lysis buffer (150 mM NaCl, 50 mM Tris pH 7.5, 1% IGPAL-CA-630, 5% glycerol, and protease and phosphatase inhibitors), and split evenly (~200 μl) into separate tubes. Half of the lysate was treated with 5 μl of 10 mg/ml RNase (Promega:527491) and both lysates (+/− RNase) were incubated on ice for 20 minutes. Each tube (+/− RNase conditions) was centrifuged at 4°C for 10 minutes at 14,000 g. The total protein concentration of each lysate was measured using a BCA assay to ensure that each sample had between 1–2 mgs of total protein.
100 μl of Dynabeads Protein G (Invitrogen:01200616) magnetic beads were washed 3 times in 1 ml lysis buffer and then conjugated to 10 μg of endogenous antibody (Table S1). Bead-antibody conjugation was then added to the cell lysate and incubated overnight at 4°C on the rotator. The following day, samples were placed on a magnetic bead separator, the supernatant was removed, and samples were washed 2 times with wash buffer (150 mM NaCl, 50 mM Tris pH 7.5, 5% glycerol) containing 0.05% IGEPAL CA-630 and 2 times with wash buffer without IGEPAL. Beads were then incubated in 80 μl of on-bead buffer (2 M urea, 50 mM Tris pH 7.5, 1 mM DTT, and 5 μg/mL Trypsin (Promega:487603)) for 1 hour at 25°C on a shaker (1000 rpm). After one hour, beads were placed on a magnetic bead separator and 80 μl of supernatant was transferred to a new tube. The beads were then washed twice with 60 μL of HPLC buffer (2 M urea and 50 mM Tris pH 7.5). The supernatant from each wash was combined with the on-bead digest for a total of 200 μl per sample. Samples were then spun at 5000 g, transferred to a new tube, and stored at −80°C.
Bait selection
106 RBPs with well-described roles in RNA processing at one or more mRNA life-cycle steps and with available ENCODE-validated23,24, immunopurification (IP)-grade antibodies that recognize the endogenous RBP were selected for IP-MS. Upon initial creation of the PPI network, prey proteins ERH, DLD, DLST and RUVBL2 were identified as central to the network or involved in unexpected interactions and were subsequently targeted for IP-MS and incorporated into the full network.
Size Exclusion Chromatography
Preparation of samples for SEC
SEC samples were prepared as described in Bludau et al 202045, with minor modifications. HEK293XT cells (20–30 million per replicate, n=3) were harvested at ~80% confluence by scraping in ice cold 1X PBS with 5nM EDTA, washing and pelleting, before being flash frozen in liquid nitrogen and stored in −80°C. Pellets were lysed in ice cold lysis buffer (150 mM NaCl, 50 mM Tris pH 7.5, 1% IGEPAL-CA-630, 5% Glycerol; same lysis conditions as for IP) supplemented with 50 mM NaF, 2 mM Na3VO4, 1 mM μMSF, and 1X protease inhibitor cocktail (Sigma). Half of the lysate was treated with 5 μl of 10 mg/ml RNase (Promega:527491) and both lysates (+/− RNase) were incubated on ice for 30 minutes. Cell lysates were then clarified by centrifugation for 10 minutes at 10,000 g and 4°C, followed by ultracentrifugation for 20 minutes at 100,000 g and 4°C. Samples then underwent buffer exchange into SEC buffer (50 mM HEPES pH 7.5, 150 mM NaCl and 50 mM NaF) to dilute lysis detergents on a 30 kDa Amicon ultra-0.5 centrifugal filter (Sigma). Buffer exchange was done in iterative steps of no larger than 1:3 dilutions to reach a final dilution ratio of 1:50 (IP lysis buffer : SEC buffer). The lysate underwent a final clarification by 5 minutes of centrifugation at 17,000 g and 4°C. The supernatant concentration was measured by Nanodrop spectrophotometer (Thermo Scientific) and adjusted to 20 mg/mL.
SEC
Size exclusion was performed on an Agilent 1260 Infinity II system operated with Agilent OpenLAB ChemStation software (version C.01.09). 2 mg of cell lysate at 20 mg/mL was loaded onto a Yarra SEC-4000 column (Phenomenex 00H-4514-K0, 3 μm silica particles, 500 A pores, column dimensions: 300 × 7.8 mm) and fractionated in SEC running buffer (50 mM HEPES pH 7.5, 150 mM NaCl) at a flow rate of 0.5 mL/min. 100 μL fractions were collected between minutes 11 to 30 into 96 Well DeepWell Polypropylene Microplates (Thermo Scientific).
Total Proteome
Lysis
HEK293XT cells from one 10 cm plate per replicate (n=3) were harvested at ~80% confluence by scraping in ice cold 1X PBS, washing and pelleting, before being flash frozen in liquid nitrogen and stored in −80°C. Pellets were lysed in 8M urea lysis buffer (8 M urea, 75 mM NaCl, 50 mM HEPES pH 8.5, 1 mM EDTA) and incubated on a hula mixer at RT for 30 minutes. Lysates were clarified by centrifugation at 14,000 g for 10 minutes at RT. Protein concentrations were measured by Pierce BCA protein assay kit (Thermo Scientific) and divided into 40 μg aliquots.
LC-MS/MS
IP sample preparation
Spike-in samples (in 50 μL aliquots) were generated by combining equal volumes of all IP and control samples in the experiment. 50 μL of partially digested proteins were used per IP, and spike-in samples were processed identically. Disulfide bonds were reduced with 5 mM dithiothreitol (DTT) for 45 minutes at 600 rpm and 25°C. Cysteines were subsequently alkylated with 10 mM iodoacetamide (IAA) for 45 minutes in the dark at 600 rpm and 25°C. Samples were then further digested by adding 0.5 μg sequencing grade modified trypsin (Promega) for 16 hours at 600 rpm and 25°C. After digestion, samples were acidified with a final concentration of 1% formic acid. Tryptic peptides were desalted on C18 StageTips according to (Rappsilber, Mann, and Ishihama 2007) dried in a vacuum concentrator and reconstituted in 30 μL of 50 mM HEPES pH 8.5 for TMT labeling.
TMT labeling and multiplexing
TMT11 mixes were designed to minimize overlap between IP baits, such that baits A and B were not in the same mixes across 2 replicates and such that baits within life-cycle stages were well divided across mixes. Each TMT11 mix contained 1 spike-in (channel 126), 3 RNase treated IPs, 3 non-RNase treated IPs, 2 RNase treated IgG controls, and 2 non-RNase treated IgG controls (Table S1).
Peptides were labeled by addition of a third of an aliquot of TMT11–131C label reagent (Thermo Scientific) in a final volume of 20% acetonitrile and incubated for 1 hour at 600 rpm and 25°C. Hydroxylamine at a final concentration of 0.3% was added to quench the reaction. The samples in each mix were combined, dried to at least 50% of the pooled volume in a vacuum concentrator, acidified with a final concentration of 1% formic acid, and desalted on C18 StageTips. The eluted pools were fully dried in a vacuum concentrator and reconstituted in 15 μL of 3% acetonitrile/0.2% formic acid for LC-MS/MS.
TMT LC-MS/MS
5 μL of total peptides were analyzed on a Waters Μ-Class UPLC using a 25 cm Thermo EASY-Spray column (2 μm, 100A, 75 μm x 25 cm) coupled to a benchtop ThermoFisher Scientific Orbitrap Q Exactive HF mass spectrometer. Peptides were separated at a flow rate of 400 nL/min with a 190 min gradient, including sample loading and column equilibration times. Data was acquired in data-dependent mode. MS1 spectra were measured with a resolution of 120,000, an AGC target of 5e6 and a mass range from 300 to 1800 m/z. MS2 spectra were measured with a resolution of 60,000, an AGC target of 1e5 and a mass range from 200 to 2000 m/z. MS2 isolation windows of 0.8 m/z were measured with a normalized collision energy of 33 and a fixed first mass of 110 m/z.
SEC sample preparation
Protein concentrations of the SEC fractions were measured by Pierce BCA protein assay kit (Thermo Scientific). Equal volumes (~80 pL) from each of the fractions containing proteins (10 – 66) were processed. Proteins were denatured by incubation in an equal volume of urea buffer (8 M urea, 75 mM NaCl, 50 mM HEPES pH 8.5, 1 mM EDTA) for 20 minutes at 600 rpm and 25°C in 96 Well DeepWell Polypropylene Microplates. Disulfide bonds were reduced with 5 mM dithiothreitol (DTT) for 45 minutes at 600 rpm and 25°C. Cysteines were subsequently alkylated with 10 mM iodoacetamide (IAA) for 45 minutes in the dark at 600 rpm and 25°C. Samples were diluted 1:3 with 50 mM HEPES pH 8.5 and then digested by a 1:50 (trypsin to protein) ratio of sequencing grade modified trypsin (Promega) for 16 hours at 600 rpm and 25°C. After digestion, samples were acidified with a final concentration of 1 % formic acid. Tryptic peptides were desalted on C18 StageTips in 96 Well DeepWell Polypropylene Microplates, dried in a vacuum concentrator, and reconstituted in 3% acetonitrile/0.2% formic acid to a final concentration of 0.5 μg/pL.
SEC LC-MS/MS
5 μL of total peptides were analyzed on a Waters M-Class UPLC using a 25 cm Thermo EASY-Spray column (2 μm, 100Å, 75 μm x 25 cm) coupled to a benchtop ThermoFisher Scientific Orbitrap Q Exactive HF mass spectrometer. Peptides were separated at a flow rate of 400 nL/min with a 70 min gradient, including sample loading and column equilibration times. Data was acquired in data-independent mode. MS1 Spectra were measured with a resolution of 120,000, an AGC target of 5e6 and a mass range from 350 to 1650 m/z. 15 isolation windows of 87 m/z were measured at a resolution of 30,000, an AGC target of 3e6, normalized collision energies of 22.5, 25, 27.5, and a fixed first mass of 200 m/z.
Total proteome sample preparation
One 40 μg aliquot was used per replicate. The lysate volume was increased to 80 μL with 50 mM Tris pH 8. Disulfide bonds were reduced with 5 mM dithiothreitol (DTT) for 45 minutes at 600 rpm and 25°C. Cysteines were subsequently alkylated with 10 mM iodoacetamide (IAA) for 45 minutes in the dark at 600 rpm and 25°C. Samples were then digested by a 1:50 (trypsin to protein) ratio of sequencing grade modified trypsin (Promega) for 16 hours at 600 rpm and 25°C. After digestion, samples were acidified with a final concentration of 1% formic acid. Tryptic peptides were desalted on C18 StageTips, dried in a vacuum concentrator, and reconstituted in 3% acetonitrile/0.2% formic acid to a final concentration of 0.5 μg/μL for LC-MS/MS.
Total proteome LC-MS/MS
5 μL of total peptides were analyzed on a Waters M-Class UPLC using a 15 cm IonOpticks column (1.7 μm, 120Å, 75 μm x 15 cm) coupled to a benchtop ThermoFisher Scientific Orbitrap Q Exactive HF mass spectrometer. Peptides were separated at a flow rate of 400 nL/min with a 150 min gradient, including sample loading and column equilibration times. Data was acquired in data-independent mode. MS1 Spectra were measured with a resolution of 120,000, an AGC target of 3e6 and a mass range from 350 to 1600 m/z. 31 isolation windows of 40 m/z were measured at a resolution of 30,000, an AGC target of 3e6, normalized collision energies of 22.5, 25, 27.5, and a fixed first mass of 200 m/z.
IP-MS Analysis
Searches
Raw data were searched with SpectroMine v3.2 (Biognosys) using a UniProt database (Homo sapiens, UP000005640)96 under default TMT11 quantification settings but without cross-run normalization or missing value imputation. Protein group data were exported for subsequent analysis.
Normalization
Normalization and subsequent analysis were performed in R v3.6.3. Contaminants and immunoglobulin proteins were removed, and samples’ raw intensity values were selected for normalization. iBAQ correction was performed in a TMT11 mix wise manner using “Top3MS1Quantity” values. Missing values were maintained as NAs. Parts per million (ppm) were calculated for each sample and a pseudocount of 1 was added before the data was log2 transformed. Batch normalization was performed next. Briefly, for each sample, all the other RNase treatment matched samples in the mix were averaged and subtracted from the sample in a protein-wise manner. Spike-in samples were normalized by subtraction of the entire rest of the mix as they contained a mix of RNase treated and untreated samples. Batch corrected samples were then z scored to allow easier between-sample comparisons. IP samples, where the bait protein itself was not enriched within the top 5% of measured proteins or where the data were too sparse for reliable analysis, were considered failed IPs and were removed from further analysis. After this filtering step, 92 bait proteins had at least 2 replicates in one RNase treatment condition and thus remained in the dataset.
Determining high confidence interacting proteins
High-confidence interacting proteins (HCIPs) for each of the 92 bait proteins were identified for both RNase treatment and non-treatment conditions. HCIPs were determined to be preys that were enriched within the top 5% of measured proteins in all replicates, and significantly enriched in the IP compared to background (as measured by the combined IgG control and failed IP signal [log2 ratio IP/background > 1; Wilcoxon test p-value < 0.05 or 0.01 depending the bait signal]).
Characterizing the RNA-dependence of interactions
HCIPs identified in both the RNase treatment and non-treatment IPs for a particular bait were called “direct interactors.” HCIPs identified in only RNase non-treatment were called “RNA-mediated interactors,” and HCIPs identified in only RNase treatment were called “RNA-shielded interactors.” As 10 IP baits failed to enrich the bait entirely in either the RNase treatment or non-treatment condition, their interactors’ RNA-dependence could not be determined and they were labeled as “undetermined.” These HCIPs with characterized interaction types were then combined for all IP baits to generate the IP-MS network.
SEC-MS Analysis
Searches
Raw data were searched by Spectronaut v16.0 (Biognosys)97 in the directDIA method, using a human UniProt database (Homo sapiens, UP000005640)96 under default settings (BGS) but without cross-run normalization or missing value imputation. Peptide spectral matches (PSMs), peptides, and protein group data were exported for subsequent analysis.
Normalization
SEC fraction intensities were summarized with Spectronaut to the peptide quantities for each fraction. The quantities of each fraction for each peptide were averaged between the three replicates, removing NA values from the mean. A single UniProtID was selected for each peptide based on the protein group identified by Spectronaut - preference being given to UniprotIDs selected in the IP-MS network and prioritization identified by Spectronaut.
Identifying interactions
A reference database for CCprofiler42 was obtained by combining the binary interactions of CORUM and the IP-MS network, where each interaction belonged to one or more IP bait or CORUM complex. CCprofiler was run on the normalized SEC fractions, a UniProt reference, the molecular weight calibration for the SEC run, and the customized reference database. CCprofiler interactions were recovered from peaks with a q-value <0.1 (and an FDR compared to decoys of 0.1) from the reference IP baits, where “subunits_detected” for each peak were converted to pairwise interactions for the SEC interaction network. Decoys were generated from random pairs of proteins in the reference database (CORUM + IP-MS network).
Smoothing and peak picking
Peptide signals per protein were summed and the median of the three replicates was taken. These intensities were smoothed using scipy.signal.filtfilt, a linear digital two-way filter (b=[1.0/2]*2, a=1). Peaks were identified using scipy.signal.find_peaks (prominence=max(intensity)*0.05, distance=2, height=1000) to get the apex position.
Total Proteome Analysis
Searches
Raw data were searched by Spectronaut v16.046 (Biognosys) in the directDIA method, using a UniProt database (Homo sapiens, UP000005640)96 under default settings (BGS) but without cross-run normalization or missing value imputation. Protein group data were exported for subsequent analysis.
Normalization
Normalization and subsequent analysis were performed in R v3.6.3. Contaminants were removed and the “raw.Quantity” unnormalized intensity values were selected. A pseudocount of 1 was added and the data were log2 transformed. The three replicates were averaged and the resulting data were used for stoichiometry analysis.
Generation of the Network
Integration of IP-MS and SEC-MS networks
The IP-MS and SEC-MS networks were combined such that any IP-MS interactions that were also identified in SEC-MS were collapsed into a single interaction with dual support. The network table was expanded to comprehensively report how the network reflects previously published data. Information about PPI support, bait and prey subcellular localization32,54, eCLIP data (ENCODE)23, HydRa RNA-binding prediction53, phase separation propensity98, and disease associations99 was added to the interactome table.
Network visualization (Cytoscape)
The Cytoscape93 networks were generated by importing the interaction networks (IP-MS network and IP-MS+SEC-MS network). The source of interaction support or CORUM support was set to color the edges. The linetype was set by the IP RNA-aware interaction types. Network layout was done by default perfuse force directed layout without edge weights and with bundled edges.
Benchmarking the Network
The IP-MS network was benchmarked against the literature and by comparisons to other large scale interactomes generated using a variety of affinity purification approaches. 34.2% (1488/4350) of all the interactions were previously identified, which is within the range reported by other recent large-scale interactomes (BioPlex 3.0: 9.3%35, BioPlex 2.0: 13%34, Human Interactome: 16%36, OpenCell: 38%29, Havugimana et al.: 73%100), Previously reported interactions were missed at similar or lower rates compared to other large-scale HEK293 PPI interactomes BioPlex 3.035, OpenCell29, and BioID30,31, indicating relatively high variability between datasets. Additionally, of the 1752 interactions found in both IP and SEC, 750 (52.8%) are literature-supported compared to 28.4% of IP-only interactions and 29.2% of SEC-only interactions.
Minichromosome maintenance complex component II (MCM2), a nuclear protein involved in genome replication was included as a bait as a negative control for the network to ensure that RBP preys were not identified simply because of high local concentrations, especially in cellular compartments such as the nucleus. As expected, the MCM2 interactome hub is distinct from the rest of the network, forming interactions with the MCM complex (MCM3-7).
We compared our reciprocal interaction capture to that of the BioPlex 3.0 paper. In the BioPlex 3.0 interactome, 29% of potential reciprocal IPs were identified in the interactome. We applied the same analysis to our interactome and determined that 25% of potential reciprocal IPs were identified. To determine the potential reciprocal space, the BioPlex analysis requires that both proteins were identified as baits and preys, which can lead to a subsampling of possible reciprocal interactions. Only requiring that both potentially interacting proteins were baits, increased the total number of possible reciprocal interactions, so 20% of potential reciprocal interactions were identified in our network. Using less stringent interactor calling cutoffs doubled the number of reciprocal interactions recovered.
Interaction Stoichiometry Analysis
Stoichiometries of IP-MS interactions were calculated using un-normalized intensities as they are internally controlled within samples and to allow for minimal processing and identical processing between total proteome and IP-MS stoichiometries. IP-MS data were analyzed as described above for the total proteome data. Stoichiometries were calculated in log2 space by subtracting the bait intensity from the prey intensity.
Resampling test for PPI networks
We firstly calculate the percentage of PPI pairs (bait-prey) that are reported by public PPI datasets (i.e., Mentha, HuRI, HIPPIE, and rec-Y2H) out of all our PPI pairs and referred to it as Fexp. We next randomly sampled proteins either from the HEK293 proteome which consists of proteins with pTPM > 0 in HEK293 cells reported by Human Protein Atlas or from all the preys we obtained in our entire experiments with all the baits. Within the IP-MS network, for each bait protein, we sampled the same number of random proteins (rand_preys) as the prey proteins found in our IP-MS results and generated a list of PPI pairs (i.e. [bait<-->rand_prey1, bait<-->rand_prey2, bait<-->rand_prey3, … ]). After combining the generated PPI pairs from all the bait proteins, we calculated the percentage the same as defined Fexp but in the generated PPI pair set and referred to it as Fi. We repeated the random sampling steps for 1,000 times and got the resampled distribution {Fi }, where i ranges from 1 to 1,000. The one-sided p-value of the test is calculated as the proportion of the resampled distribution where Fi was greater than or equal to Fexp. Similarly, within SEC identified interaction network between IP-MS identified preys, we used the same approach for the resampling test except for the random sampling step where the PPI pairs are randomly chosen from all potential protein-protein pairs without the restriction set above.
Life step bridge analysis
We defined a network topology-based score termed “bridge score”, modified from betweenness centrality score, to measure the potential of proteins to be the “bridges” between different life-cycle steps. We defined the bridge score of protein v as the normalized sum of the fraction of allpairs shortest paths between life steps that pass through v. Specifically, the bridge score for two specific life-cycle steps are defined as:
S1 and S2 represent the bait proteins from two given life-cycle steps. σ(s, t) is the number of shortest paths between node s and t. σ(v) is the number of those paths passing through node v. N represents the total number of (s, t) pairs between Step 1 and Step 2.
Similarly, the bridge score measuring the protein centrality among all the life-cycle steps are defined as:
N’ represents the total number of (s, t) pairs of all pairs of steps. S1 and S2 represent the bait proteins from any two of the life-cycle steps.
To balance the traffic flows between different pairs of life-cycle steps, we also defined a balanced version of the bridge score for measuring the protein centrality among all the life-cycle steps:
ɑ is a normalization scaling factor which is calculated as , while N” represents the normalized total number of (s, t) pairs of all pairs of steps, which is defined as .
Crosslinking and solid-phase purification (CLASP)
CLASP was performed as previously described101 with slight variation described in brief below. For each experiment, one 10 cm plate of HEK293T cells was used. To stabilize protein-RNA interactions, the growth media was removed, and cells were washed twice in 1 x PBS and irradiated on a cold block with UV254nm (400 mJ/cm2). Cells were then scrapped and collected and pelleted in cold PBS. Cells were then lysed and denatured in denaturation buffer (50 mM Tris-HC, pH 6.8, 10% glycerol, 2.5% SDS, 0.66% NP-40) and sonicated with Bioruptor Pico (Diagenode) for 30 seconds on and 30 seconds off for a total of 5 minutes. Lysate was then incubated for 10 mins at 95°C and moved to room temperature for additional 10 mins. To capture crosslinked protein-RNA complexes, 0.66x of SPRI beads102 (1 mg/ml SPRI beads in 10 mM Tris–HCL, pH= 8.0, 1 M NaCl, 18% PEG-8000, 1 mM EDTA and 0.055% Tween-20) were added to lysate and incubated at room temperature for 10 minutes. SPRI beads were then washed 5 times in denaturing buffer (30 mM Tris–HCl, pH 6.8, 6% glycerol, 1.5% SDS, 0.4% NP-40, 1 M NaCl, 8% PEG-8000) to remove all non-specific interactions. The crosslinked RNA-protein complexes were then eluted from SPRI beads using denaturation buffer (50 mM Tris-HC, pH 6.8, 10% glycerol, 2.5% SDS, 0.66% NP-40) and underwent benzonase (Novagen, Catalog No. 70746) treatment to degrade all nucleic acid. Protein was then precipitated using methanol/chloroform extraction protocol. Extracted proteins was then resuspended in 4x NuPage LDS running buffer (Thermo, Catalog No. NP0007) + DTT and run on SDS-page and transferred to nitrocellulose for immunoblotting.
eCLIP
HEK293XT cells were cultured in DMEM medium supplemented with 10% FBS at 37°C with 5% CO2. eCLIP was performed as previously described22 with minor modifications. Briefly, cells were crosslinked with 400 mJ/cm2 UV-C light and lysed in lysis buffer (50 mM HEPES pH 7.4, 150 mM NaCl, 0.5% NP-40, 0.1% SDS, 0.5 mM DTT, 1 mM PMSF, 1x Protease Inhibitor Cocktail). Lysate was centrifuged at max speed and the supernatant was used for the immunoprecipitation with endogenous antibody conjugated to protein A/G magnetic beads. The RNA-protein complexes were washed with high salt wash buffer (50 mM HEPES pH 7.4, 1 M NaCl, 1 mM EDTA, 0.1% SDS, 1% NP-40), low salt wash buffer (50 mM HEPES pH 7.4, 150 mM NaCl, 1 mM EDTA, 0.1% SDS, 1% NP-40), and PNK buffer (50 mM Tris pH 7.4, 10 mM MgCl2, 0.5% NP-40). The RNA-protein complexes were then subjected to 3’ adapter ligation and reverse transcription with Superscript III Reverse Transcriptase (Invitrogen). The cDNA was purified with Agencourt AMPure XP beads (Beckman Coulter) and subjected to PCR amplification with barcoded primers. The amplified cDNA was purified with Agencourt AMPure XP beads and subjected to high-throughput sequencing on an illumina NovaSeq platform.
Cytoplasmic Fractionation for eCLIP
HEK293XT were crosslinked with 400 mJ/cm2 UV-C light and pelleted and then lysed in hypotonic lysis buffer (10 mM Tris-HCL pH 7.4, 0.05% NP-40, 150 mM NaCl, 1x Protease Inhibitor Cocktail) and incubated on ice for 5 minutes. Lysate was then centrifuged at 15,000 g at 4°C for 10 mins. Supernatant is collected and represents an enrichment for the cytoplasmic fraction.
Skipper windows
eCLIP libraries were processed with Skipper (https://github.com/YeoLab/skipper/)103. Briefly, reads were adapter trimmed with skewer104 (https://github.com/relipmoc/skewer) and reads less than 20 bp were discarded. UMI were extracted using fastp 0.11.5 (https://github.com/OpenGene/fastp)105. Mapping was then performed against the full human genome (hg38) including a database of splice junctions with STAR (v 2.7.6)106, allowing up to 100 multimapped regions. When multimapping occurred, reads were randomly assigned to any of the matching positions. Reads were then PCR deduplicated using UMIcollaps (https://github.com/Daniel-Liu-c0deb0t/UMICollapse). Enriched “windows” (IP versus SM-Input) were called on deduplicated reads using a GC-bias aware beta-binomial model. Each window (~100 b.p.) was partitioned from Gencode v38 and associated with a specific type of genomic region (CDS, UTR, proximal introns near splice site). Windows were filtered using FDR < 0.2 and only reproducible windows between two replicates were used.
Metadensity
To plot enrichment of binding sites across cytoplasmic and whole-cell eCLIPs, we used Metadensity85 to calculate normalized density. Normalized density is calculated for each nucleotide position in a transcript, density = pi × log2(Pi/qi), where pi and qi are the fraction of total reads in IP from either whole-cell or cytoplasmic SNRNP200 libraries, respectively, that map to nucleotide i. We averaged the relative information over all transcripts with at least one differential enriched window detected by Skipper.
5-EU pulse-chase labeling
HEK293XT cells were transfected with shRNAs targeting ERH or a non-targeting control (Sigma, Catalog No. SHCLNG). After 24 hours, the media was replaced. At 48 hours post-transfection, cells were subjected to a 30-minute pulse labeling with 1 mM 5-Ethynyl uridine (Thermo Fisher Scientific, Catalog No. E10345). Subsequently, cells were washed twice with 1x PBS and resuspended in culture media (DMEM supplemented with 10% FBS) containing non-modified 1 mM uridine (chase). Immediately after the chase (0 hours) or four hours later (4 hours), cells were washed with 1x PBS and fixed by diluting paraformaldehyde to 4% (v/v) directly in the wells, followed by incubation for 1 hour at 4°C. The paraformaldehyde solution was then removed, and the cells were washed three times with 1x TBST. Subsequently, the fixed cells were stained for 30 minutes at room temperature with a staining solution consisting of 100 mM Tris (pH 8.5), 1 mM CuSO4 (Click-iT™ Cell Reaction Buffer Kit, Thermo Fisher, Catalog No. C10276), 50 μM fluorescent azide (Alexa Fluor™ 555 Azide, Thermo Fisher, Catalog No. A20012), and 100 mM ascorbic acid. After staining, cells were washed three times with 1x TBST. After the final wash, Prolong Diamond with DAPI was added, and the mountant was cured for 12 h at 25°C. The samples were then imaged on an LSM 880 confocal laser scanning microscope in the DAPI and GFP channels with the same laser power and digital gain for all samples.
Immunofluorescence-FISH
Ibidi 18-well μ-slides were pretreated with 0.001% (w/v) poly-D-lysine for 24 h before seeding and reverse transfection. HEK293XT cells were transfected and seeded onto the pretreated 18-well slides at ~20% confluency. The cells were incubated at 37°C for 48 h. For stressed conditions, sodium arsenite was added to a final concentration of 0.5 mM 45 min before fixation. Cells were fixed by diluting paraformaldehyde to 4% (v/v) directly in the wells and incubating for 1h at 4 °C. The paraformaldehyde was then removed, and the cells were washed three times with DPBS. The cells were then treated with permeabilization solution (0.1% (v/v) Triton X-100 and 1% (w/v) donkey serum in DPBS) for 45 min at 4°C. The samples were washed three times with PBST (0.1% (v/v) Triton X-100 in DPBS). Primary antibodies were added to PBST + 0.1% (w/v) BSA at the following dilutions: α-sc-35 (1:250); α-ERH (1:250); α-G3BP1 (1:1000); α-SNRNP200 (1:100); α-PRPF8 (1:100). The primary antibodies were incubated with the samples for 12 h at 4°C. Following primary antibody treatment, the cells were washed three times with PBST, and the secondary antibodies (see Key Resource Table) were added at a 1:2000 dilution in PBST + 0.1% (w/v) PBST for a 2 h incubation at 25°C. The cells were then washed three times with DPBS and fixed again with 4% (v/v) paraformaldehyde for an additional 10 min at 4°C. Following the second fixation, the cells were washed twice with PBST and then treated with FISH-W Buffer (10% (v/v) formamide in 2X SSC) for 5 min at 25°C. After FISH-W Buffer, the poly(A) probe (T30-ATT-488) was added to a final concentration of 125 nM in FISH-H Buffer (2 mg/mL BSA + 10% (w/v) dextran sulfate in 2X SSC) and incubated with the cells for 2 h at 37°C. Following probe treatment, the cells were washed twice with FISH-W Buffer and then twice with 2X SSC at 37°C for 5 min. After the final wash, Prolong Diamond with DAPI was added, and the mountant was cured for 12 h at 25°C. The samples were then imaged on an LSM 880 confocal laser scanning microscope in the DAPI, GFP, Cy3, and Cy5 channels with the same laser power and digital gain for all samples.
Quantification of IF-FISH Images
Fluorescence microscopy images were imported into Fiji107 for processing and analysis. The number of SRSF2 foci was quantified by setting the same threshold for the channel of each image and using the “Analyze Particles” function to determine the number of speckles per cell. The segmentation function “Watershed” was used to bisect overlapping nuclear speckles for counting. Foci below 0.2 μm2 and above 3.0 μm2 were filtered from the results. Stress granules were quantified using the same pipeline in the G3BP1 channel but with the size cutoffs of 0.2 μm2 and 5.0 μm2. The average poly(A) RNA intensity for each image was determined by setting a minimum threshold for poly(A) detection in each image and averaging the intensity of poly(A) RNA that meet this threshold. Intensity profiles for individual images were generated using the “Plot Profile” function in Fiji, and the intensity values were normalized from 0-1 for each fluorescence channel. The average nuclear poly(A) signal intensity was calculated above the background, and then the intensity of the pixels that overlapped with the DAPI signal was averaged (Fiji).
QUANTIFICATION AND STATISTICAL ANALYSIS
All statistical analyses were performed using readily available code in R or using GraphPad Prism. Number of replicates and details of statistical tests are reported in figure legends. Details on statistical packages and parameters used can be found within each relevant methods section and the key resources table.
Supplementary Material
Supplemental Table 1: List of IP-MS baits with life-cycle associated step(s), the number of replicates per IP, and for undetermined baits, in which RNase condition the IP failed. Ab list for all baits in the network, TMT-mixing scheme, MS raw files info. Related to Figures 1A and S1A.
Supplemental Table 2: The full IP-MS + SEC-MS interactome table, including RNA dependency, interaction source (IP, SEC, or both), interaction support [S1,S2], BioPlex 3.0 [S3], OpenCell [S4], Mentha [S5], Human Interactome [S6], HIPPIE [S7], recY2H [S8], and BioID [S9,S10], interaction and total proteome stoichiometries, protein localizations (HPA [S11], BioID NMF and SAFE), HydRa RNA binding scores, disease annotations (DisGeNET [S12]), eCLIP mRNA target information (ENCODE [S13]), enrichment values (log2FCs and p-values) for RNase-plus and minus IPs, and primary prey life-cycle stage annotation based on the network (as in Supplemental Table 4), Related to Figures 1D and 2B.
Supplemental Table 3: Pairwise Jaccard indexes of all the RBPs in our network that have ENCODE eCLIP data, Related to Figure 3A.
Supplemental Table 4: Life-cycle step distribution of interactions for each prey based on its interacting baits’ life-cycle steps, Related to Figure 4A.
Supplemental Table 5: Correlation of pairwise prey-prey interactions, Related to Figure 4B.
Supplemental Table 6: Normalized and unnormalized centrality scores for each protein, Related to Figure 4C.
Supplemental Table 7: eCLIP data for ERH and SNRNP200 across all conditions, Related to Figures 5, 6,7.
HIGHLIGHTS.
RBP-centric RNA-aware PPI network of the mRNA life-cycle in human cells
Life-cycle stages assigned to network proteins, with ~50% linked to multiple stages
Highly-connected ERH affects nuclear speckle organization and mRNA export
SNRNP200 interacts with stress granules and has distinct cytoplasmic RNA occupancy
ACKNOWLEDGMENTS
G.W.Y. is supported by NIH grants RF1 MH126719, R01 HG011864, and R01 HG004659, and a subaward from U24 HG009889, and an Allen Distinguished Investigator Award, a Paul G. Allen Frontiers Group advised grant of the Paul G. Allen Foundation, and Chan Zuckerberg Foundation Exploratory Cell Networks grant. M.J. was funded by the NIH (R35GM128802; R01AG071869 and R01HG012216), NSF (Award 2224211) and Columbia startup funding for the duration of this study. K.Rothamel is supported by NIH training grant T32CA067754. B.B. is supported by an NSF-GRFP award (DGE2036197). K.W.B. is supported by NIH award K22NS112678, NIH grant R01CA284315, CEPI Award FP00007275, and CPRIT Award RR220017. KR is supported by an ALS Association Milton Safenowitz Postdoctoral Fellowship (23-PDF-639). O.M. is supported by a Gruss-Lipper postdoctoral fellowship of the EGL Charitable Foundation.
Footnotes
Publisher's Disclaimer: This is a PDF file of an unedited manuscript that has been accepted for publication. As a service to our customers we are providing this early version of the manuscript. The manuscript will undergo copyediting, typesetting, and review of the resulting proof before it is published in its final form. Please note that during the production process errors may be discovered which could affect the content, and all legal disclaimers that apply to the journal pertain.
DECLARATION OF INTERESTS
G.W.Y. is a co-founder, member of the Board of Directors, on the SAB, equity holder, and paid consultant for Locanabio (until 12/31/2023) and Eclipse Bioinnovations. G.W.Y.’s interests have been reviewed and approved by the University of California San Diego in accordance with its conflict-of-interest policies. All other authors declare no other competing financial interests.
REFERNCES
- 1.Baltz AG, Munschauer M, Schwanhäusser B, Vasile A, Murakawa Y, Schueler M, Youngs N, Penfold-Brown D, Drew K, Milek M, et al. (2012). The mRNA-bound proteome and its global occupancy profile on protein-coding transcripts. Mol. Cell 46, 674–690. 10.1016/j.molcel.2012.05.021. [DOI] [PubMed] [Google Scholar]
- 2.Dreyfuss G, Kim VN, and Kataoka N (2002). Messenger-RNA-binding proteins and the messages they carry. Nat. Rev. Mol. Cell Biol 3, 195–205. 10.1038/nrm760. [DOI] [PubMed] [Google Scholar]
- 3.Beckmann BM, Horos R, Fischer B, Castello A, Eichelbaum K, Alleaume A-M, Schwarzl T, Curk T, Foehr S, Huber W, et al. (2015). The RNA-binding proteomes from yeast to man harbour conserved enigmRBPs. Nat. Commun 6, 10127. 10.1038/ncomms10127. [DOI] [PMC free article] [PubMed] [Google Scholar]
- 4.Brannan KW, Jin W, Huelga SC, Banks CAS, Gilmore JM, Florens L, Washburn MP, Van Nostrand EL, Pratt GA, Schwinn MK, et al. (2016). SONAR Discovers RNA-Binding Proteins from Analysis of Large-Scale Protein-Protein Interactomes. Mol. Cell 64, 282–293. 10.1016/j.molcel.2016.09.003. [DOI] [PMC free article] [PubMed] [Google Scholar]
- 5.Gerstberger S, Hafner M, Ascano M, and Tuschl T (2014). Evolutionary conservation and expression of human RNA-binding proteins and their role in human genetic disease. Adv. Exp. Med. Biol 825, 1–55. 10.1007/978-1-4939-1221-6_1. [DOI] [PMC free article] [PubMed] [Google Scholar]
- 6.Hentze MW, Castello A, Schwarzl T, and Preiss T (2018). A brave new world of RNA-binding proteins. Nat. Rev. Mol. Cell Biol 19, 327–341. 10.1038/nrm.2017.130. [DOI] [PubMed] [Google Scholar]
- 7.Castello A, Fischer B, Frese CK, Horos R, Alleaume A-M, Foehr S, Curk T, Krijgsveld J, and Hentze MW (2016). Comprehensive Identification of RNA-Binding Domains in Human Cells. Mol. Cell 63, 696–710. 10.1016/j.molcel.2016.06.029. [DOI] [PMC free article] [PubMed] [Google Scholar]
- 8.Queiroz RML, Smith T, Villanueva E, Marti-Solano M, Monti M, Pizzinga M, Mirea D-M, Ramakrishna M, Harvey RF, Dezi V, et al. (2019). Comprehensive identification of RNA-protein interactions in any organism using orthogonal organic phase separation (OOPS). Nat. Biotechnol 37, 169–178. 10.1038/s41587-018-0001-2. [DOI] [PMC free article] [PubMed] [Google Scholar]
- 9.Zhao H, Yang Y, Janga SC, Kao CC, and Zhou Y (2014). Prediction and validation of the unexplored RNA-binding protein atlas of the human proteome. Proteins 82, 640–647. 10.1002/prot.24441. [DOI] [PMC free article] [PubMed] [Google Scholar]
- 10.Bressin A, Schulte-Sasse R, Figini D, Urdaneta EC, Beckmann BM, and Marsico A (2019). TriPepSVM: de novo prediction of RNA-binding proteins based on short amino acid motifs. Nucleic Acids Res. 47, 4406–4417. 10.1093/nar/gkz203. [DOI] [PMC free article] [PubMed] [Google Scholar]
- 11.Zhang X, and Liu S (2017). RBPPred: predicting RNA-binding proteins from sequence using SVM. Bioinformatics 33, 854–862. 10.1093/bioinformatics/btw730. [DOI] [PubMed] [Google Scholar]
- 12.Beckmann BM, Castello A, and Medenbach J (2016). The expanding universe of ribonucleoproteins: of novel RNA-binding proteins and unconventional interactions. Pflugers Arch. 468, 1029–1040. 10.1007/s00424-016-1819-4. [DOI] [PMC free article] [PubMed] [Google Scholar]
- 13.Ben-Bassat I, Chor B, and Orenstein Y (2018). A deep neural network approach for learning intrinsic protein-RNA binding preferences. Bioinformatics 34, i638–i646. 10.1093/bioinformatics/bty600. [DOI] [PubMed] [Google Scholar]
- 14.Ghanbari M, and Ohler U (2020). Deep neural networks for interpreting RNA-binding protein target preferences. Genome Res. 30, 214–226. 10.1101/gr.247494.118. [DOI] [PMC free article] [PubMed] [Google Scholar]
- 15.Trendel J, Schwarzl T, Horos R, Prakash A, Bateman A, Hentze MW, and Krijgsveld J (2019). The Human RNA-Binding Proteome and Its Dynamics during Translational Arrest. Cell 176, 391–403.e19. 10.1016/j.cell.2018.11.004. [DOI] [PubMed] [Google Scholar]
- 16.Zhang C, and Darnell RB (2011). Mapping in vivo protein-RNA interactions at single-nucleotide resolution from HITS-CLIP data. Nat. Biotechnol 29, 607–614. 10.1038/nbt.1873. [DOI] [PMC free article] [PubMed] [Google Scholar]
- 17.Hafner M, Landthaler M, Burger L, Khorshid M, Hausser J, Berninger P, Rothballer A, Ascano M, Jungkamp A-C, Munschauer M, et al. (2010). PAR-CliP--a method to identify transcriptome-wide the binding sites of RNA binding proteins. J. Vis. Exp 10.3791/2034. [DOI] [PMC free article] [PubMed] [Google Scholar]
- 18.Zarnegar BJ, Flynn RA, Shen Y, Do BT, Chang HY, and Khavari PA (2016). irCLIP platform for efficient characterization of protein-RNA interactions. Nat. Methods 13, 489–492. 10.1038/nmeth.3840. [DOI] [PMC free article] [PubMed] [Google Scholar]
- 19.König J, Zarnack K, Rot G, Curk T, Kayikci M, Zupan B, Turner DJ, Luscombe NM, and Ule J (2010). iCLIP reveals the function of hnRNP particles in splicing at individual nucleotide resolution. Nat. Struct. Mol. Biol 77, 909–915. 10.1038/nsmb.1838. [DOI] [PMC free article] [PubMed] [Google Scholar]
- 20.Van Nostrand EL, Pratt GA, Yee BA, Wheeler EC, Blue SM, Mueller J, Park SS, Garcia KE, Gelboin-Burkhart C, Nguyen TB, et al. (2020). Principles of RNA processing from analysis of enhanced CLIP maps for 150 RNA binding proteins. Genome Biol. 27, 90. 10.1186/s13059-020-01982-9. [DOI] [PMC free article] [PubMed] [Google Scholar]
- 21.Blue SM, Yee BA, Pratt GA, Mueller JR, Park SS, Shishkin AA, Starner AC, Van Nostrand EL, and Yeo GW (2022). Transcriptome-wide identification of RNA-binding protein binding sites using seCLIP-seq. Nat. Protoc 77, 1223–1265. 10.1038/s41596-022-00680-z. [DOI] [PMC free article] [PubMed] [Google Scholar]
- 22.Van Nostrand EL, Pratt GA, Shishkin AA, Gelboin-Burkhart C, Fang MY, Sundararaman B, Blue SM, Nguyen TB, Surka C, Elkins K, et al. (2016). Robust transcriptome-wide discovery of RNA-binding protein binding sites with enhanced CLIP (eCLIP). Nat. Methods 13, 508–514. 10.1038/nmeth.3810. [DOI] [PMC free article] [PubMed] [Google Scholar]
- 23.Van Nostrand EL, Freese P, Pratt GA, Wang X, Wei X, Xiao R, Blue SM, Chen J-Y, Cody NAL, Dominguez D, et al. (2020). A large-scale binding and functional map of human RNA-binding proteins. Nature 583, 711–719. 10.1038/s41586-020-2077-3. [DOI] [PMC free article] [PubMed] [Google Scholar]
- 24.Sundararaman B, Zhan L, Blue SM, Stanton R, Elkins K, Olson S, Wei X, Van Nostrand EL, Pratt GA, Huelga SC, et al. (2016). Resources for the Comprehensive Discovery of Functional RNA Elements. Mol. Cell 61, 903–913. 10.1016/j.molcel.2016.02.012. [DOI] [PMC free article] [PubMed] [Google Scholar]
- 25.García-Mauriño SM, Rivero-Rodríguez F, Velázquez-Cruz A, Hernández-Vellisca M, Díaz-Quintana A, De la Rosa MA, and Díaz-Moreno I (2017). RNA Binding Protein Regulation and Cross-Talk in the Control of AU-rich mRNA Fate. Front Mol Biosci 4, 71. 10.3389/fmolb.2017.00071. [DOI] [PMC free article] [PubMed] [Google Scholar]
- 26.Lunde BM, Moore C, and Varani G (2007). RNA-binding proteins: modular design for efficient function. Nat. Rev. Mol. Cell Biol 8, 479–490. 10.1038/nrm2178. [DOI] [PMC free article] [PubMed] [Google Scholar]
- 27.Bleichert F, and Baserga SJ (2010). Ribonucleoprotein multimers and their functions. Crit. Rev. Biochem. Mol. Biol 45, 331–350. 10.3109/10409238.2010.496772. [DOI] [PMC free article] [PubMed] [Google Scholar]
- 28.Botta S, de Prisco N, Chemiakine A, Brandt V, Cabaj M, Patel P, Doron-Mandel E, Treadway CJ, Jovanovic M, Brown NG, et al. (2023). Dosage sensitivity to Pumilio1 variants in the mouse brain reflects distinct molecular mechanisms. EMBO J. 42. 10.15252/embj.2022112721. [DOI] [PMC free article] [PubMed] [Google Scholar]
- 29.Cho NH, Cheveralls KC, Brunner A-D, Kim K, Michaelis AC, Raghavan P, Kobayashi H, Savy L, Li JY, Canaj H, et al. (2022). OpenCell: Endogenous tagging for the cartography of human cellular organization. Science 375, eabi6983. 10.1126/science.abi6983. [DOI] [PMC free article] [PubMed] [Google Scholar]
- 30.Go CD, Knight JDR, Rajasekharan A, Rathod B, Hesketh GG, Abe KT, Youn J-Y, Samavarchi-Tehrani P, Zhang H, Zhu LY, et al. (2021). A proximity-dependent biotinylation map of a human cell. Nature 595, 120–124. 10.1038/s41586-021-03592-2. [DOI] [PubMed] [Google Scholar]
- 31.Youn J-Y, Dunham WH, Hong SJ, Knight JDR, Bashkurov M, Chen GI, Bagci A, Rathod B, MacLeod G, Eng SWM, et al. (2018). High-Density Proximity Mapping Reveals the Subcellular Organization of mRNA-Associated Granules and Bodies. Mol. Cell 69, 517–532.e11. 10.1016/j.molcel.2017.12.020. [DOI] [PubMed] [Google Scholar]
- 32.Roux KJ, Kim DI, Burke B, and May DG (2018). BioID: A screen for protein-protein interactions. Curr. Protoc. Protein Sci 91, 19.23.1–19.23.15. 10.1002/cpps.51. [DOI] [PMC free article] [PubMed] [Google Scholar]
- 33.Huttlin EL, Ting L, Bruckner RJ, Gebreab F, Gygi MP, Szpyt J, Tam S, Zarraga G, Colby G, Baltier K, et al. (2015). The BioPlex network: A systematic exploration of the human interactome. Cell 162, 425–440. 10.1016/j.cell.2015.06.043. [DOI] [PMC free article] [PubMed] [Google Scholar]
- 34.Huttlin EL, Bruckner RJ, Paulo JA, Cannon JR, Ting L, Baltier K, Colby G, Gebreab F, Gygi MP, Parzen H, et al. (2017). Architecture of the human interactome defines protein communities and disease networks. Nature 545, 505–509. 10.1038/nature22366. [DOI] [PMC free article] [PubMed] [Google Scholar]
- 35.Huttlin EL, Bruckner RJ, Navarrete-Perea J, Cannon JR, Baltier K, Gebreab F, Gygi MP, Thornock A, Zarraga G, Tam S, et al. (2021). Dual proteome-scale networks reveal cell-specific remodeling of the human interactome. Cell 184, 3022–3040.e28. 10.1016/j.cell.2021.04.011. [DOI] [PMC free article] [PubMed] [Google Scholar]
- 36.Hein MY, Hubner NC, Poser I, Cox J, Nagaraj N, Toyoda Y, Gak IA, Weisswange A, Mansfeld J, Buchholz F, et al. (2015). A human interactome in three quantitative dimensions organized by stoichiometries and abundances. Cell 163, 712–723. 10.1016/j.cell.2015.09.053. [DOI] [PubMed] [Google Scholar]
- 37.Lang B, Yang J-S, Garriga-Canut M, Speroni S, Aschern M, Gili M, Hoffmann T, Tartaglia GG, and Maurer SP (2021). Matrix-screening reveals a vast potential for direct protein-protein interactions among RNA binding proteins. Nucleic Acids Res. 49, 6702–6721. 10.1093/nar/gkab490. [DOI] [PMC free article] [PubMed] [Google Scholar]
- 38.Fradera-Sola A, Nischwitz E, Bayer ME, Luck K, and Butter F (2023). RNA-dependent interactome allows network-based assignment of RNA-binding protein function. Nucleic Acids Res. 51, 5162–5176. 10.1093/nar/gkad245. [DOI] [PMC free article] [PubMed] [Google Scholar]
- 39.Kristensen AR, Gsponer J, and Foster LJ (2012). A high-throughput approach for measuring temporal changes in the interactome. Nat. Methods 9, 907–909. 10.1038/nmeth.2131. [DOI] [PMC free article] [PubMed] [Google Scholar]
- 40.Kirkwood KJ, Ahmad Y, Larance M, and Lamond AI (2013). Characterization of native protein complexes and protein isoform variation using size-fractionation-based quantitative proteomics. Mol.Cell. Proteomics 12, 3851–3873. 10.1074/mcp.M113.032367. [DOI] [PMC free article] [PubMed] [Google Scholar]
- 41.Skinnider MA, Scott NE, Prudova A, Kerr CH, Stoynov N, Stacey RG, Chan QWT, Rattray D, Gsponer J, and Foster LJ (2021). An atlas of protein-protein interactions across mouse tissues. Cell 184, 4073–4089.e17. 10.1016/j.cell.2021.06.003. [DOI] [PubMed] [Google Scholar]
- 42.Heusel M, Bludau I, Rosenberger G, Hafen R, Frank M, Banaei-Esfahani A, van Drogen A, Collins BC, Gstaiger M, and Aebersold R (2019). Complex-centric proteome profiling by SEC-SWATH-MS. Mol. Syst. Biol 15, e8438. 10.15252/msb.20188438. [DOI] [PMC free article] [PubMed] [Google Scholar]
- 43.Rosenberger G, Heusel M, Bludau I, Collins BC, Martelli C, Williams EG, Xue P, Liu Y, Aebersold R, and Califano A (2020). SECAT: Quantifying protein complex dynamics across cell states by network-centric analysis of SEC-SWATH-MS profiles. Cell Syst. 11, 589–607.e8. 10.1016/j.cels.2020.11.006. [DOI] [PMC free article] [PubMed] [Google Scholar]
- 44.Fossati A, Li C, Uliana F, Wendt F, Frommelt F, Sykacek P, Heusel M, Hallal M, Bludau I, Capraz T, et al. (2021). PCprophet: a framework for protein complex prediction and differential analysis using proteomic data. Nat. Methods 18, 520–527. 10.1038/s41592-021-01107-5. [DOI] [PubMed] [Google Scholar]
- 45.Bludau I, Heusel M, Frank M, Rosenberger G, Hafen R, Banaei-Esfahani A, van Drogen A, Collins BC, Gstaiger M, and Aebersold R (2020). Complex-centric proteome profiling by SEC-SWATH-MS for the parallel detection of hundreds of protein complexes. Nat. Protoc 15, 2341–2386. 10.1038/s41596-020-0332-6. [DOI] [PubMed] [Google Scholar]
- 46.Caudron-Herger M, Rusin SF, Adamo ME, Seiler J, Schmid VK, Barreau E, Kettenbach AN, and Diederichs S (2019). R-DeeP: Proteome-wide and Quantitative Identification of RNA-Dependent Proteins by Density Gradient Ultracentrifugation. Mol. Cell 75, 184–199.e10. 10.1016/j.molcel.2019.04.018. [DOI] [PMC free article] [PubMed] [Google Scholar]
- 47.Mallam AL, Sae-Lee W, Schaub JM, Tu F, Battenhouse A, Jang YJ, Kim J, Wallingford JB, Finkelstein IJ, Marcotte EM, et al. (2019). Systematic Discovery of Endogenous Human Ribonucleoprotein Complexes. Cell Rep. 29, 1351–1368.e5. 10.1016/j.celrep.2019.09.060. [DOI] [PMC free article] [PubMed] [Google Scholar]
- 48.Giurgiu M, Reinhard J, Brauner B, Dunger-Kaltenbach I, Fobo G, Frishman G, Montrone C, and Ruepp A (2019). CORUM: the comprehensive resource of mammalian protein complexes-2019. Nucleic Acids Res. 47, D559–D563. 10.1093/nar/gky973. [DOI] [PMC free article] [PubMed] [Google Scholar]
- 49.Tsitsiridis G, Steinkamp R, Giurgiu M, Brauner B, Fobo G, Frishman G, Montrone A , and Ruepp A (2023). CORUM: the comprehensive resource of mammalian protein complexes-2022. Nucleic Acids Res. 51, D539–D545. 10.1093/nar/gkac1015. [DOI] [PMC free article] [PubMed] [Google Scholar]
- 50.Kuksa PP, Amlie-Wolf A, Hwang Y-C, Valladares O, Gregory BD, and Wang L-S (2020). HIPPIE2: a method for fine-scale identification of physically interacting chromatin regions. NAR Genom. Bioinform 2, lqaa022. 10.1093/nargab/lqaa022. [DOI] [PMC free article] [PubMed] [Google Scholar]
- 51.Calderone A, Castagnoli L, and Cesareni G (2013). mentha: a resource for browsing integrated protein-interaction networks. Nat. Methods 10, 690–691. 10.1038/nmeth.2561. [DOI] [PubMed] [Google Scholar]
- 52.Rolland T, Taşan M, Charloteaux B, Pevzner SJ, Zhong Q, Sahni N, Yi S, Lemmens I, Fontanillo C, Mosca R, et al. (2014). A proteome-scale map of the human interactome network. Cell 159, 1212–1226. 10.1016/j.cell.2014.10.050. [DOI] [PMC free article] [PubMed] [Google Scholar]
- 53.Jin W, Brannan K, Kapeli K, Park SS, Tan HQ, Gosztyla ML, Mujumdar M, Ahdout J, Henroid B, Rothame K, et al. (2023). HydRA: Deep-learning models for predicting RNA-binding capacity from protein interaction association context and protein sequence. 10.2139/ssrn.4319529. [DOI] [PMC free article] [PubMed] [Google Scholar]
- 54.Thul PJ, Åkesson L, Wiking M, Mahdessian D, Geladaki A, Ait Blal H, Aim T, Asplund A, Björk L, Breckels LM, et al. (2017). A subcellular map of the human proteome. Science 356. 10.1126/science.aal3321. [DOI] [PubMed] [Google Scholar]
- 55.Eisenberg AR, Higdon A, Keskin A, Hodapp S, Jovanovic M, and Brar GA (2018). Precise post-translational tuning occurs for most protein complex components during meiosis. Cell Rep. 25, 3603–3617.e2. 10.1016/j.celrep.2018.12.008. [DOI] [PMC free article] [PubMed] [Google Scholar]
- 56.Taggart JC, Zauber H, Selbach M, Li G-W, and McShane E (2020). Keeping the Proportions of protein complex components in check. Cell Syst. 10, 125–132. 10.1016/j.cels.2020.01.004. [DOI] [PMC free article] [PubMed] [Google Scholar]
- 57.McShane E, Sin C, Zauber H, Wells JN, Donnelly N, Wang X, Hou J, Chen W, Storchova Z, Marsh JA, et al. (2016). Kinetic analysis of protein stability reveals age-dependent degradation. Cell 167, 803–815.e21. 10.1016/j.cell.2016.09.015. [DOI] [PubMed] [Google Scholar]
- 58.Damianov A, Ying Y, Lin C-H, Lee J-A, Tran D, Vashisht AA, Bahrami-Samani E, Xing Y, Martin KC, Wohlschlegel JA, et al. (2016). Rbfox proteins regulate splicing as part of a large multiprotein complex LASR. Cell 165, 606–619. 10.1016/j.cell.2016.03.040. [DOI] [PMC free article] [PubMed] [Google Scholar]
- 59.Graille M. (2022). ERH: a plug-and-play protein important for gene silencing and cell cycle progression. FEBS J. 10.1111/febs.16669. [DOI] [PubMed] [Google Scholar]
- 60.Pang K, Li M-L, Hao L, Shi Z-D, Feng H, Chen B, Ma Y-Y, Xu H, Pan D, Chen Z-S, et al. (2022). ERH gene and its role in cancer cells. Front. Oncol 12, 900496. 10.3389/fonc.2022.900496. [DOI] [PMC free article] [PubMed] [Google Scholar]
- 61.Fang W, and Bartel DP (2020). MicroRNA clustering assists processing of suboptimal MicroRNA hairpins through the action of the ERH protein. Mol. Cell 78, 289–302.e6. 10.1016/j.molcel.2020.01.026. [DOI] [PMC free article] [PubMed] [Google Scholar]
- 62.Kwon SC, Jang H, Shen S, Baek SC, Kim K, Yang J, Kim J, Kim J-S, Wang S, Shi Y, et al. (2020). ERH facilitates microRNA maturation through the interaction with the N-terminus of DGCR8. Nucleic Acids Res. 48, 11097–11112. 10.1093/nar/gkaa827. [DOI] [PMC free article] [PubMed] [Google Scholar]
- 63.Kavanaugh G, Zhao R, Guo Y, Mohni KN, Glick G, Lacy ME, Hutson MS, Ascano M, and Cortez D (2015). Enhancer of Rudimentary Homolog Affects the Replication Stress Response through Regulation of RNA Processing. Mol. Cell. Biol 35, 2979–2990. 10.1128/MCB.01276-14. [DOI] [PMC free article] [PubMed] [Google Scholar]
- 64.Kim B, Arcos S, Rothamel K, and Ascano M (2021). Viral crosslinking and solid-phase purification enables discovery of ribonucleoprotein complexes on incoming RNA virus genomes. Nat. Protoc 16, 516–531. 10.1038/s41596-020-00429-6. [DOI] [PMC free article] [PubMed] [Google Scholar]
- 65.Pacheco-Fiallos B, Vorländer MK, Riabov-Bassat D, Fin L, O’Reilly FJ, Ayala FI, Schellhaas U, Rappsilber J, and Plaschka C (2023). mRNA recognition and packaging by the human transcription–export complex. Nature 616, 828–835. 10.1038/s41586-023-05904-0. [DOI] [PMC free article] [PubMed] [Google Scholar]
- 66.Dias AP, Dufu K, Lei H, and Reed R (2010). A role for TREX components in the release Of spliced mRNA from nuclear speckle domains. Nat. Commun 1, 97. 10.1038/ncomms1103. [DOI] [PMC free article] [PubMed] [Google Scholar]
- 67.Heath CG, Viphakone N, and Wilson SA (2016). The role of TREX in gene expression and disease. Biochem. J 473, 2911–2935. 10.1042/bcj20160010. [DOI] [PMC free article] [PubMed] [Google Scholar]
- 68.Galganski L, Urbanek MO, and Krzyzosiak WJ (2017). Nuclear speckles: molecular organization, biological function and role in disease. Nucleic Acids Res. 45, 10350–10368. 10.1093/nar/gkx759. [DOI] [PMC free article] [PubMed] [Google Scholar]
- 69.Zuckerman B, Ron M, Mikl M, Segal E, and Ulitsky I (2020). Gene architecture and sequence composition underpin selective dependency of nuclear export of long RNAs on NXF1 and the TREX complex. Mol. Cell 79, 251–267.e6. 10.1016/j.molcel.2020.05.013. [DOI] [PubMed] [Google Scholar]
- 70.Strom AR, and Brangwynne CP (2019). The liquid nucleome - phase transitions in the nucleus at a glance. J. Cell Sci 132, jcs235093. 10.1242/jcs.235093. [DOI] [PMC free article] [PubMed] [Google Scholar]
- 71.Shav-Tal Y, Cohen M, Lapter S, Dye B, Patton JG, Vandekerckhove J, and Zipori, (2001). Nuclear relocalization of the pre-mRNA splicing factor PSF during apoptosis involves hyperphosphorylation, masking of antigenic epitopes, and changes in protein interactions. Mol. Biol. Cell 12, 2328–2340. 10.1091/mbc.12.8.2328. [DOI] [PMC free article] [PubMed] [Google Scholar]
- 72.Spector DL, and Lamond AI (2011). Nuclear Speckles. Cold Spring Harb. Perspect. Biol 3, a000646–a000646. 10.1101/cshperspect.a000646. [DOI] [PMC free article] [PubMed] [Google Scholar]
- 73.Lamond AI, and Spector DL (2003). Nuclear speckles: a model for nuclear organelles. Nat. Rev. Mol. Cell Biol 4, 605–612. 10.1038/nrm1172. [DOI] [PubMed] [Google Scholar]
- 74.Spector DL, Fu XD, and Maniatis T (1991). Associations between distinct pre-mRNA splicing components and the cell nucleus. EMBO J. 10, 3467–3481. 10.1002/j.1460-2075.1991.tb04911.x. [DOI] [PMC free article] [PubMed] [Google Scholar]
- 75.Ferreira JA, Carmo-Fonseca M, and Lamond AI (1994). Differential interaction of splicing snRNPs with coiled bodies and interchromatin granules during mitosis and assembly of daughter cell nuclei. J. Cell Biol 126, 11–23. 10.1083/jcb.126.1.11. [DOI] [PMC free article] [PubMed] [Google Scholar]
- 76.Laggerbauer B, Achsel T, and Lührmann R (1998). The human U5-200kD DEXH-box protein unwinds U4/U6 RNA duplices in vitro. Proc. Natl. Acad. Sci. U. S. A 95, 4188–4192. 10.1073/pnas.95.8.4188. [DOI] [PMC free article] [PubMed] [Google Scholar]
- 77.Raghunathan PL, and Guthrie C (1998). RNA unwinding in U4/U6 snRNPs requires ATP hydrolysis and the DEIH-box splicing factor Brr2. Curr. Biol 8, 847–855. 10.1016/s0960-9822(07)00345-4. [DOI] [PubMed] [Google Scholar]
- 78.Absmeier E, Santos KF, and Wahl MC (2016). Functions and regulation of the Brr2 RNA helicase during splicing. Cell Cycle 15, 3362–3377. 10.1080/15384101.2016.1249549. [DOI] [PMC free article] [PubMed] [Google Scholar]
- 79.Bergfort A, Hilal T, Kuropka B, Ilik İA, Weber G, Aktaş T, Freund C, and Wahl MC. (2022). The intrinsically disordered TSSC4 protein acts as a helicase inhibitor, placeholder and multi-interaction coordinator during snRNP assembly and recycling. Nucleic Acids Res. 50, 2938–2958. 10.1093/nar/gkac087. [DOI] [PMC free article] [PubMed] [Google Scholar]
- 80.Vu L, Ghosh A, Tran C, Tebung WA, Sidibé H, Garcia-Mansfield K, David-Dirgo V, Sharma R, Pirrotte P, Bowser R, et al. (2021). Defining the Caprin-1 Interactome in Unstressed and Stressed Conditions. J. Proteome Res 20, 3165–3178. 10.1021/acs.jproteome.1C00016. [DOI] [PMC free article] [PubMed] [Google Scholar]
- 81.Hahn D, Kudla G, Tollervey D, and Beggs JD (2012). Brr2p-mediated conformational rearrangements in the spliceosome during activation and substrate repositioning. Genes Dev. 26, 2408–2421. 10.1101/gad.199307.112. [DOI] [PMC free article] [PubMed] [Google Scholar]
- 82.Robinson JT, Thorvaldsdóttir H, Winckler W, Guttman M, Lander ES, Getz G, and Mesirov JP (2011). Integrative genomics viewer. Nat. Biotechnol 29, 24–26. 10.1038/nbt.1754. [DOI] [PMC free article] [PubMed] [Google Scholar]
- 83.Schmitzová J, Cretu C, Dienemann C, Urlaub H, and Pena V (2023). Structural basis of catalytic activation in human splicing. Nature 617, 842–850. 10.1038/s41586-023-06049-w. [DOI] [PMC free article] [PubMed] [Google Scholar]
- 84.Hubstenberger A, Courel M, Bénard M, Souquere S, Ernoult-Lange M, Chouaib R, Yi Z, Morlot J-B, Munier A, Fradet M, et al. (2017). P-body purification reveals the condensation of repressed mRNA regulons. Mol. Cell 68, 144–157.e5. 10.1016/j.molcel.2017.09.003. [DOI] [PubMed] [Google Scholar]
- 85.Her H-L, Boyle E, and Yeo GW (2022). Metadensity: a background-aware python pipeline for summarizing CLIP signals on various transcriptomic sites. Bioinform. Adv 2, vbac083. 10.1093/bioadv/vbac083. [DOI] [PMC free article] [PubMed] [Google Scholar]
- 86.Wheeler EC, Vu AQ, Einstein JM, DiSalvo M, Ahmed N, Van Nostrand EL, Shishkin AA, Jin W, Allbritton NL, and Yeo GW (2020). Pooled CRISPR screens with imaging on microraft arrays reveals stress granule-regulatory factors. Nat. Methods 17, 636–642. 10.1038/S41592-020-0826-8. [DOI] [PMC free article] [PubMed] [Google Scholar]
- 87.Malinová A, Cvačková Z, Matějů D, Hořejší Z, Abéza C, Vandermoere F, Bertrand A, Staněk D, and Verheggen C (2017). Assembly of the U5 snRNP component PRPF8 is controlled by the HSP90/R2TP chaperones. J. Cell Biol 216, 1579–1596. 10.1083/jcb.201701165. [DOI] [PMC free article] [PubMed] [Google Scholar]
- 88.Khong A, Matheny T, Jain S, Mitchell SF, Wheeler JR, and Parker R (2017). The stress granule transcriptome reveals principles of mRNA accumulation in stress granules. Mol. Cell 68, 808–820.e5. 10.1016/j.molcel.2017.10.015. [DOI] [PMC free article] [PubMed] [Google Scholar]
- 89.Anders M, Chelysheva I, Goebel I, Trenkner T, Zhou J, Mao Y, Verzini S, Qian S-B, and Ignatova Z (2018). Dynamic m6A methylation facilitates mRNA triaging to stress granules. Life Sci. Alliance 1, e201800113. 10.26508/lsa.201800113. [DOI] [PMC free article] [PubMed] [Google Scholar]
- 90.Somasekharan SP, Zhang F, Saxena N, Huang JN, Kuo I-C, Low C, Bell R, Adomat H, Stoynov N, Foster L, et al. (2020). G3BP1-linked mRNA partitioning supports selective protein synthesis in response to oxidative stress. Nucleic Acids Res. 48, 6855–6873. 10.1093/nar/gkaa376. [DOI] [PMC free article] [PubMed] [Google Scholar]
- 91.Cockman E, Anderson P, and Ivanov P (2020). TOP mRNPs: Molecular mechanisms and principles of regulation. Biomolecules 10, 969. 10.3390/biom10070969. [DOI] [PMC free article] [PubMed] [Google Scholar]
- 92.Lachén-Montes M, Mendizuri N, Ausin K, Andrés-Benito P, Ferrer I, Fernández-Irigoyen J, and Santamaría E (2020). Amyotrophic lateral sclerosis is accompanied by protein derangements in the olfactory bulb-tract axis. Int. J. Mol. Sci 21, 8311. 10.3390/ijms21218311. [DOI] [PMC free article] [PubMed] [Google Scholar]
- 93.Shannon P, Markiel A, Ozier O, Baliga NS, Wang JT, Ramage D, Amin N, Schwikowski B, and Ideker T (2003). Cytoscape: a software environment for integrated Models of biomolecular interaction networks. Genome Res. 13, 2498–2504. 10.1101/gr.1239303. [DOI] [PMC free article] [PubMed] [Google Scholar]
- 94.Fu XD, and Maniatis T (1990). Factor required for mammalian spliceosome assembly is localized to discrete regions in the nucleus. Nature 343, 437–441. 10.1038/343437a0. [DOI] [PubMed] [Google Scholar]
- 95.Fu XD, and Maniatis T (1992). Isolation of a complementary DNA that encodes the mammalian splicing factor SC35. Science 256, 535–538. 10.1126/science.1373910. [DOI] [PubMed] [Google Scholar]
- 96.The UniProt Consortium, Bateman A, Martin M-J, Orchard S, Magrane M,Ahmad S, Alpi E, Bowler-Barnett EH, Britto R, Bye-A-Jee H, et al. (2023). UniProt: The universal protein knowledgebase in 2023. Nucleic Acids Res. 51, D523–D531. 10.1093/nar/gkac1052. [DOI] [PMC free article] [PubMed] [Google Scholar]
- 97.Bruderer R, Bernhardt OM, Gandhi T, Miladinović SM, Cheng L-Y, Messner S, Ehrenberger T, Zanotelli V, Butscheid Y, Escher C, et al. (2015). Extending the limits of quantitative proteome profiling with data-independent acquisition and application to acetaminophen-treated three-dimensional liver microtissues. Mol. Cell. Proteomics 14, 1400–1410. 10.1074/mcp.M114.044305. [DOI] [PMC free article] [PubMed] [Google Scholar]
- 98.Vernon RM, Chong PA, Tsang B, Kim TH, Bah A, Farber P, Lin H, and Forman-Kay JD (2018). Pi-Pi contacts are an overlooked protein feature relevant to phase separation. Elife 7. 10.7554/eLife.31486. [DOI] [PMC free article] [PubMed] [Google Scholar]
- 99.Piñero J, Ramírez-Anguita JM, Saüch-Pitarch J, Ronzano F, Centeno E, Sanz F, and Furlong LI (2020). The DisGeNET knowledge platform for disease genomics: 2019 update. Nucleic Acids Res. 48, D845–D855. 10.1093/nar/gkz1021. [DOI] [PMC free article] [PubMed] [Google Scholar]
- 100.Havugimana PC, Goel RK, Phanse S, Youssef A, Padhorny D, Kotelnikov S, Kozakov D, and Emili A (2022). Scalable multiplex co-fractionation/mass spectrometry platform for accelerated protein interactome discovery. Nat. Commun 13, 4043. 10.1038/s41467-022-31809-z. [DOI] [PMC free article] [PubMed] [Google Scholar]
- 101.Kim B, Arcos S, Rothamel K, Jian J, Rose KL, McDonald WH, Bian Y, Reasoner S, Barrows NJ, Bradrick S, et al. (2020). Discovery of Widespread Host Protein Interactions with the Pre-replicated Genome of CHIKV Using VIR-CLASP. Mol. Cell 78, 624–640.e7. 10.1016/j.molcel.2020.04.013. [DOI] [PMC free article] [PubMed] [Google Scholar]
- 102.DeAngelis MM, Wang DG, and Hawkins TL (1995). Solid-phase reversible immobilization for the isolation of PCR products. Nucleic Acids Res. 23, 4742–4743. 10.1093/nar/23.22.4742. [DOI] [PMC free article] [PubMed] [Google Scholar]
- 103.Boyle EA, Her H-L, Mueller JR, Naritomi JT, Nguyen GG, and Yeo GW (2023). Skipper analysis of eCLIP datasets enables sensitive detection of constrained translation factor binding sites. Cell Genomics. [DOI] [PMC free article] [PubMed] [Google Scholar]
- 104.Jiang H, Lei R, Ding S-W, and Zhu S (2014). Skewer: a fast and accurate adapter trimmer for next-generation sequencing paired-end reads. BMC Bioinformatics 15, 182. 10.1186/1471-2105-15-182. [DOI] [PMC free article] [PubMed] [Google Scholar]
- 105.Chen S, Zhou Y, Chen Y, and Gu J (2018). fastp: an ultra-fast all-in-one FASTQ preprocessor. Bioinformatics 34, i884–i890. 10.1093/bioinformatics/bty560. [DOI] [PMC free article] [PubMed] [Google Scholar]
- 106.Dobin A, Davis CA, Schlesinger F, Drenkow J, Zaleski C, Jha S, Batut P, Chaisson M, and Gingeras TR (2013). STAR: ultrafast universal RNA-seq aligner. Bioinformatics 29, 15–21. 10.1093/bioinformatics/bts635. [DOI] [PMC free article] [PubMed] [Google Scholar]
- 107.Schindelin J, Arganda-Carreras I, Frise E, Kaynig V, Longair M, Pietzsch T, Preibisch S, Rueden C, Saalfeld S, Schmid B, et al. (2012). Fiji: an open-source platform for biological-image analysis. Nat. Methods 9, 676–682. 10.1038/nmeth.2019. [DOI] [PMC free article] [PubMed] [Google Scholar]
Associated Data
This section collects any data citations, data availability statements, or supplementary materials included in this article.
Supplementary Materials
Supplemental Table 1: List of IP-MS baits with life-cycle associated step(s), the number of replicates per IP, and for undetermined baits, in which RNase condition the IP failed. Ab list for all baits in the network, TMT-mixing scheme, MS raw files info. Related to Figures 1A and S1A.
Supplemental Table 2: The full IP-MS + SEC-MS interactome table, including RNA dependency, interaction source (IP, SEC, or both), interaction support [S1,S2], BioPlex 3.0 [S3], OpenCell [S4], Mentha [S5], Human Interactome [S6], HIPPIE [S7], recY2H [S8], and BioID [S9,S10], interaction and total proteome stoichiometries, protein localizations (HPA [S11], BioID NMF and SAFE), HydRa RNA binding scores, disease annotations (DisGeNET [S12]), eCLIP mRNA target information (ENCODE [S13]), enrichment values (log2FCs and p-values) for RNase-plus and minus IPs, and primary prey life-cycle stage annotation based on the network (as in Supplemental Table 4), Related to Figures 1D and 2B.
Supplemental Table 3: Pairwise Jaccard indexes of all the RBPs in our network that have ENCODE eCLIP data, Related to Figure 3A.
Supplemental Table 4: Life-cycle step distribution of interactions for each prey based on its interacting baits’ life-cycle steps, Related to Figure 4A.
Supplemental Table 5: Correlation of pairwise prey-prey interactions, Related to Figure 4B.
Supplemental Table 6: Normalized and unnormalized centrality scores for each protein, Related to Figure 4C.
Supplemental Table 7: eCLIP data for ERH and SNRNP200 across all conditions, Related to Figures 5, 6,7.
Data Availability Statement
Raw IP-MS and SEC-MS data is deposited at the MassIVE repository. Interactive IP-MS + SEC-MS interactome explorer is available on github. eCLIP data is deposited at GEO and all are publicly available as of the data of publication. Accession numbers are listed in key resources table. Original western blot and microscopy images have been deposited at Mendeley and are publicly available as of the date of publication. The DOI is listed in the key resources table.
This paper does not report any original code
Any additional information required to reanalyze the data reported in this paper is available from the lead contact upon request
Key Resources Table
| REAGENT or RESOURCE | SOURCE | IDENTIFIER |
|---|---|---|
| Antibodies | ||
| α-SC35 (SRSF2) | Abcam | ab11826 |
| α-ERH | Bethyl | A305-401A |
| α-G3BP1 | MBL | RNO48PW |
| α-SNRNP200 | Abcam | ab176715 |
| α-PRPF8 | Bethyl (IP), Ab185547 (IF) | A303-920A, Ab185547 |
| Donkey α-Mouse IgG, Alexa Fluor 555 | Thermo | A-31570 |
| Donkey α-Rabbit IgG, Alexa Fluor 647 | Thermo | A-31573 |
| α-PCF11 (WB) | Bethyl | A303-706A |
| α-YTHDCF1 (WB) | Bethyl | A305-096A |
| α-TUBA4A (WB) | Abcam | ab7291 |
| Chemicals, peptides, and recombinant proteins | ||
| RNase | Promega | Cat#527491 |
| Trypsin | Promega | Cat#487603 |
| TMT11-131C label reagent | Thermo Scientific | Cat#A34808 |
| 5-Ethynyl uridine | Thermo Fisher Scientific | Cat#E10345 |
| Deposited data | ||
| Raw MS data | This paper | ftp://massive.ucsd.edu/v06/MSV000093915/ |
| eCLIP data | This paper | GEO: GSE230717 |
| Interactive IP-MS+SEC-MS interactome explorer | This paper | https://github.com/mjlab-Columbia/rbp_analysis_interactive_tool |
| Raw Images (Mendeley) | This paper | doi: 10.17632/6n6c8bbgd7.1 |
| Uniprot human reference proteome | The UniProt Consortium, 2023 | https://www.uniprot.org/proteomes/UP000005640 |
| Human reference genome NCBI build 38, GRCh38 | Genome Reference Consortium | http://www.ncbi.nlm.nih.gov/projects/genome/assembly/grc/human/ |
| Experimental models: Cell lines | ||
| Lenti-X 293T Cell Line | Takara Bio | Cat#632180 |
| Oligonucleotides | ||
| shRNA ERH 1 | Sigma | Cat #SHCLNG |
| shRNA ERH 2 | Sigma | Cat #SHCLNG |
| shRNA SNRNP200 1 | Sigma | Cat #SHCLNG |
| shRNA SNRNP200 2 | Sigma | Cat #SHCLNG |
| T30-ATT-488 | Biosearch Technologies | T30-ATT-488 |
| Software and algorithms | ||
| SpectroMine v3.2 | Biognosys97 | https://biognosys.com/software/spectromine/ |
| Spectronaut v16.0 | Biognosys; Bruderer et al.97 | https://biognosys.com/software/spectronaut/ |
| CCprofiler | Heusel et al.42 | https://github.com/CCprofiler/CCprofiler |
| Skipper | Boyle et al.103 | https://github.com/YeoLab/skipper/ |
| Skewer | Jiang et al.104 | https://github.com/relipmoc/skewer |
| Fastp 0.11.5 | Chen et al.105 | https://github.com/OpenGene/fastp |
| STAR v 2.7.6 | Dobin et al.106 | https://github.com/alexdobin/STAR |
| Fiji | Schindelin et al.107 | https://imagej.net/software/fiji/ |
| Metadensity (v0.0.1) | Her et al.85 | https://github.com/algaebrown/Metadensity |
| IGV | Robinson et al.82 | https://igv.org/doc/desktop/ |
| Cytoscape | Shannon et al.93 | https://cytoscape.org/ |
| Other | ||
| Yarra SEC-4000 column | Phenomenex | Cat#00H-4514-K0 |