Abstract
Colorectal cancer is a leading cause of global mortality and presents a significant barrier to improving life expectancy. The primary objective of this study was to discern a unique differentially expressed gene (DEG) that exhibits a strong association with colorectal cancer. By achieving this goal, the research aims to contribute valuable insights to the field of translational medicine. We performed analysis of colorectal cancer microarray and the TCGA colon adenoma carcinoma (COAD) datasets to identify DEGs associated with COAD and common DEGs were selected. Furthermore, a pan-cancer analysis encompassing 33 different cancer types was performed to identify differential genes significantly expressed only in COAD. Then, comprehensively in-silico analysis including gene set enrichment analysis, constructing Protein–Protein interaction, co-expression, and competing endogenous RNA (ceRNA) networks, investigating the correlation between tumor-immune signatures in distinct tumor microenvironment and also the potential interactions between the identified gene and various drugs was executed. Further, the candidate gene was experimentally validated in tumoral colorectal tissues and colorectal adenomatous polyps by qRael-Time PCR. GUCA2A emerged as a significant DEG specific to colorectal cancer (|log2FC|> 1 and adjusted q-value < 0.05). Importantly, GUCA2A exhibited excellent diagnostic performance for COAD, with a 99.6% and 78% area under the curve (AUC) based on TCGA-COAD and colon cancer patients. In addition, GUCA2A expression in adenomatous polyps equal to or larger than 5 mm was significantly lower compared to smaller than 5 mm. Moreover, low expression of GUCA2A significantly impacted overall patient survival. Significant correlations were observed between tumor-immune signatures and GUCA2A expression. The ceRNA constructed included GUCA2A, 8 shared miRNAs, and 61 circRNAs. This study identifies GUCA2A as a promising prognostic and diagnostic biomarker for colorectal cancer. Further investigations are warranted to explore the potential of GUCA2A as a therapeutic biomarker.
Supplementary Information
The online version contains supplementary material available at 10.1007/s10238-024-01512-y.
Keywords: Colorectal cancer, GUCA2A, Prognostic biomarker, Diagnostic biomarker, CeRNA network, Integrated bioinformatics analysis
Introduction
Cancer is a leading cause of mortality worldwide and poses a substantial challenge to increasing life expectancy [1]. Among the various types of cancer, colorectal cancer (CRC) ranks as one of the most prevalent globally. Recent epidemiological statistics indicate that CRC constitutes 10.2% of all malignant tumors, making it the third most common cancer, with the number of deaths accounting for 9.2%, ranking second [2, 3]. The incidence of CRC continues to rise, necessitating a deeper understanding of its molecular basis.
The development and progression of colon cancer involve complex interactions among multiple genes and molecular alterations in somatic cell genomes [4]. In recent decades, extensive data mining analyses have been conducted on various human cancers, including mRNA, microRNA, long non-coding RNA, and DNA methylation studies [5–8]. The identification of diagnostic and prognostic biomarkers in cancer has become increasingly important, aided by advancements in sequencing technologies and bioinformatics tools [9–11]. Consequently, the identification of additional potential biomarkers related to colon cancer progression expands the options for diagnosis and treatment.
Several studies have utilized quantitative reverse transcription polymerase chain reaction (RT-qPCR) and gene microarray profiling to identify genes associated with recurrence risk and prognosis in colon cancer patients [12, 13]. Gene microarray profiling, a high-throughput method for assessing mRNA expression in tissues, has emerged as a promising tool in medical oncology [14]. It allows for the analysis of differential gene expression between tumor tissues and normal control tissues, providing insights into the molecular pathogenesis of various cancer types and facilitating the identification of potential target genes and signaling pathways for precision therapy [15]. Previous studies utilizing microarray technology have examined gene expression profiles in CRC and identified differentially expressed genes (DEGs) [16, 17]. Numerous gene expression datasets for CRC are available in the Gene Expression Omnibus (GEO) database, which have been utilized to identify DEGs in CRC [18–21]. However, individual studies have reported inconsistent results due to variations in sample collection, platform types, and analysis methods Additionally, large-scale studies evaluating the prognostic value of DEGs in CRC are lacking [22]. In recent years, RNA-seq analysis based on next-generation sequencing (NGS) has become the gold standard for whole transcriptome gene expression analysis. This approach enables the generation of mechanistic hypotheses regarding molecular events in cells and tissues [23]. Databases such as The Cancer Genome Atlas (TCGA) provide RNA-Seq-based transcriptome data for various cancer types, including primary cancer and matched normal samples, offering valuable resources for comprehensive analyses.
Here, we aimed to identify a gene differentially expressed just in colon adenocarcinoma. We employed GEO datasets and validated our findings using the TCGA COAD dataset to determine DEGs in CRC compared to noncancerous tissues. Subsequently, pan-cancer analysis was performed to identify colon adenocarcinoma-specific DEGs. Our investigation led to the identification of GUCA2A as a specific diagnostic and prognostic marker for COAD. In addition, we investigated GUCA2A gene expression in CRC tissues and adenomatous polyps. GUCA2A gene exerts a significant influence on the activity of infiltrating lymphocytes, holding promising clinical implications for the diagnosis, treatment, and prognosis prediction of colon adenocarcinoma.
Materials and methods
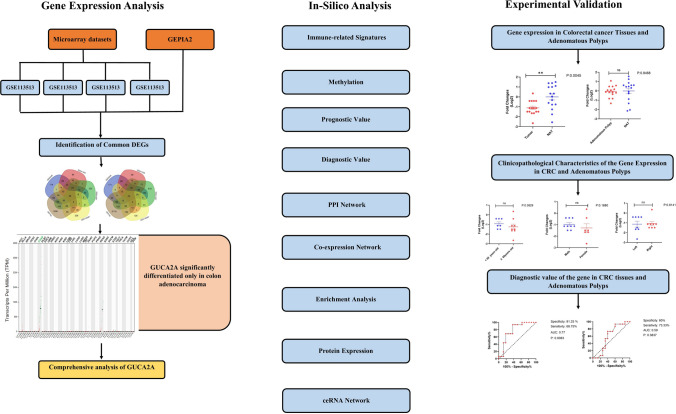
To gain insights into the expression, regulation, interactions, and potential therapeutic implications of a unique differentially expressed gene in COAD, a series of analysis were employed (Fig. 1): (1) Identification of Differentially Expressed Genes (DEGs): Four microarray datasets were analyzed, and DEGs were identified. Intersection analysis with the GEPIA2 database led to the identification of 88 common DEGs; (2) Differential Expression Analysis of GUCA2A: Using the GEPIA2, OncoDB, and cBioPortal databases, we analyzed the expression levels of GUCA2A in COAD. This analysis provided valuable information on the transcriptional activity and differential expression of GUCA2A in COAD samples; (3) Analysis of Methylation and Genetic Alterations: The methylation status and genetic alterations of GUCA2A were explored using available data from the GEPIA2, OncoDB, and cBioPortal databases. This analysis provided insights into potential epigenetic and genomic regulatory mechanisms associated with GUCA2A in COAD; (4) Co-expression Analysis and Protein–Protein Interaction (PPI) Networks: Co-expression genes and protein–protein interaction networks associated with GUCA2A were investigated using the LinkedOmics and STRING databases, respectively. These analyses allowed us to explore potential functional associations and interactions between GUCA2A and other genes in COAD; (5) Pathway Enrichment Analysis: The Enrichr database was utilized to perform pathway enrichment analysis on GUCA2A and its co-expression genes. This analysis provided a comprehensive understanding of the biological processes and pathways in which GUCA2A may be involved; (6) Correlation Analysis of Tumor-Immune Signatures: The TISIDB database was used to explore the correlation between tumor-immune signatures in different tumor microenvironments and GUCA2A expression. This analysis provided insights into the potential interactions between GUCA2A and the tumor immune response in COAD; (7) Identification of miRNAs and ceRNAs: Using the miRDB, miRWalk, TargetScan, and circBank databases, we identified miRNAs targeting GUCA2A and their corresponding competing endogenous RNAs (ceRNAs). This analysis revealed the regulatory network involving GUCA2A, miRNAs, and circRNAs; (8) Examination of GUCA2A-Interacted Drugs: The DGIdb database was explored to identify drugs that interact with GUCA2A, potentially offering therapeutic implications for COAD; and (9) GUCA2A gene expression was experimentally investigated in tumor/adjacent normal tissue and colorectal adenomatous polyps/normal adjacent tissues.
Fig. 1.
Study Workflow for Comprehensive Analysis of GUCA2A in colorectal and cancer. After pan cancer analyzing of 88 common DEGs between 4 microarray datasets and GEPIA2 database, GUCA2A was found as a gene which is significantly differentiated only in COAD. Then, via several bioinformatics databases and experimentally validation we comprehensively and systematically studied the roles of GUCA2A in colorectal cancer and polyps
Bioinformatics analysis
Microarray datasets and identification of DEGs
To acquire the gene expression datasets of CRC, the microarray data were downloaded from the GEO database (https://www.ncbi.nlm.nih.gov/geo/https://www.ncbi.nlm.nih.gov/gds/) [24]. The datasets were selected based on the following inclusion criteria: “Colorectal cancer”, and “Expression profiling by array”, and “Homo sapiens”, and “tissues”. Next, profiles which examined a particular CRC stage or used drugs were excluded. After comprehensive analysis, GSE9348 [platforms: 570, [HG-U133_Plus_2] Affymetrix Human Genome U133 Plus 2.0 Array, and colorectal tumoral tissue: colorectal healthy tissue = 70;12], GSE113513 [platforms: GPL15207] Affymetrix Human Gene Expression Array, and colorectal tumoral tissue: noncancerous surrounding tissue = 14:14], GSE41657 [platforms: GPL6480, Agilent-014850 Whole Human Genome Microarray 4 × 44K G4112F, and colorectal tumoral tissue: colorectal normal mucosa = 25:12], and GSE146587 [platforms: GPL17077, Agilent-039494 SurePrint G3 Human GE v2 8 × 60K Microarray 039381,and colorectal tumoral tissue: noncancerous tissue = 6:6] were selected for further analysis (Table 1). CEL files from Affymetrix microarrays were pre-processed using the Affy package (version 1.74.0; http://bioconductor.org/packages/release/bioc/html/affy.html) in R software (version 4.4.2; http://www.r-project.org/). The Robust Multi-array Average (RMA) method [25] was used for the pre-processing, which included background correcting, normalizing and calculating expression. The latest annotation files were downloaded for re-annotation. The Limma package (version 3.52.2) [26] in R software was subsequently used to screen DEGs between CRC and matched normal tissues in the microarray. A |log2 (FC)| value of ≥ 1 and a q-value of < 0.05 were considered as the cut-off criteria for the identification of DEGs.
Table 1.
Characteristic of the studied microarray dataset
| No | GSE no | GPL/platform | No. of sample | Sample type | Update (year) | Race | Total | |
|---|---|---|---|---|---|---|---|---|
| CRC NCT (n) | ||||||||
| 1 | GSE113513 | Affymetrix Human Gene Expression Array | 14 | 14 | Colorectal tissue | 2018 | Unknown a | 28 |
| 2 | GSE41657 | Agilent-014850 Whole Human Genome Microarray 4 × 44K G4112F | 25 | 12 | Colorectal tissue | 2019 | Unknown | 37 |
| 3 | GSE146587 | Agilent-039494 SurePrint G3 Human GE v2 8 × 60K Microarray 039381 | 6 | 6 | Colorectal tissue | 2021 | Unknown | 12 |
| 4 | GSE9348 | Affymetrix Human Genome U133 Plus 2.0 Array | 70 | 12 | Colorectal tissue | 2019 | Unknown | 82 |
a The data were collected in the USA/South San Francisco, but the race of subjects is unknown
CRC, Colorectal Cancer; NCT, Non-cancerous tissue
GEPIA2 database and identification of DEGs
Next, the TCGA COAD dataset were investigated using GEPIA2 (http://gepia2.cancer-pku.cn/http://gepia2.cancerpku.cn) to determine all COAD-associated DEGs among high throughput RNA-Seq data. GEPIA2 is a web-based tool for assessing the transcriptional profiles of human cancers and normal tissues utilizing the TCGA database and the Genotype-Tissue Expression (GTEx) projects [27]. Genes with |log2FC|> 1 and adjusted q-value < 0.05 were considered significant. All the CRC-associated DEGs in these datasets were selected for further study.
Identification of a gene significantly differentiated only in colon adenocarcinoma
Subsequently, a Venn diagram (https://bioinformatics.psb.ugent.be/webtools/Venn/) was created to identify the common DEGs between the four datasets and the GEPIA2 COAD-TCGA data. To identify a gene significantly differentiated only in colon adenocarcinoma, all the identified common DEGs were investigated in a pan cancer model among 33 cancer types through utilizing the GEPIA2 database.
OncoDB
OncoDB (https://oncodb.org/) is an online database resource to explore abnormal patterns in gene expression as well as viral infection that are correlated to clinical features in cancer. All the analysis results are presented in OncoDB with a flexible interface to search for data related to RNA expression, DNA methylation, viral infection, and clinical features of the cancer patients [28]. Expression and methylation analyzing of the identified gene was performed based on clinical profiles include gender, pathological stages, and Body mass index (BMI). Some viruses such as cytomegalovirus and herpes virus can cause changes in the expression of genes in colon adenocarcinoma, so onco-analyzing of the gene was performed using OncoDB database.
UALCAN
To investigate the prognostic values of GUCA2A in COAD patients, data from the TCGA COAD datasets of TCGA were used to perform the survival analyses utilizing UALCAN database (http://ualcan.path.uab.edu/) [29].
Investigating diagnostic value of GUCA2A
To evaluate the diagnostic feature of GUCA2A, gene expression profile of GUCA2A in COAD and normal tissue was obtained from OncoDB database. Furthermore, Then, we calculate sensitivity, specificity, and Area under the ROC Curve (AUC) and evaluated the diagnostic value of GUCA2A for COAD tissues and normal counterparts using https://analysistools.cancer.gov/biomarkerTools.
Co-expression analysis and PPI network
In this study top 50 positively and negatively correlated genes with GUCA2A in colon cancer was retrieved using LinkedOmics [30]. Protein–protein interaction (PPI) network for GUCA2A was constructed using STRING (https://string-db.org), and results were visualized in Cytoscape software (version 3.9.1; https://cytoscape.org). Also, top genes that have similar expression pattern with GUCA2A obtained from GEPIA2 database [27]. Then, intersection analysis between proteins interacted with GUCA2A and the top 100 similar expression genes was performed.
Gene set enrichment analysis
To evaluate potential GUCA2A gene functional annotation and pathway enrichment, Gene Oncology (GO) including biological processes (BP), molecular functions (MF), and cellular component (CC), and the Kyoto Encyclopedia of Genes and Genomes (KEGG) were analyzed by using Enrichr (https://maayanlab.cloud/Enrichr/) database [31]. Enrichment analyzes were performed by GUCA2A and its interacting genes.
miRNA, ceRNA, and ceRNA network
The miRNAs targeting GUCA2A were predicted based on four different databases, including miRDB [32], miRWalk[33], and TargetScan [34], and miRTarBase [35]. Next, common miRNAs were identified through intersection analysis. The circRNAs that regulate GUCA2A were identified using the circBank databases [36]. CircRNAs with a total score of over 1000 were chosen as a cutoff and subjected to further analysis. A competitive endogenous RNA (ceRNA) network was created using cytoscape [37]. ceRNA included GUCA2A, miRNAs targeting GUCA2A, and circRNAs sponging identified miRNAs.
Genetic alteration of GUCA2A
The cBioPortal (https://www.cbioportal.org/) was searched for genetic alteration information of GUCA2A [38]. All Colorectal Adenocarcinoma studies were included. Somatic mutation frequency and genomic information of GUCA2A mutation were explored. Also, the mutations sites were obtained from “mutations” modules.
Human Protein Atlas
The Human Protein Atlas (HPA) database (http://www.proteinatlas.org) was utilized to gather immunohistochemistry data for the GUCA2A protein in COAD and normal tissues [39]. The evaluation of protein expression in the HPA is based on both the fraction of stained cells and the intensity of the staining. In the HPA database, protein expression ranks are categorized by staining intensity levels (strong, moderate, weak, negative) and the fraction of stained cells (greater than 75%, between 25 and 75%, and less than 25%). This results in classifications of high expression (strong with > 25% stained cells), medium expression (strong with 25% stained cells), low expression (moderate with 25% stained cells), and not detected (weak or negative with < 25% stained cells).
TISIDB
TISIDB (http://cis.hku.hk/TISIDB/) is a web portal for tumor and immune system interaction, which integrates multiple heterogeneous data types [40]. We explored associations between GUCA2A expression and immune-related signatures including immune cells, immunoinhibitors, immunstimulators and HLA molecules across human cancers.
DGIdb
The Drug-Gene Interaction Database (https://www.dgidb.org/) is a web resource that provides information on drug-gene interactions from publications, databases, and other web-based sources [41]. We identified possible therapeutic medicines utilizing DGIBD.
Experimental validation
Human sample collection
In this study, polyp and colorectal cancer samples were obtained from patients referred to Taleghani Hospital. Based on the inclusion and exclusion criteria, 15 biopsy samples of colorectal adenomatous polyps and 15 normal adjacent tissues (NATs) samples, as well as 16 colon cancer tissues with normal adjacent tissues were obtained. Patients undergoing chemotherapy and taking special drugs (anti-inflammatory) were excluded from this study. The clinical information of the patients was collected using a questionnaire. Tissues were stored in nitrogen and at -80°C for future evaluation. The ethical committee of the Institute of Gastroenterology and Liver Diseases, Shahid Beheshti University of Medical Sciences, approved the study (IR. SBMU.RIGLD.REC.1399.036), and written informed consent was obtained from all participants before entering the study.
RNA extraction and quality control
Total RNA was extracted from all samples Favor PrepTM total RNA extraction kit (FAVORGEN, Taiwan) according to the kit instructions. RNA concentration and purity ratios (OD260/280, OD260/230) were evaluated by NanoDrop 1000 spectrophotometer (NanoDrop Technologies, Wilmington, DE, USA). The integrity of RNA was determined by electrophoresis on a denaturing 1.5% agarose gel.
cDNA synthesis
For cDNA synthesis, total RNA was reversed transcribed using AddScript cDNA synthesis kit (Add bio,Korea) according to the protocol kit is following:. the tubes were placed on ice where 4 μL of 5 × primer script buffer, 1 μL RT enzyme, 2 μL oligo dt primer or 2 μL random hexamer, 2 μL dNTP, 1 µg RNA template, and up to 20 μL RNA free distilled water (dH2O) were added. The cDNA synthesis was performed as follows: 25 °C for 10 min, 50 °C for 60 min, 80 °C for 5 min for inactivation of the reverse transcriptase enzyme and 12 °C for ∞ for hold temperature. Next, cDNA products were stored at − 20 °C. Note that in all reactions, the same concentrations of RNA samples were used (RNA adjustment).
Primer design
GUCA2A and Glyceraldehyde 3 phosphate dehydrogenase (GAPDH) primers were designed by Gene Runner software (version 6.5). Also, the specificity of the primers has been examined in the http://blast.ncbi.nlm.nih database. Primers for GUCA2A and GAPDH (housekeeping gene) were as follow: Forward GUCA2A: 5′- ATGAATGCCTTCCTGCTCTC -3′, Reverse GUCA2A: 5′-TTCCATCCTGCACGGTGAC-3′, ForwardGAPDH:5′-CTCAAGATCATCAGCAATGCCT-3′, Reverse GAPDH: 5′-ACAGTCTTCTGGGTGGCAGT 3′.
Real time-PCR
The qPCR was performed by Rotor-Gene Q real-time PCR cycler (Qiagen, Germany) and RealQ plus 2 × Master Mix Green (Ampliqon, Denmark). The Real-time PCR conditions were: 95 °C for 5 min, followed by 40 cycles of 95 °C for 10 s and 61 °C for 35 s, and 72 °C for 20 s. Fold change of gene expression was evaluated by 2-ΔΔct method.
Statistical analysis
All results were analyzed by Graph pad Prism software version 8 (Graph Pad Software, California, USA). The data were non-normally distributed and the non-parametric test was used. Specifically, student t-test and one-way ANOVA test were performed. p-value < 0.05 was considered statistically significant.
Results
Identification of genes differentially expressed among microarray datasets
To acquire the gene expression CRC datasets, the microarray data were downloaded from the GEO database. Based on the inclusion/exclusion criteria, CRC and normal or adjacent mucosa tissue gene expression profile of GSE41328, GSE41657, GSE9348 and GSE146587 were selected. By using q-value < 0.05 and [logFC] > 1 as cut-off criterion, 861, 1932, 1568, and 1107 differentially expressed genes (DEGs) were extracted from the expression profile datasets of GSE41328, GSE41657, GSE9348 and GSE146587, respectively (Supplementary Table 1).
GUCA2A was founded as a DEG which is significantly differentiated only in colon adenocarcinoma
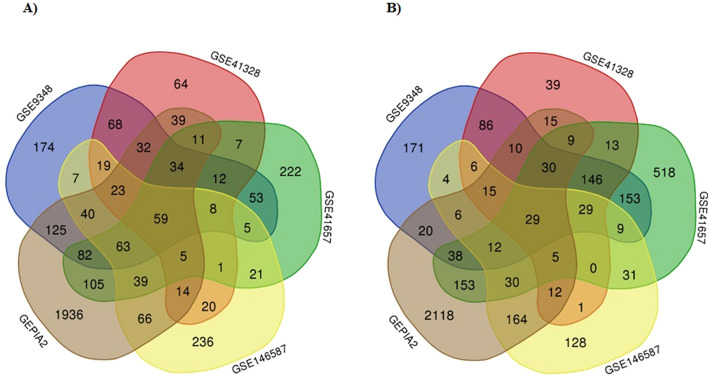
To determine a DEG which is significantly differentiated only in colon adenocarcinoma, we first extracted TCGA-COAD associated DEGs from GEPIA2 database. With the q-value < 0.01 and [logFC] > 1 as cut-off criterion, 5356 DEGs were detected (Supplementary Table 1). After integrated bioinformatics analysis, a total of 88 common DEGs were identified among the five profile datasets (Supplementary Table 1), including 59 up-regulated genes and 29 down-regulated genes in the colorectal cancer tissues compared to normal colon tissues (Fig. 2A and B, respectively).
Fig. 2.
A total of 88 common DEGs were identified among the five profile datasets. A Common up-regulated DEGs between datasets. B Common down-regulated DEGs between datasets
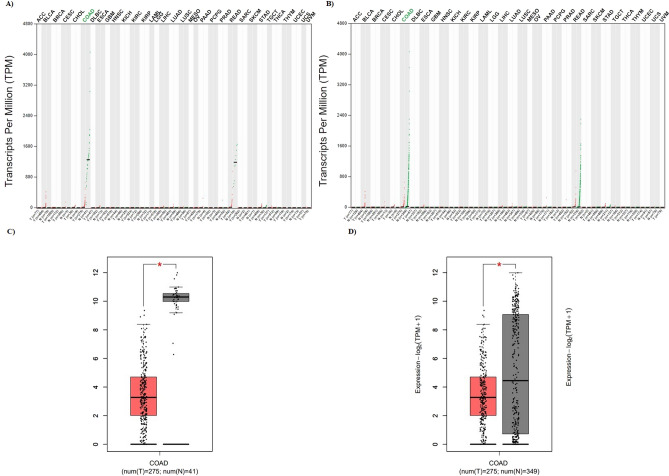
Second, all 88 common were analyzed in a pan cancer model using the GEPIA2 database. Finally, GUCA2A was founded as a DEG which is significantly differentiated only in colon adenocarcinoma (Fig. 3A). GUCA2A was not only expressed at low levels in tumor tissues compared to adjacent normal tissues, but also than the normal tissues from normal samples (Fig. 3B). The box plots for GUCA2A expression in COAD patients compared to adjacent normal colon tissue and normal colon tissue in normal patients are shown in Fig. 3C and D.
Fig. 3.
Pan cancer model for GUCA2A expression. A GUCA2A was founded as a DEG which is significantly differentiated only in colon adenocarcinoma among 33 cancers in tumor tissues compared to adjacent normal tissues and normal tissues from normal samples. B GUCA2A was founded as a DEG which is significantly differentiated only in colon adenocarcinoma among 33 cancers in tumor tissues compared to normal tissues from normal samples. Box plots show that GUCA2A significantly downregulated in COAD samples compared to adjacent normal tissues C and normal tissues in normal patients D
Oncovirus analyzing of GUCA2A was performed using OncoDB database. Cytomegalovirus and Herpes virus do not significantly change the expression of GUCA2A in colon adenocarcinoma (Supplementary File 2 Fig. 1). In the clinical parameter analysis of GUCA2A by expression level, GUCA2A expression in was significantly different between races (p value = 0.003) (Supplementary File 2 Fig. 2). There were no significant differences in GUCA2A expression between gender, BMI, and pathological stages (Supplementary File 2 Fig. 2).
Investigating the diagnostic and prognostic value of GUCA2A
To investigate the diagnostic values of GUCA2A in colon adenocarcinoma, expression level of GUCA2A in COAD and normal patients in OncoDB database was used. The Area under the ROC Curve (AUC) was used to calculate sensitivity and specificity. With 98% sensitivity, 95% Specificity and 99.6% AUC, GUCA2A can be used as a diagnostic factor for COAD (Fig. 4A). To investigate the prognostic values of GUCA2A in colon adenocarcinoma, data from colon adenocarcinoma TCGA datasets were used to perform the survival analyses utilizing UALCAN database. Low expression of GUCA2A was significantly affected on patient’s overall survival (Fig. 4B).
Fig. 4.
Diagnostic and prognostic value of GUCA2A. A ROC curve of GUCA2A for colon adenocarcinoma. With 0.95 sensitivity, 0.98 specificity, and 0.996 AUC, GUCA2A can be identified as a diagnostic biomarker for colon adenocarcinoma. B Survival analysis of GUCA2A. Low expression of GUCA2A was significantly affected on patient’s overall survival
Methylation of GUCA2A
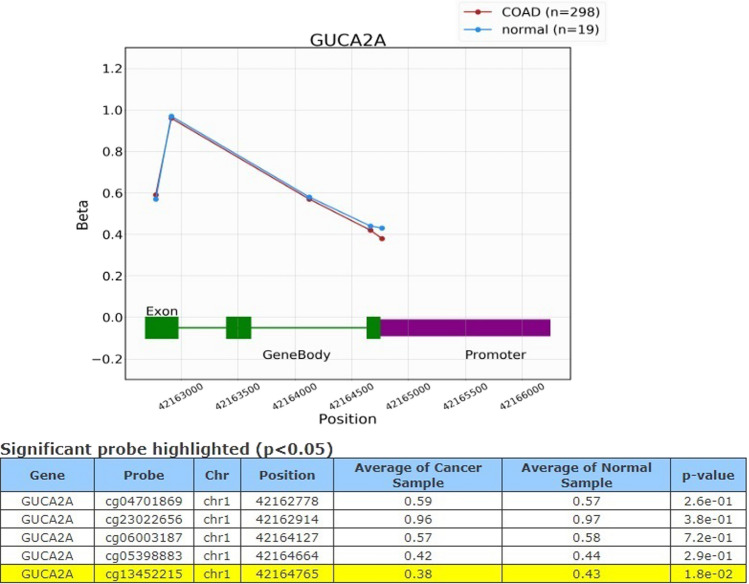
Further, we examined the Methylation levels within the GUCA2A gene using OncoDB database. The results showed significant differential methylated levels of the gene between normal and COAD tissues in ‘’cg13452215’’ probe which was hypo methylated (Fig. 5). In addition, in the clinical parameter analysis of GUCA2A by methylation level, significant differences were seen between BMI (p value = 0.029) and pathological stages (p value = 0.0093). There were no significant differences in GUCA2A methylation regarding Race and gender (Supplementary File 2 Fig. 3).
Fig. 5.
GUCA2A methylation levels. Significant hypo methylation in ‘’cg13452215’’ probe was observed in COAD tissues compared to normal
Association between GUCA2A with immune-related signatures
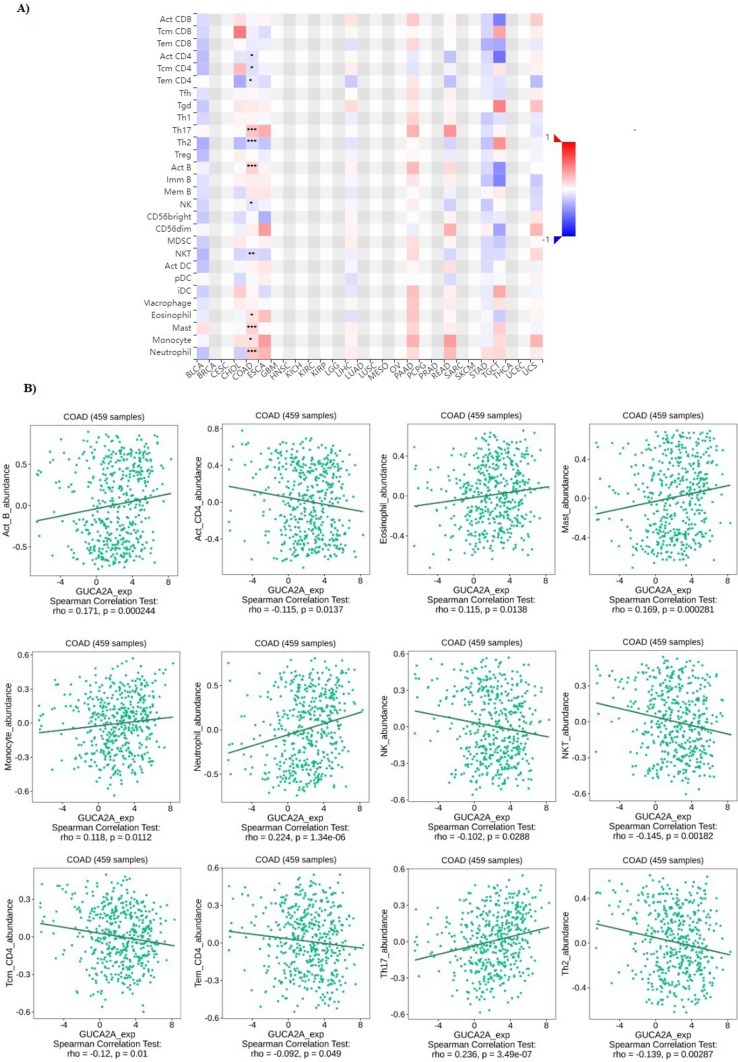
It is well established that the immune system plays an important role in tumor development, progression, and therapeutic response, and immune modulators in the tumor immune microenvironment (TIME) may have a significant influence on the infiltrating lymphocytes’ activity [42, 43]. Also, immune cells may serve as an independent predictor of survival and response to chemotherapy [44, 45]. Therefore, it is necessary to investigate the relationship between GUCA2A with TIME. The correlation between GUCA2A expression and immune signatures in colon adenocarcinoma performed via TISIDB (Fig. 6A). There was significant correlation between GUCA2A expression and CD4 + T cell (Act-CD4), central memory CD4 + T cell (Tcm_CD4), Effector memory CD4 + T cell (Tem-CD4), Type 17 T helper cell (Th17), Type 2 T helper cell (Th2), Activated B cell (Act-B cell), Natural killer cell (NK), Natural killer T cell (NKT), Eosinophil, Mast cell, Monocyte, and Neutrophil (Fig. 6B).
Fig. 6.
The relationship between GUCA2A expression and immune cells infiltration in colon adenocarcinoma. (A) Analysis between GUCA2A expression and immune infiltration levels. (B) Significant Correlations between GUCA2A expression and immune infiltration levels. * p value < 0.05, **p value < 0.01, ***p value < 0.001
Additionally, the correlation analysis was performed between GUCA2A expressions and immune stimulators in colon adenocarcinoma (Fig. 7A). A significant correlation was observed between GUCA2A expression and CD27, CD40LG, CD48, CXCR4, ENTPD1, HHLA2, ICOSLG, IL6, KLKR1, MICB, NT5E, PVR, TMEM173, TMIGD2, TNFRSF17, TNFRSF25, TNFRSF4, TNFSF13B, TNFSF4, TNFSF9, and ULBP1 (Fig. 7B).
Fig. 7.
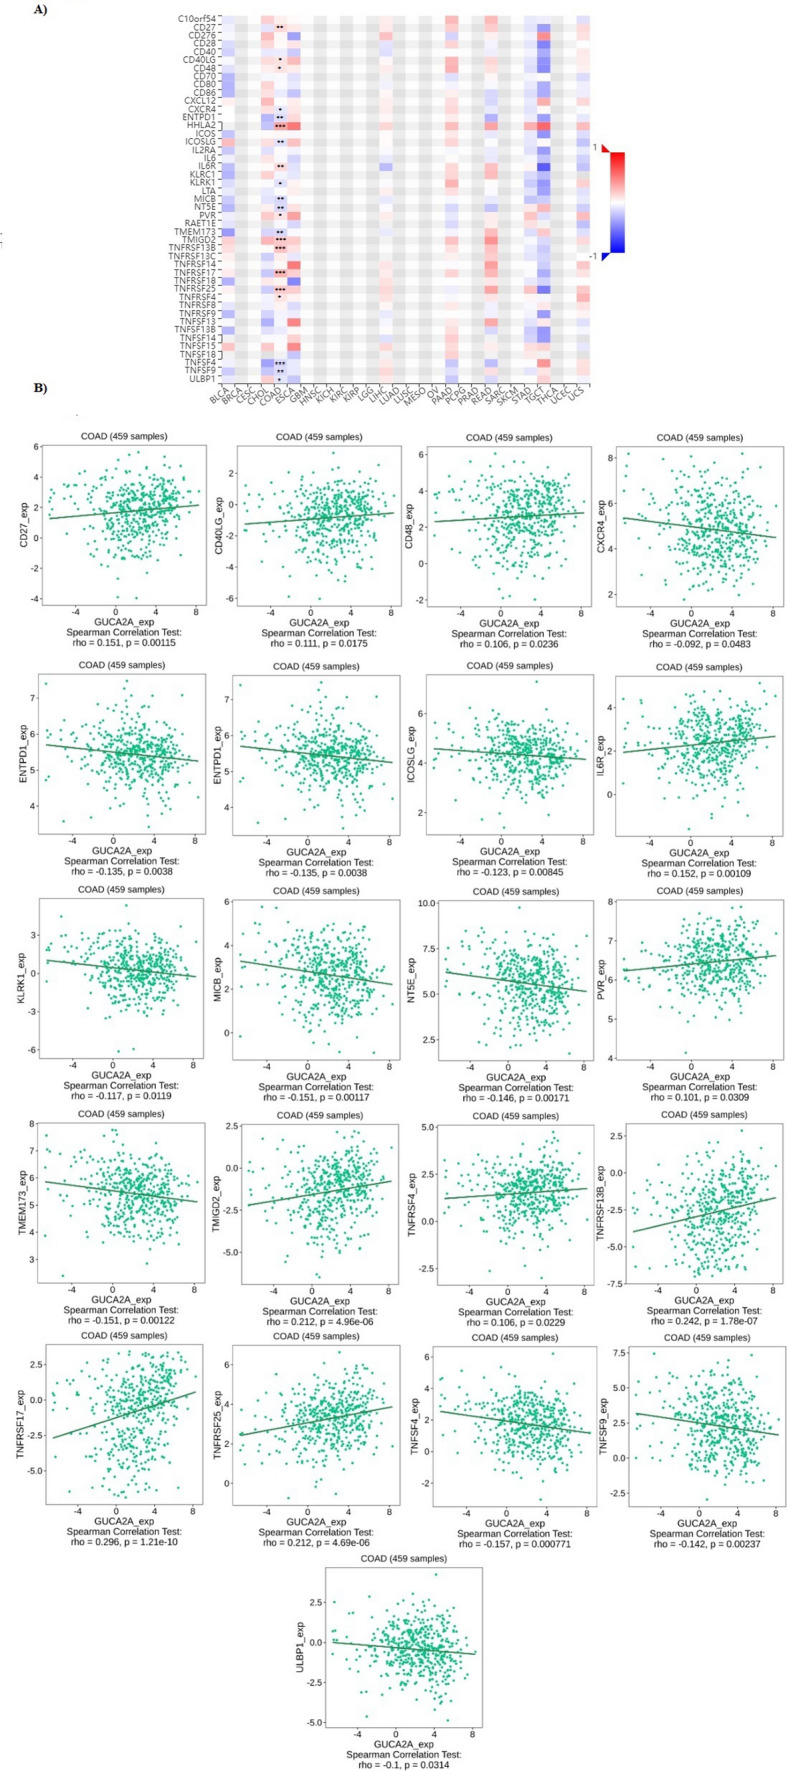
The relationship between GUCA2A expression and Immune stimulators in colon adenocarcinoma. A Analysis between GUCA2A expression and immune stimulators levels. B Significant Correlations between GUCA2A expression and immune stimulators levels. * p value < 0.05, **p value < 0.01, ***p value < 0.001
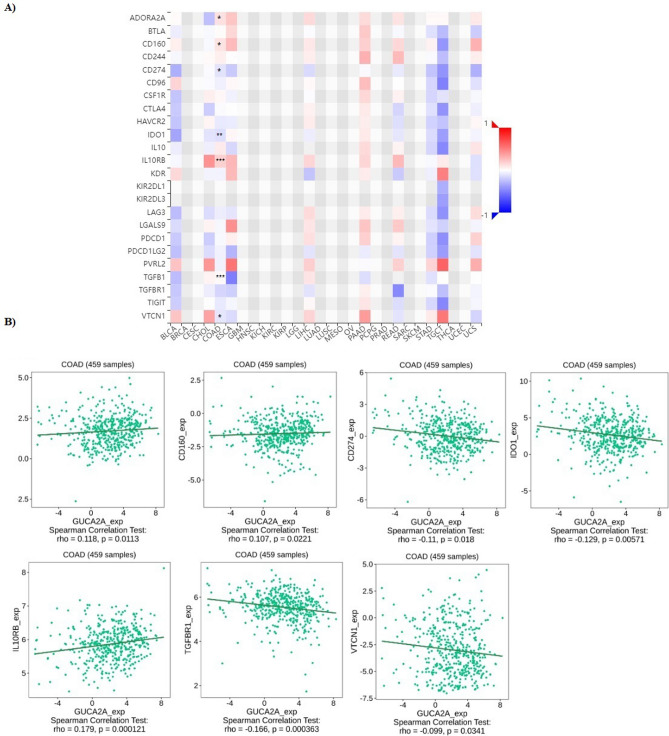
Also, correlation GUCA2A expression with immuno-inhibitors in colon adenocarcinoma performed (Fig. 8A). There was significant correlation between GUCA2A expression and ADORA2A, CD160, CD244, CD274, IDO1, IL10RB, TGFBR1, and VTCN1 (Fig. 8B).
Fig. 8.
The relationship between GUCA2A expression and immune-related signatures in COAD. (A) Analysis between GUCA2A expression and immune infiltration levels. B Analysis between GUCA2A expression and immuno-inhibitors levels. *P-value < 0.05, **p value < 0.01, ***p value < 0.001
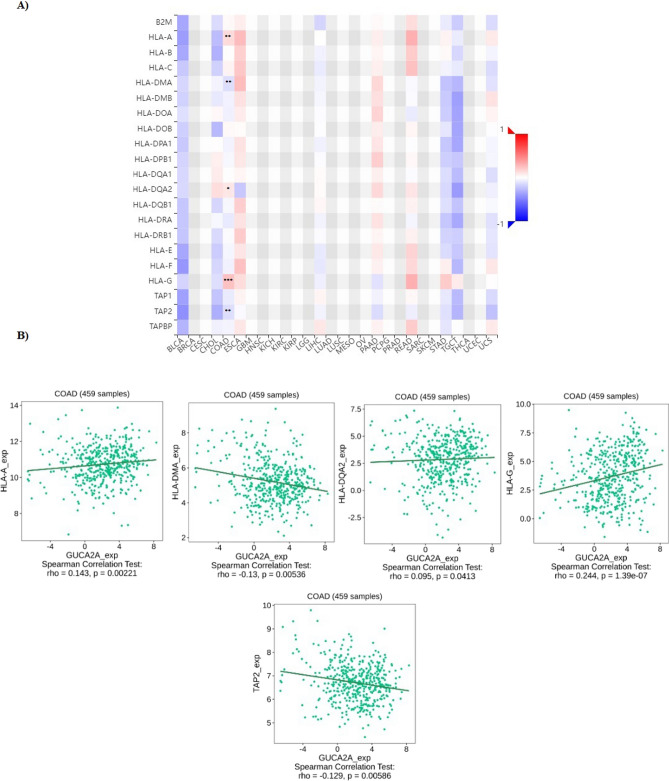
Furthermore, correlation between GUCA2A expression with MHC molecules in colon adenocarcinoma showed significant correlation between GUCA2A expression and HLA-A, HLA-DMA, HLA-DQA2, HLA-G, and TAP2 (Fig. 9).
Fig. 9.
The relationship between GUCA2A expression and MHC molecules in COAD. (A) Analysis between GUCA2A expression and MHC molecule levels. B Significant Correlations between GUCA2A expression and MHC molecules levels. * P-value < 0.05, **p value < 0.01, ***p value < 0.001
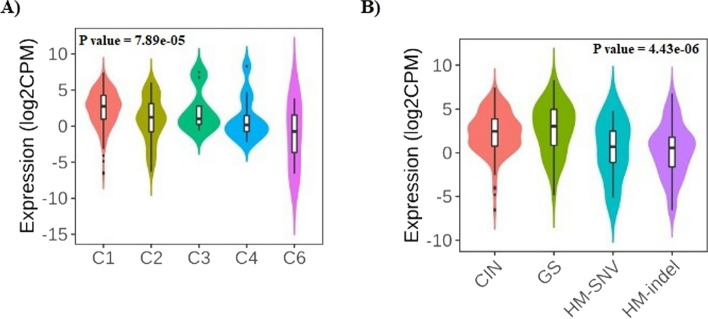
In addition, the role of GUCA2A expression on immune and molecular subtypes among human cancers was determined using TISIDB website. Immune subtypes were classified into six types, including C1 (wound healing), C2 (IFN-gamma dominant), C3 (inflammatory), C4 (lymphocyte depleted), C5 (immunologically quiet) and C6 (TGF-b dominant). The results showed that GUCA2A expression was related to different immune subtypes in COAD (Fig. 10A). Furthermore, GUCA2A expression differed in different immune subtypes of COAD (Fig. 10B). Based on the above results, we concluded that GUCA2A expression significantly differs in various immune subtypes as well as molecular subtypes of COAD.
Fig. 10.
GUCA2A expression and immune and molecular subtypes in colon adenocarcinoma. (A) The relationship between GUCA2A expression and COAD immune subtypes. B The relationship between GUCA2A expression and COAD molecular subtypes
GUCA2A co-expression analysis and PPI network
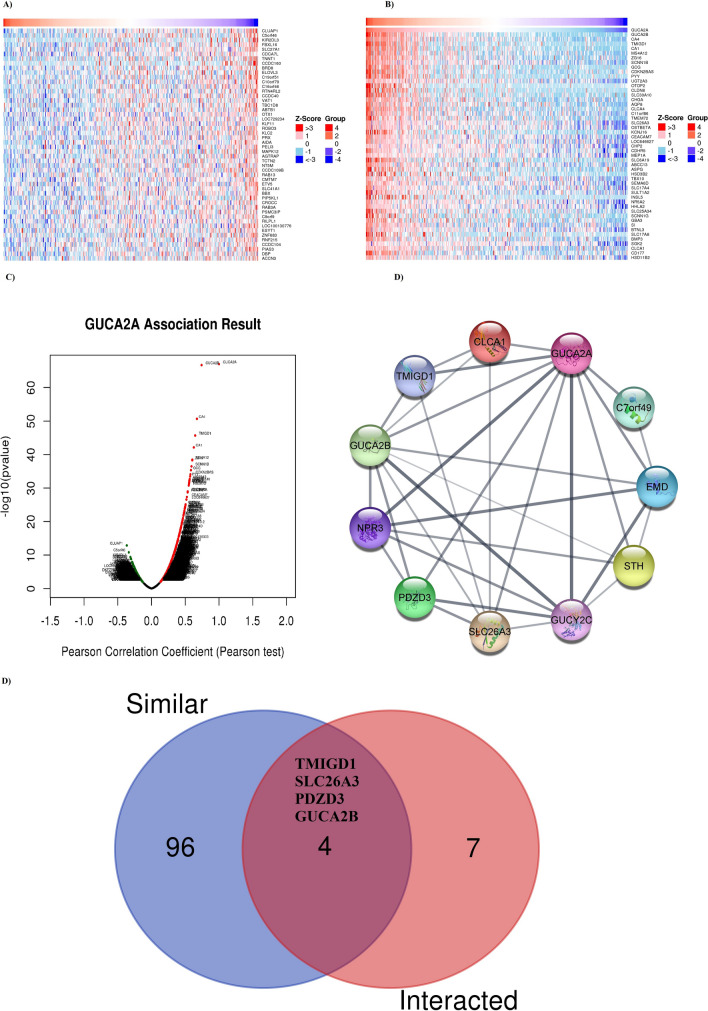
GUCA2A co-expressed genes were retrieved using LinkedOmics [30], which provided the data from TCGA-COAD cohort. The heatmap of the top 50 positively and negatively GUCA2A correlated genes are demonstrated in Fig. 11A and B, respectively. Besides, the volcano plot of the genes positively and negatively correlated with GUCA2A is shown in Fig. 11C. While GUCA2B, CA4, and TMIGD1 were found to be the highest positively correlated genes, CLUAP1, C5orf46, and KIR2DL3 were found to be the top 3 highest negatively correlated genes with GUCA2A. GUCA2A interacting genes were screened for protein–protein interactions (PPI) network construction using STRING database. A PPI network containing 11 genes with 5.82 average node degree and average local clustering coefficient of 0.824 was constructed (Fig. 11D). We also performed an intersection analysis between these 11 genes and the top 100 genes that have similar expression pattern with GUCA2A obtained from GEPIA2, which identified TMIGD1, SLC26A3, PDZD3 (NHERF4), and GUCA2B as common genes.
Fig. 11.
Co-expressed genes with GUCA2A and interaction network of proteins. Top 50 positively A and negatively B similar genes with GUCA2A in COAD. C Volcano plot demonstrating the positively and negatively correlated genes with GUCA2A. (D) Protein–protein interaction network of GUCA2A E Intersection analysis of GUCA2A similar and interacted genes
GO and KEGG pathway enrichment analysis
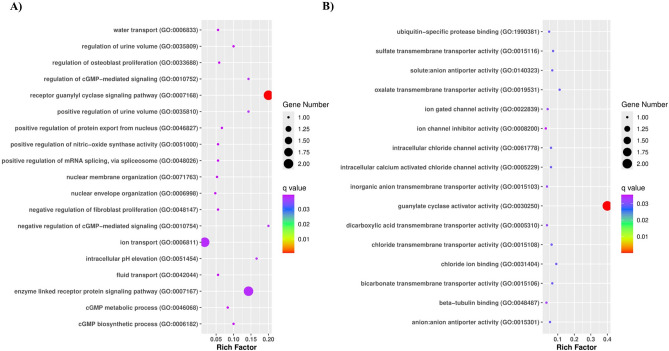
GO and KEGG pathway enrichment analysis were performed with GUCA2A and its interacting genes. For GO enrichment analysis, GUCA2A and its interacting genes were significantly enriched in 31 Biological processes (BPs) and 17 Molecular functions (MFs). Although sixteen cellular components were enriched, none of them were significant. The most significant biological process and molecular function were receptor guanylyl cyclase signaling pathway (GO:0007168; q-value = 8.52E-4, RF = 0.2) (Fig. 12A) and guanylate cyclase activator activity (GO:0030250; q-value = 7.69E-5, RF = 0.4) (Fig. 12B). Also, the most significant KEGG pathway was pancreatic secretion (q-value = 0.01, RF = 0.02).
Fig. 12.
GO enrichment analysis. A Biological process and B Molecular function (MF) of interacting genes
Integrated analysis of miRNA, mRNA, CircRNA ceRNA network
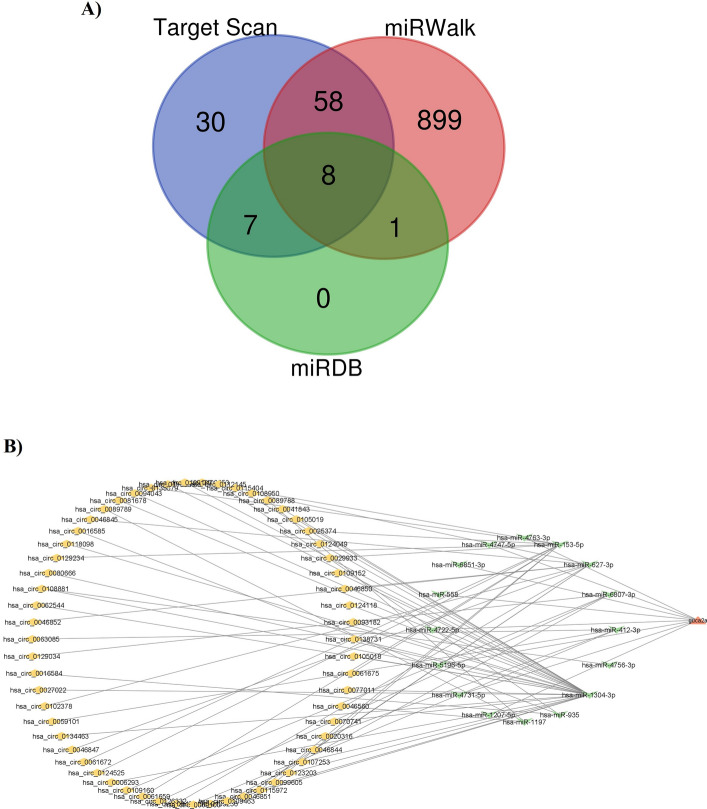
Upstream regulation of GUCA2A was analyzed by screening miRNAs targeted GUCA2A. Of 1003 miRNAs predicted targeting GUCA2A, 16 was found from miRDB, 966 from miRWalk, and 103 from Target Scan databases (Supplementary Table 1). No miRNA was detected by miRTarBase. As a result, hsa-miR-4747-5p, hsa-miR-4722-5p, hsa-miR-5196-5p, hsa-miR-4731-5p, hsa-miR-1207-5p, hsa-miR-4763-3p, hsa-miR-6851-3p, and hsa-miR-558 were screened as the most vital miRNA regulators by overlapping predictions of miRDB, miRWalk, and Target Scan databases (Fig. 13A). Additionally, 61 circRNAs were identified regarding 8 potential miRNAs regulating GUCA2A (Supplementary Table 1). The ceRNA constructed included GUCA2A, 8 shared miRNAs, and 61 circRNAs (Fig. 13B).
Fig. 13.
Integrated analysis of miRNA, mRNA, CircRNA, and ceRNA network. A miRNAs that target GUCA2A were screned using the data of mirDIP, miRWalk and Target Scan. Eight miRNAs were detected as the most vital miRNA regulators. B The ceRNA network includes GUCA2A, 8 miRNAs targeting GUCA2A, and 61 circRNAs sponging identified miRNAs
SNPs/Mutations of GUCA2A
Five mutation sites between amino acids 0 and 115, including 5 missense mutations were identified utilizing CbioPortal database (Table 2). Proteins changed by mutation of GUCA2A expression in COAD were P75S, E96K, A98T, A108V, and G114R. By analyzing whether an amino acid substitution affects protein function, P75S, A98T, A108V, and G114R were found as a deleterious mutation [46–48]. Also, A98T, A108V, and G114R were found as a probably damaging mutation.
Table 2.
Detailed analysis of mutations of GUCA2A gene in TCGA-COADa
| Protein Change | Mutation Type | Start Pos.b | End Posb | Ref | Variant Type | Functional Impact | ||||
|---|---|---|---|---|---|---|---|---|---|---|
| Mutation Assessorc | SIFTd | PolyPhen-2e | Sex | Ref | ||||||
| A98T | Missense | 42,628,633 | 42,628,633 | C | SNP | Medium | deleterious | Probably damaging | Female | Giannakis et al. [46] |
| G114R | Missense | 42,628,585 | 42,628,585 | C | SNP | Medium | deleterious | Probably damaging | Male | Giannakis et al.[46] |
| P75S | Missense | 42,629,134 | 42,629,134 | G | SNP | Medium | deleterious | Possibly damaging | n/a | Seshagiri et al. [47] |
| A108V | Missense | 42,628,602 | 42,628,602 | G | SNP | Medium | deleterious | Probably damaging | n/a | Seshagiri et al. [47] |
| E96K | Missense | 42,628,639 | 42,628,639 | C | SNP | neutral | neutral | neutral | Male | Weinstein et al. [49] |
a:Colon Adenocarcinoma b: position; c: Predicts the functional impact of amino-acid substitutions in proteins, such as mutations discovered in cancer or missense polymorphisms, d: predicts whether an amino acid substitution affects protein function based on sequence homology and the physical properties of amino acids, e: (Polymorphism Phenotyping v2) is a tool which predicts possible impact of an amino acid substitution on the structure and function of a human protein using straightforward physical and comparative considerations
Lack of GUCA2A protein expression level in colorectal cancer tissues
We focused on the levels of GUCA2A protein and its effects on COAD utilizing HPA database. Based on the IHC data, GUCA2A Protein is expressed in normal colon cells with moderate cytoplasmic and membranous staining intensity in endocrine cells, low moderate staining intensity in enterocytes (less than 25%), and low moderate staining intensity in goblet cells (also less than 25%). In contrast, GUCA2A was not detected in tumor cells in any of the aforementioned cell types, indicating a lack of expression in the tumor microenvironment (Fig. 14).
Fig. 14.
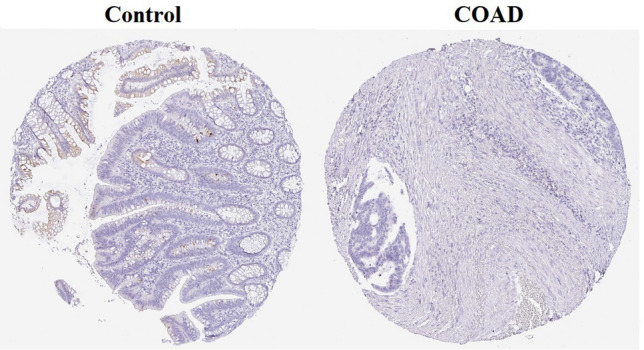
The immunohistochemical staining results from HPA. There was medium GUCA2A straining in endocrine cells and low straining in enterocytes and goblet cells in normal tissues. However, no GUCA2A straining was detected in colon cancer tissues
Gene drug interaction
According to the results obtained from DGIdb, Lactose anhydrous[50], Atropin[51], and Volanesorsen sodium [52] were identified as a drug that has interactions with GUCA2A (Table 3).
Table 3.
Candidate drugs target GUCA2A
GUCA2A expression levels in colorectal cancer tissues have shown significant down-regulation compared to NATs
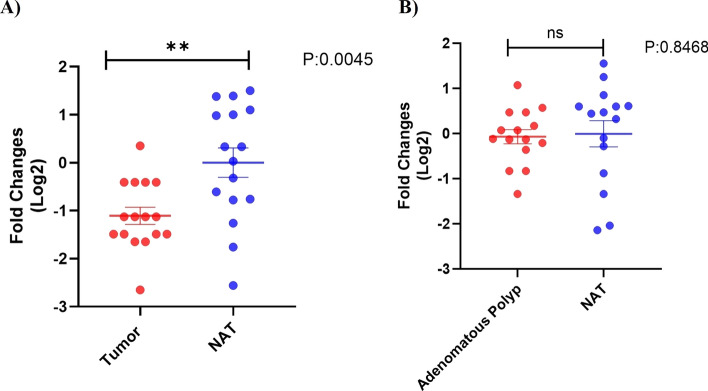
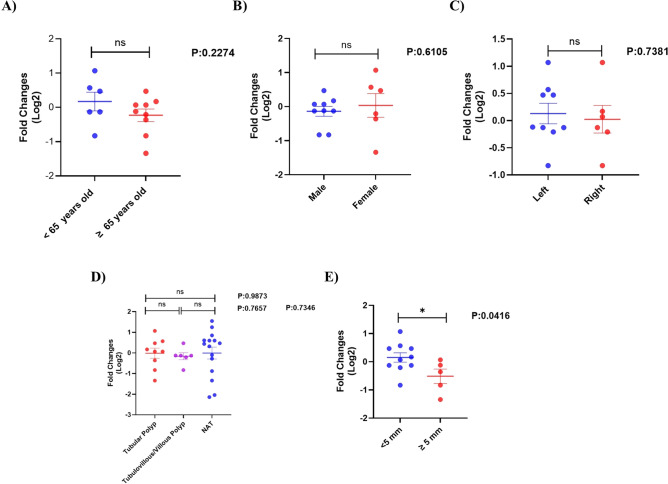
The clinicopathological characteristics of colorectal cancer patients and those with colorectal adenomatous polyps are presented in Table 4. We investigated the expression levels of the GUCA2A gene in cancerous tissues and colorectal adenomatous polyps in comparison to normal adjacent tissues (NATs). Our results indicate that GUCA2A expression is significantly down-regulated in colorectal cancer tissues compared to NATs (p value = 0.0045, Fig. 15a). In contrast, the expression level of GUCA2A in colorectal adenomatous polyps did not show a significant difference compared to NATs (p value = 0.8468, Fig. 15b).
Table 4.
Clinicopathological characteristics of colorectal adenomatous polyp and colorectal cancer patients
| Feature | Colorectal adenomatous polyps | Colorectal cancer | ||
|---|---|---|---|---|
| n (%) | P-value | n (%) | P-value | |
| Tissue Adenomatous polyp /Tumor NAT | 15 15 | 0.8468 | 16 16 | 0.0045 |
| Age < 65 / < 60 ≥ 65 ≥ 60 | 6 (40%) 9 (60%) | 0.2274 | (43.7%) 9 (56.2%) | 0.3829 |
| Sex Male Female | 9 (60%) 6 (40%) | 0.6105 | 9 (56.2%) 7 (43.7%) | 0.1680 |
| Location Left side Right side | 9 (60%) 6 (40%) | 0.7381 | 8 (50%) 8 (50%) | 0.8141 |
| Size 5 mm ≥ 5 mm | 10 (66.6%) 5 (33.3%) | 0.0416 | – | |
| Type of polyp Tubular Tubulovillus /Villous | 9 (60%) 6 (40%) | 0.7657 | – | |
Fig. 15.
The scatter diagram shows the expression levels of GUCA2A gene in colorectal cancer tissues and colorectal adenomatous polyps compared to their normal adjacent tissues (NATs). (A) The average level of GUCA2A expression in colorectal cancer tissues showed a significant decrease compared to NATs. B GUCA2A expression levels in colorectal adenomatous polyps were not significantly different from NATs. **: p value < 0.01, ns: non- significant
The expression of GUCA2A in adenomatous polyps equal to or larger than 5 mm has shown a significant decrease compared to polyps smaller than 5 mm
The expression of the GUCA2A gene was analyzed in relation to various demographic and tumor characteristics of colorectal cancer patients, specifically age (younger than 60 years and 60 years or older), sex (male and female), and tumor location (left side and right side). None of these characteristics showed statistically significant differences (Fig. 16a–c). Similarly, the GUCA2A gene expression in colorectal adenomatous polyps was evaluated based on age ((< 65 and ≥ 65), sex (male and female), polyp location (left side and right side), and type of polyps (tubular and tubulovillus/villous). No statistically significant differences were found in these analyses (Fig. 17a–d). Importantly, the expression of the GUCA2A gene in adenomatous polyps was also assessed based on polyp size ((< 5 mm and ≥ 5 mm). Our findings indicate that GUCA2A expression was significantly decreased in polyps measuring 5 mm or larger compared to those smaller than 5 mm (Fig. 17e).
Fig. 16.
Comparison of GUCA2A expression levels in colorectal cancer tissues based on clinicopathological characteristics. Expression levels GUCA2A were compared based on (A) age, (B) sex, and (C) tumor location colorectal cancer patients. It was shown that there is no significant difference in the expression of GUCA2A based on the parameters of age, sex and tumor location. ns: non- significant
Fig. 17.
Comparison of GUCA2A expression levels in colorectal adenomatous polyps based on clinicopathological characteristics. Expression levels GUCA2A were compared based on (A) age, (B) sex (C) polyp location, (D) type of polyps and (E) polyp size in patients with colorectal adenomatous polyps. It was found that there is no significant difference in the expression of the GUCA2A gene based on the parameters of age, sex, location of the polyp and the type of polyp but the level of expression of GUCA2A in polyps equal to 5 mm and larger than 5 mm was significantly lower compared to smaller than 5 mm. *: p value < 0.05, ns: non- significant
GUCA2A expression can be used as a biomarker for CRC diagnosis
To investigate and analyze the diagnostic value of GUCA2A expression in colorectal cancer tissues and colorectal adenomatous polyps, we performed a Receiver Operating Characteristic (ROC) curve analysis for each group (Fig. 18a and b). Our results revealed that AUC for colorectal cancer tissues was 77%, which is statistically significant (p value: 0.0083). The analysis indicated a sensitivity of 68.75% and a specificity of 81.25%. In contrast, the ROC curve analysis for colorectal adenomatous polyps showed an AUC of 59%, with a sensitivity of 73.33% and a specificity of 60%. However, this finding was not statistically significant (p value = 0.3837).
Fig. 18.
Investigating the biomarker property and diagnostic value of GUCA2A expression in colorectal cancer tissues, and colorectal adenomatous polyps using ROC curve analysis and based on the area under the curve (AUC). A AUC for GUCA2A expression levels in colon cancer tissues was 77% which is statistically significant. (B) GUCA2A expression levels in colon adenomatous polyps with AUC of 59% were not statistically significant
Discussion
Colorectal cancer (CRC) stands as a significant global health burden, ranking third among the leading causes of cancer-related mortality for both males and females. In 2020 alone, an estimated 515,637 deaths occurred among males, while females accounted for 419,536 deaths [53]. The overall survival (OS) rates for patients diagnosed with metastatic colorectal cancer indicate a challenging scenario, with approximately 70–75% surviving beyond one year, 30–35% surviving beyond three years, and less than 20% surviving beyond five years post-diagnosis [54]. Early diagnosis of colorectal cancer is vital because it opens up a wider array of treatment options and greatly influences patient survival rates [55]. The primary treatment approach for unresectable metastatic colorectal adenocarcinoma (COAD) involves systemic therapy, encompassing cytotoxic chemotherapy, biological therapies targeting cell growth factors, immunotherapy, and their combinations. Notably, recent clinical trials have demonstrated improved OS by tailoring treatments to the molecular and pathological features of individual tumors, underscoring the importance of analyzing genomic, transcriptomic, and proteomic profiles to identify effective treatments for specific somatic types [56–58].
Here, we employed an integrative analysis approach to identify COAD-specific differentially expressed genes by analyzing common DEGs from the GEO and GEPIA2 datasets within a pan-cancer model. Our investigation highlighted GUCA2A as a significantly differentiated gene specific to COAD. Through an examination of TCGA-COAD data, we observed downregulation of GUCA2A mRNA levels in COAD tissues compared to adjacent normal tissues and normal colon samples. Notably, our predictive analysis revealed a strong association between lower GUCA2A expression levels and shorter OS in COAD patients, indicating the potential prognostic value of GUCA2A in COAD. Additionally, the ROC curve analysis demonstrated the robust diagnostic performance of GUCA2A expression in differentiating COAD tissue from normal tissue, with 98% sensitivity, 95% specificity, and an impressive 99.6% AUC using TCGA-COAD data and 81.25% sensitivity, 68.75% specificity, and 0.77% AUC in CRC tissues, further supporting its potential as a robust diagnostic marker for COAD. These findings align with the study by Zhang et al.[54], which reported a significantly shorter OS in COAD patients with lower GUCA2A expression levels compared to those with higher expression levels. Furthermore, Liu et al. [59] employed Cox regression analysis to identify genes associated with colorectal cancer prognosis and constructed a 3-gene signature, including CLCA1-CLCA4-GUCA2A, which exhibited predictive power for prognosis in colorectal cancer. In this study, GUCA2A was significantly downregulated in adenoma polyps larger or equal to 5mm compared to smaller than 5mm which indicates its potential to predict adenocarcinoma in these polyps. In addition, later research identified areas of adenocarcinoma within adenomatous polyps, known as "adenomas," indicating that these polyps could potentially evolve into cancers [60]. A longitudinal study on patients who refused surgical removal of colonic polyps larger than 1 cm reported that there was a 24% chance of developing invasive adenocarcinoma at the original polyp site and a 35% chance of carcinoma occurring at any location within the colon over a period of 20 years [61].
To gain insights into the genomic alterations associated with GUCA2A in COAD, we conducted further investigations. Our analysis revealed the occurrence of five GUCA2A missense mutations in COAD, with P75S, A98T, A108V, and G114R classified as deleterious mutations, while A98T, A108V, and G114R were classified as probably damaging mutations. Additionally, the analysis of GUCA2A methylation data revealed differential methylation patterns in COAD compared to healthy individuals, with one probe exhibiting significant differential methylation. In line with the expression profile, we observed a significant downregulation of GUCA2A promoter methylation in COAD, indicating the potential involvement of mutations and methylation in GUCA2A in altering the expression of GUCA2A protein and contributing to CRC pathogenesis.
The co-expression analysis conducted in our study revealed a strong positive correlation between GUCA2A and GUCA2B. These two genes encode peptide hormones that function as endogenous ligands for the guanylate cyclase-C (GUCY2C) receptor [62]. Specifically, GUCA2A and GUCA2B encode guanylin (GU) and uroguanylin (UG), respectively, while GUCY2C encodes guanylyl cyclase C (GC-C). The activation of GC-C occurs through GN and UG, which share structural and functional similarities. The GN and UG peptides play a crucial role in the transduction signaling that regulates homeostasis, as well as the transport and secretion of fluids and electrolytes in the gastrointestinal tract during the process of digestion [52, 63].
Previous studies have highlighted the significance of GUCY2C signaling in the mediation of mucosal wounding and inflammation by controlling the production of resistin-like molecule β [64]. Downregulation of GUCA2A, GUCA2B, and GUCY2C has been observed in inflammatory bowel disease, suggesting their potential involvement in the pathogenesis of this condition [65]. Furthermore, recent research has demonstrated that GUCY2C can exert inhibitory effects on tumor progression in the intestine, and the loss of GUCY2C signaling cascade increases susceptibility to colorectal cancer (CRC) [66, 67]. The disruption of intestinal homeostasis and the development of CRC are often associated with the loss of GUCA2A and GUCA2B [68–70]. Bashir et al. presented evidence suggesting that the loss of GUCA2A could lead to the silencing of GUCY2C, thereby contributing to the development of microsatellite instability tumors [71]. These findings collectively indicate the potential involvement of GUCA2A, GUCA2B, and GUCY2C in crucial biological processes, including gastrointestinal fluid regulation, inflammation mediation, and CRC development. Further investigation into the precise mechanisms underlying the interplay between these genes and their roles in intestinal homeostasis and tumorigenesis is warranted. Understanding these processes at a molecular level could potentially lead to the development of novel therapeutic strategies and interventions targeting GUCY2C signaling for the management and prevention of CRC.
Moreover, we performed an intersectional analysis to identify genes and proteins that share a similar expression pattern with GUCA2A. Through this analysis, we constructed a GUCA2A protein–protein interaction (PPI) network consisting of 11 proteins. Among the identified common genes, TMIGD1, SLC26A3, NHERF4, and GUCA2B stood out for their potential significance in colorectal cancer (CRC). TMIGD1 has been implicated as a tumor suppressor gene that plays a crucial role in the intestinal epithelium. De La Cena et al. reported that the loss of TMIGD1 leads to adverse effects on the brush border membrane, junctional polarity, and maturation of the intestinal epithelium [72]. Their study demonstrated that TMIGD1 acts as a tumor suppressor by inhibiting tumor cell proliferation and migration, and by arresting the cell cycle at the G2/M phase. Moreover, TMIGD1 was found to induce the expression of key cell cycle inhibitor proteins, p21CIP1 and p27KIP1, which are responsible for regulating cell cycle progression. Importantly, TMIGD1 expression was progressively downregulated in sporadic human CRC, and its downregulation correlated with poor overall survival. These findings suggest that TMIGD1 could serve as a potential therapeutic target and a novel tumor suppressor gene, shedding light on the pathogenesis of CRC [72]. Similarly, another study by Mu et al. identified TMIGD1 as one of the highly downregulated genes in CRC, indicating its potential role in promoting CRC progression and invasion [73]. SLC26A3 is a transporter protein involved in the exchange of chloride and bicarbonate ions in intestinal cells, predominantly expressed in the apical domain of various intestinal segments. Studies have consistently reported a significant decrease in SLC26A3 expression levels in patients with CRC, suggesting its potential involvement in CRC progression. However, some studies propose that SLC26A3 is primarily expressed in differentiated colon cells rather than proliferating cells, potentially serving as a marker for differentiation [74, 75]. NHERF4 is a regulatory protein that interacts with GUCY2C and negatively modulates its activation induced by heat-stable enterotoxin [76]. Additionally, NHERF4 stimulates the activity of SLC9A3 in the presence of high calcium ions [77]. NHERF1, a closely related member of the NHERF family, has been identified as a key regulator of CRC progression through its interaction with the VEGFR2 pathway. High expression of NHERF1 has been associated with CRC progression, metastasis, and significantly worse overall survival, recurrence-free survival, and disease-specific survival. Knockdown of NHERF1 has been shown to increase apoptosis and reduce the expression of XIAP/survivin, underscoring the critical role of NHERF1 in CRC cell survival [78, 79]. The identification of TMIGD1, SLC26A3, and NHERF4 in our GUCA2A PPI network suggests their potential involvement in CRC pathogenesis.
Recent studies have emphasized the crucial role of different classes of non-coding RNAs, including mRNAs, miRNAs, and lncRNAs, in various biological processes and their associations with human diseases [80, 81]. Computational models have been developed to predict potential associations between miRNAs/lncRNAs and human diseases, providing valuable tools for disease-association prediction [82–85]. In 2011, the concept of competitive endogenous RNA (ceRNA) was introduced, which involves non-coding RNAs, such as lncRNAs or circRNAs, acting as competitive binding partners for miRNAs, thereby reducing the repression of target mRNAs by miRNAs [86]. In our study, we focused on investigating the involvement of miRNAs and circRNAs in the regulatory network of GUCA2A, aiming to identify more effective biomarkers and gain insights into the pathogenesis of colorectal adenocarcinoma (COAD) at different molecular levels. We constructed a comprehensive ceRNA network comprising 8 miRNAs that target GUCA2A and 183 circRNAs acting as miRNA sponges. Among the identified miRNAs, hsa-miR-1207-5p has been reported to promote the proliferation of breast cancer cells by directly regulating STAT6 [87]. Moreover, studies have demonstrated a significant decrease in circulating miR-1207-5p levels, which is associated with poor prognosis and serves as a highly diagnostic marker in colorectal cancer (CRC) [88]. Additionally, Ng et al. found a correlation between high tumor levels of miR-187-3p and poor prognosis in colorectal cancer [89].
We further aimed to explore the relationship between GUCA2A expression and the immune properties of the tumor microenvironment in colorectal adenocarcinoma. Our findings revealed significant correlations between GUCA2A expression and various immune cell populations within the tumor microenvironment. We observed significant correlations between GUCA2A expression and the abundance of several immune cell subsets, including CD4 + T cells, central memory CD4 + T cells, effector memory CD4 + T cells, type 17 T helper cells, type 2 T helper cells, activated B cells, natural killer (NK) cells, natural killer T cells, eosinophils, mast cells, monocytes, and neutrophils. These correlations highlight the potential involvement of GUCA2A in modulating the immune response in COAD. Previous studies have indicated the significance of T helper 17 cells in the progression of colorectal cancer [90]. The presence of these cells within the tumor microenvironment has been associated with disease progression. Furthermore, infiltration of B cells, NK cells, and macrophages has been linked to a favorable prognosis in colorectal cancer [91–94]. The significant correlations observed between T and B cells, as well as activated NK cells, and GUCA2A expression suggest that these immune cell populations may contribute to the impact of GUCA2A on the survival of COAD patients. Our findings suggest that GUCA2A may interact with immune cells and influence the immune landscape within the COAD tumor microenvironment. Further investigations are warranted to elucidate the underlying mechanisms by which GUCA2A influences immune cell populations and its potential implications for the prognosis and treatment of COAD. Understanding the intricate interplay between GUCA2A expression and immune cell populations will provide valuable insights into the immune-mediated mechanisms driving COAD progression. This knowledge could potentially contribute to the development of immunotherapeutic strategies targeting GUCA2A and its associated immune pathways in the treatment of COAD patients.
We also conducted a gene-drug analysis to identify drugs that interact with GUCA2A, and we identified three drugs: lactose anhydrous, atropine, and volanesorsen sodium. The associations between these drugs and GUCA2A provide insights into potential therapeutic strategies and shed light on the underlying molecular mechanisms in colorectal cancer. Lactose intolerance has been found to have a significant relationship with sporadic CRC, suggesting that lactose intolerance may act as a risk factor for CRC development [95]. Interestingly, lactose consumption has been shown to lower the risk of CRC by activating the guanylate signaling pathway. The interaction between lactose anhydrous and GUCA2A highlights the potential role of this drug in modulating GUCA2A-mediated signaling pathways and its implications in CRC prevention. Another chemotherapy drug commonly used in colorectal cancer treatment is irinotecan. It has been observed that irinotecan can induce diarrhea as a side effect. Atropine, an anticholinergic agent, is used to prevent the development of irinotecan-induced diarrhea [96]. The interaction between atropine and GUCA2A suggests a potential mechanism through which atropine may modulate GUCA2A-associated pathways to alleviate diarrhea in patients receiving irinotecan-based chemotherapy. Further, Volanesorsen sodium is a drug used in the treatment of familial chylomicronemia syndrome or hypertriglyceridemia [97]. This drug targets apolipoprotein C3 (apoC3) to increase the clearance of chylomicrons and other triglyceride-rich lipoproteins, leading to a significant reduction in triglyceride (TG) levels by 70–80%. Elevated TG levels have been associated with an increased risk of pancreatitis, and there is also a significant relationship between hypertriglyceridemia and CRC [98]. The interaction between Volanesorsen sodium and GUCA2A suggests a potential link between GUCA2A and TG metabolism pathways, highlighting the importance of GUCA2A in modulating lipid-related pathways that may impact CRC risk. Additionally, our GUCA2A KEGG pathway analysis identified pancreatic secretion as a significant pathway associated with GUCA2A. The downregulation of GUCA2A expression may contribute to an elevation in TG levels, potentially increasing the risk of CRC. These findings provide valuable insights into the molecular pathways influenced by GUCA2A and its potential role in CRC development. The identification of drugs that interact with GUCA2A and the exploration of associated pathways provide a foundation for further research and potential therapeutic interventions. Understanding the mechanisms underlying the interactions between GUCA2A and these drugs may lead to the development of novel treatment approaches targeting GUCA2A-mediated pathways in CRC. Further investigations are warranted to validate these findings and explore the clinical implications of targeting GUCA2A and its associated pathways in the prevention and treatment of CRC. The identification of GUCA2A as a potential therapeutic target opens up new possibilities for precision medicine strategies in CRC management.
Limitations
While this study contributes to the understanding of GUCA2A in COAD, it is important to acknowledge the limitations. Firstly, the microarray data obtained from the GEO database and the TCGA-RNASeq data were acquired from the GEPIA2 database. Utilizing data from different laboratories with diverse platforms may introduce systematic biases and variations in the results. Although efforts were made to minimize these biases through data processing and normalization, it is important to consider these potential limitations when interpreting the findings. Secondly, no anti-GUCA2A therapeutic monoclonal antibodies have been evaluated in clinical trials to date. Therefore, there is a lack of specific data available to assess the potential benefits of anti-GUCA2A targeting drugs in terms of the survival of COAD patients or inhibition of tumor growth. Future investigations should focus on exploring the feasibility and efficacy of anti-GUCA2A therapies, including the development and evaluation of novel anti-tumor immunotherapy drugs that specifically target GUCA2A. This would provide valuable insights into the clinical applicability of GUCA2A as a therapeutic target in COAD. In the future, a prospective study examining GUCA2A expression and its impact on immune infiltration in COAD patients is needed. By integrating comprehensive analyses of GUCA2A expression and immune cell infiltration, a deeper understanding of the interplay between GUCA2A and the tumor microenvironment can be obtained. Furthermore, testing newly developed anti-tumor immunotherapy drugs that target GUCA2A would provide valuable data on their efficacy, safety, and potential synergistic effects with existing treatment modalities. Addressing these limitations through further experimental studies, clinical trials, and prospective investigations will enhance our understanding of GUCA2A's functional role, clinical significance, and therapeutic potential in COAD management.
Conclusions
In conclusion, this study sheds light on the potential the significance of GUCA2A as a valuable prognostic and diagnostic biomarker in colon adenocarcinoma (COAD). As a COAD-specific gene, GUCA2A exhibited significant downregulation and hypomethylation, along with the five missense mutations in COAD patients. The significant downregulation of GUCA2A in cancerous colon tissues compared to normal colon tissues, as well as in adenomatous polyps ≥ 5 mm compared to those < 5 mm, indicates its potential as a predictive biomarker for the development of colorectal polyps into cancerous tissues. Moreover, significant correlations were revealed between GUCA2A and immune-related signatures in this gastrointestinal cancer type. As co-expressed genes with similar expression patterns, GUCA2A TMIGD1, SLC26A3, PDZD3 (NHERF4), and GUCA2B could be considered as significant gene signature in COAD. These findings further emphasize the importance of investigating the collective role of these genes in COAD pathogenesis. Additionally, the analysis of drug-gene interactions indicated a potential beneficial effect of lactose anhydrase and volanesorsen in CRC risk reduction through the regulation of GUCA2A expression. These findings provide insights into potential therapeutic avenues for COAD management. However, to fully elucidate the underlying mechanisms and functional roles of GUCA2A in COAD, further in vivo and in vitro studies are warranted. These investigations will contribute to a deeper understanding of GUCA2A's involvement in COAD progression and facilitate the development of targeted therapeutic strategies.
Decelerations
Supplementary Information
Below is the link to the electronic supplementary material.
Acknowledgements
We The authors would like to thank the Research Institute for Oncology, Hematology and Cell Therapy, Tehran University of Medical Sciences and Research Institute for Gastroenterology and Liver Diseases of the Shahid Beheshti University of Medical Sciences (RCGLD) for their support of this study.
Abbreviations
- Act-B cell
Activated B cell
- AUC
Area under the ROC curve
- BMI
Body mass index
- BP
Biological process
- CC
Cellular component
- Ce-RNA
Competing endogenous RNA
- COAD
Colon adenocarcinoma
- CRC
Colorectal cancer
- DEG
Differentially expressed genes
- FC
Fold Change
- GO
Gene ontology
- GTEx
Genotype-tissue expression
- GUCA2A
Guanylate cyclase activator 2A
- HPA
Human protein atlas
- IHC
Immunohistochemistry
- KEGG
Kyoto encyclopedia of genes and genomes
- MF
Molecular function
- NGS
Next-generation sequencing
- NK
Natural killer cells
- OS
Overall survival
- PPI
Protein–protein interaction
- RMA
Robust multi-array average
- RT-qPCR
Reverse transcription polymerase chain reaction
- TCGA
The cancer genome atlas
- Tcm_CD4
Central memory CD4 + T cell
- Tem-CD4
Effector memory CD4 + T cell
- Th2
Type 2 T helper cell
- Th17
Type 17 T helper cell
- TIME
Tumor immune microenvironment
Author contributions
Conceptualization: PJ, SHA, and ZS; In Silico Data Collection and Analysis: PJ, SHA, KK and Z.S.; Experimental Design, Data Screening and Data Collection: ME, MSN, and ENM; Writing—Original Draft Preparation: PJ, SHA, ME, and ST; Writing—Review & Editing: ZS, KK, and ENM. Supervision: ZS. All Authors Approved the Final Version to be published; They All Agreed to be Accountable for All Aspects of the Work.
Funding
This research did not make use of any external fund.
Data availability
The datasets presented in this study can be found in online repositories. The names of the repository/repositories and accession number(s) can be found in the article/Supplementary Material. The experimental data is available upon request from the corresponding authors.
Declarations
Competing interest
The authors declare that they have no conflicts of interest in the authorship or publication of this contribution.
The authors declare no competing interests.
Ethics approval and consent to participate
The ethical committee of the Institute of Gastroenterology and Liver Diseases, Shahid Beheshti University of Medical Sciences, approved the study (IR. SBMU.RIGLD.REC.1399.036), and written informed consent was obtained from all participants before entering the study.
Footnotes
Publisher's Note
Springer Nature remains neutral with regard to jurisdictional claims in published maps and institutional affiliations.
Pooya Jalali and Shahram Aliyari have equally contributed to this work.
Contributor Information
Ehsan Nazemalhosseini Mojarad, Email: ehsanmojarad@gmail.com.
Zahra Salehi, Email: zahra.salehi6463@yahoo.com, Email: zsalehi@sina.tums.ac.ir.
References
- 1.Organization, W.H., World health statistics 2018: monitoring health for the SDGs, sustainable development goals. 2018: World Health Organization.
- 2.Bray F, et al. Global cancer statistics 2018: GLOBOCAN estimates of incidence and mortality worldwide for 36 cancers in 185 countries. CA Cancer J Clin. 2018;68(6):394–424. [DOI] [PubMed] [Google Scholar]
- 3.Siegel RL, et al. Colorectal cancer statistics, 2020. CA Cancer J Clin. 2020;70(3):145–64. [DOI] [PubMed] [Google Scholar]
- 4.Vogelstein B, Kinzler KW. Cancer genes and the pathways they control. Nat Med. 2004;10(8):789–99. [DOI] [PubMed] [Google Scholar]
- 5.Wang X, et al. Development and validation of a DNA repair gene signature for prognosis prediction in colon cancer. J Cancer. 2020;11(20):5918. [DOI] [PMC free article] [PubMed] [Google Scholar]
- 6.Chen J, et al. ZMYND8 expression combined with pN and pM classification as a novel prognostic prediction model for colorectal cancer: based on TCGA and GEO database analysis. Cancer Biomark. 2020;28(2):201–11. [DOI] [PMC free article] [PubMed] [Google Scholar]
- 7.Zou J, et al. Mining the potential prognostic value of synaptosomal-associated protein 25 (SNAP25) in colon cancer based on stromal-immune score. PeerJ. 2020;8: e10142. [DOI] [PMC free article] [PubMed] [Google Scholar]
- 8.Zheng W, et al. Transcriptional information underlying the generation of CSCs and the construction of a nine-mRNA signature to improve prognosis prediction in colorectal cancer. Cancer Biol Ther. 2020;21(8):688–97. [DOI] [PMC free article] [PubMed] [Google Scholar]
- 9.Zhang R, et al. Mining featured biomarkers associated with vascular invasion in HCC by bioinformatics analysis with TCGA RNA sequencing data. Biomed Pharmacother. 2019;118: 109274. [DOI] [PubMed] [Google Scholar]
- 10.Al-Sheikh YA, et al. Screening for differentially-expressed microRNA biomarkers in Saudi colorectal cancer patients by small RNA deep sequencing. Int J Mol Med. 2019;44(6):2027–36. [DOI] [PMC free article] [PubMed] [Google Scholar]
- 11.Yamada A, et al. A RNA-Sequencing approach for the identification of novel long non-coding RNA biomarkers in colorectal cancer. Sci Rep. 2018;8(1):575. [DOI] [PMC free article] [PubMed] [Google Scholar]
- 12.O’Connell MJ, et al. Relationship between tumor gene expression and recurrence in four independent studies of patients with stage II/III colon cancer treated with surgery alone or surgery plus adjuvant fluorouracil plus leucovorin. J Clin Oncol. 2010;28(25):3937. [DOI] [PMC free article] [PubMed] [Google Scholar]
- 13.Barrier A, et al. Stage II colon cancer prognosis prediction by tumor gene expression profiling. J Clin Oncol. 2006;24(29):4685–91. [DOI] [PubMed] [Google Scholar]
- 14.Liu X, et al. Identification of crucial genes and pathways associated with colorectal cancer by bioinformatics analysis. Oncol Lett. 2020;19(3):1881–9. [DOI] [PMC free article] [PubMed] [Google Scholar]
- 15.Shangguan H, Tan S, Zhang J. Bioinformatics analysis of gene expression profiles in hepatocellular carcinoma. Eur Rev Med Pharmacol Sci. 2015;19(11):2054–61. [PubMed] [Google Scholar]
- 16.Kosti A, et al. Microarray profile of human kidney from diabetes, renal cell carcinoma and renal cell carcinoma with diabetes. Genes Cancer. 2015;6(1–2):62. [DOI] [PMC free article] [PubMed] [Google Scholar]
- 17.Christgen M, et al. IPH-926 lobular breast cancer cells are triple-negative but their microarray profile uncovers a luminal subtype. Cancer Sci. 2013;104(12):1726–30. [DOI] [PMC free article] [PubMed] [Google Scholar]
- 18.Hu Y, et al. Colorectal cancer susceptibility loci as predictive markers of rectal cancer prognosis after surgery. Genes Chromosom Cancer. 2018;57(3):140–9. [DOI] [PMC free article] [PubMed] [Google Scholar]
- 19.Kagawa Y, et al. Cell cycle-dependent Rho GTPase activity dynamically regulates cancer cell motility and invasion in vivo. PLoS ONE. 2013;8(12): e83629. [DOI] [PMC free article] [PubMed] [Google Scholar]
- 20.Sveen A, et al. Transcriptome instability in colorectal cancer identified by exon microarray analyses: associations with splicing factor expression levels and patient survival. Genome medicine. 2011;3:1–13. [DOI] [PMC free article] [PubMed] [Google Scholar]
- 21.Ågesen TH, et al. ColoGuideEx: a robust gene classifier specific for stage II colorectal cancer prognosis. Gut. 2012;61(11):1560–7. [DOI] [PubMed] [Google Scholar]
- 22.Bian Q, et al. Four targeted genes for predicting the prognosis of colorectal cancer: a bioinformatics analysis case. Oncol Lett. 2019;18(5):5043–54. [DOI] [PMC free article] [PubMed] [Google Scholar]
- 23.Ji F, Sadreyev RI. RNA-seq: basic bioinformatics analysis. Curr Protoc Mol Biol. 2018;124(1): e68. [DOI] [PMC free article] [PubMed] [Google Scholar]
- 24.Barrett T, et al. NCBI GEO: archive for functional genomics data sets—update. Nucleic Acids Res. 2012;41(D1):D991–5. [DOI] [PMC free article] [PubMed] [Google Scholar]
- 25.Irizarry RA, et al. Exploration, normalization, and summaries of high density oligonucleotide array probe level data. Biostatistics. 2003;4(2):249–64. [DOI] [PubMed] [Google Scholar]
- 26.Ritchie ME, et al. limma powers differential expression analyses for RNA-sequencing and microarray studies. Nucleic Acids Res. 2015;43(7):e47–e47. [DOI] [PMC free article] [PubMed] [Google Scholar]
- 27.Tang Z, et al. GEPIA2: an enhanced web server for large-scale expression profiling and interactive analysis. Nucleic Acids Res. 2019;47(W1):W556–60. [DOI] [PMC free article] [PubMed] [Google Scholar]
- 28.Tang G, Cho M, Wang X. OncoDB: an interactive online database for analysis of gene expression and viral infection in cancer. Nucleic Acids Res. 2022;50(D1):D1334–9. [DOI] [PMC free article] [PubMed] [Google Scholar]
- 29.Chandrashekar DS, et al. UALCAN: an update to the integrated cancer data analysis platform. Neoplasia. 2022;25:18–27. [DOI] [PMC free article] [PubMed] [Google Scholar]
- 30.Vasaikar SV, et al. LinkedOmics: analyzing multi-omics data within and across 32 cancer types. Nucleic Acids Res. 2018;46(D1):D956–63. [DOI] [PMC free article] [PubMed] [Google Scholar]
- 31.Kuleshov MV, et al. Enrichr: a comprehensive gene set enrichment analysis web server 2016 update. Nucleic Acids Res. 2016;44(W1):W90–7. [DOI] [PMC free article] [PubMed] [Google Scholar]
- 32.Chen Y, Wang X. miRDB: an online database for prediction of functional microRNA targets. Nucleic Acids Res. 2020;48(D1):D127–31. [DOI] [PMC free article] [PubMed] [Google Scholar]
- 33.Dweep H, Gretz N, Sticht C. miRWalk database for miRNA–target interactions. RNA Mapp Method Protoc. 2014. 10.1007/978-1-4939-1062-5_25. [DOI] [PubMed] [Google Scholar]
- 34.Agarwal V, et al., Predicting effective microRNA target sites in mammalian mRNAs. elife, 2015. 4 e05005. [DOI] [PMC free article] [PubMed]
- 35.Huang H-Y, et al. miRTarBase update 2022: an informative resource for experimentally validated miRNA–target interactions. Nucleic Acids Res. 2022;50(D1):D222–30. [DOI] [PMC free article] [PubMed] [Google Scholar]
- 36.Liu M, et al. Circbank: a comprehensive database for circRNA with standard nomenclature. RNA Biol. 2019;16(7):899–905. [DOI] [PMC free article] [PubMed] [Google Scholar]
- 37.Shannon P, et al. Cytoscape: a software environment for integrated models of biomolecular interaction networks. Genome Res. 2003;13(11):2498–504. [DOI] [PMC free article] [PubMed] [Google Scholar]
- 38.Cerami E, et al. The cBio cancer genomics portal: an open platform for exploring multidimensional cancer genomics data. Cancer Discov. 2012;2(5):401–4. [DOI] [PMC free article] [PubMed] [Google Scholar]
- 39.Thul PJ, Lindskog C. The human protein atlas: a spatial map of the human proteome. Protein Sci. 2018;27(1):233–44. [DOI] [PMC free article] [PubMed] [Google Scholar]
- 40.Ru B, et al. TISIDB: an integrated repository portal for tumor–immune system interactions. Bioinformatics. 2019;35(20):4200–2. [DOI] [PubMed] [Google Scholar]
- 41.Freshour SL, et al. Integration of the drug-gene interaction database (DGIdb 4.0) with open crowdsource efforts. Nucleic Acids Res. 2021;49(D1):D1144–51. [DOI] [PMC free article] [PubMed] [Google Scholar]
- 42.Abbott M, Ustoyev Y. Cancer and the immune system: the history and background of immunotherapy. In seminars in oncology nursing. Amsterdam: Elsevier; 2019. [DOI] [PubMed] [Google Scholar]
- 43.Roma-Rodrigues C, et al. Targeting tumor microenvironment for cancer therapy. Int J Mol Sci. 2019;20(4):840. [DOI] [PMC free article] [PubMed] [Google Scholar]
- 44.Xia J et al., Single‐cell landscape and clinical outcomes of infiltrating B cells in colorectal cancer. Immunology, 2023 [DOI] [PubMed]
- 45.Yang W, et al. Integrated analysis of necroptosis-related genes for evaluating immune infiltration and colon cancer prognosis. Front Immunol. 2022. 10.3389/fimmu.2022.1085038. [DOI] [PMC free article] [PubMed] [Google Scholar]
- 46.Giannakis M, et al. Genomic correlates of immune-cell infiltrates in colorectal carcinoma. Cell Rep. 2016;15(4):857–65. [DOI] [PMC free article] [PubMed] [Google Scholar]
- 47.Seshagiri S, et al. Recurrent R-spondin fusions in colon cancer. Nature. 2012;488(7413):660–4. [DOI] [PMC free article] [PubMed] [Google Scholar]
- 48.Weinstein JN, et al. The cancer genome atlas pan-cancer analysis project. Nat Genet. 2013;45(10):1113–20. [DOI] [PMC free article] [PubMed] [Google Scholar]
- 49.Network CGAR, Weinstein JN, Collisson EA, Mills GB, Shaw KRM, Ozenberger BA, Ellrott K, Shmulevich I, Sander C, Stuart JM. The cancer genome atlas pan-cancer analysis project. Nat Genet. 2013;45(10):1113–20. [DOI] [PMC free article] [PubMed] [Google Scholar]
- 50.Steinbrecher KA, et al. Increases in guanylin and uroguanylin in a mouse model of osmotic diarrhea are guanylate cyclase C—independent. Gastroenterology. 2001;121(5):1191–202. [DOI] [PubMed] [Google Scholar]
- 51.Furuya S, Naruse S, Hayakawa T. Intravenous injection of guanylin induces mucus secretion from goblet cells in rat duodenal crypts. Anat Embryol. 1998;197:359–67. [DOI] [PubMed] [Google Scholar]
- 52.Kita T, et al. Marked increase of guanylin secretion in response to salt loading in the rat small intestine. Am J Physiol Gastrointest Liver Physiol. 1999;277(5):960–6. 10.1152/ajpgi.1999.277.5.G960. [DOI] [PubMed] [Google Scholar]
- 53.Xi Y, Xu P. Global colorectal cancer burden in 2020 and projections to 2040. Trans Oncol. 2021;14(10): 101174. [DOI] [PMC free article] [PubMed] [Google Scholar]
- 54.Zhang H, et al. Integrated analysis of oncogenic networks in colorectal cancer identifies GUCA2A as a molecular marker. Biochem Res Int. 2019. 10.1155/2019/6469420. [DOI] [PMC free article] [PubMed] [Google Scholar]
- 55.Piroozkhah M, et al. Guanylate cyclase-C signaling axis as a theragnostic target in colorectal cancer: a systematic review of literature. Front Oncol. 2023;13:1277265. [DOI] [PMC free article] [PubMed] [Google Scholar]
- 56.Xie Y-H, Chen Y-X, Fang J-Y. Comprehensive review of targeted therapy for colorectal cancer. Signal Transduct Target Ther. 2020;5(1):22. [DOI] [PMC free article] [PubMed] [Google Scholar]
- 57.Biller LH, Schrag D. Diagnosis and treatment of metastatic colorectal cancer: a review. JAMA. 2021;325(7):669–85. [DOI] [PubMed] [Google Scholar]
- 58.Cardoso R, et al. Colorectal cancer incidence, mortality, and stage distribution in European countries in the colorectal cancer screening era: an international population-based study. Lancet Oncol. 2021;22(7):1002–13. [DOI] [PubMed] [Google Scholar]
- 59.Liu Y, et al. Identification of hub genes in colorectal adenocarcinoma by integrated bioinformatics. Front Cell Develop Biol. 2022. 10.3389/fcell.2022.897568. [DOI] [PMC free article] [PubMed] [Google Scholar]
- 60.Morson B. President’s address. The polyp-cancer sequence in the large bowel. Proc R Soc Med. 1974;67(61):451–7. [DOI] [PMC free article] [PubMed] [Google Scholar]
- 61.Stryker SJ, et al. Natural history of untreated colonic polyps. Gastroenterology. 1987;93(5):1009–13. [DOI] [PubMed] [Google Scholar]
- 62.Kuhn M. Molecular physiology of membrane guanylyl cyclase receptors. Physiol Rev. 2016;96(2):751–804. [DOI] [PubMed] [Google Scholar]
- 63.Camilleri M. Guanylate cyclase C agonists: emerging gastrointestinal therapies and actions. Gastroenterology. 2015;148(3):483–7. [DOI] [PubMed] [Google Scholar]
- 64.Steinbrecher KA, et al. Murine guanylate cyclase C regulates colonic injury and inflammation. J Immunol. 2011;186(12):7205–14. [DOI] [PMC free article] [PubMed] [Google Scholar]
- 65.Brenna Ø, et al. The guanylate cyclase-C signaling pathway is down-regulated in inflammatory bowel disease. Scand J Gastroenterol. 2015;50(10):1241–52. [DOI] [PMC free article] [PubMed] [Google Scholar]
- 66.Pattison AM, et al. Guanylyl cyclase C signaling axis and colon cancer prevention. World J Gastroenterol. 2016;22(36):8070. [DOI] [PMC free article] [PubMed] [Google Scholar]
- 67.Blomain ES, et al. Translating colorectal cancer prevention through the guanylyl cyclase C signaling axis. Expert Rev Clin Pharmacol. 2013;6(5):557–64. [DOI] [PMC free article] [PubMed] [Google Scholar]
- 68.Basu N, Arshad N, Visweswariah SS. Receptor guanylyl cyclase C (GC-C): regulation and signal transduction. Mol Cell Biochem. 2010;334:67–80. [DOI] [PubMed] [Google Scholar]
- 69.Li P, et al. Guanylyl cyclase C suppresses intestinal tumorigenesis by restricting proliferation and maintaining genomic integrity. Gastroenterology. 2007;133(2):599–607. [DOI] [PubMed] [Google Scholar]
- 70.Lin JE, et al. The hormone receptor GUCY2C suppresses intestinal tumor formation by inhibiting AKT signaling. Gastroenterology. 2010;138(1):241–54. [DOI] [PMC free article] [PubMed] [Google Scholar]
- 71.Bashir B, et al. Silencing the GUCA2A-GUCY2C tumor suppressor axis in CIN, serrated, and MSI colorectal neoplasia. Hum Pathol. 2019;87:103–14. [DOI] [PMC free article] [PubMed] [Google Scholar]
- 72.De La Cena KO, et al. Transmembrane and immunoglobulin domain containing 1, a putative tumor suppressor, induces G2/M cell cycle checkpoint arrest in colon cancer cells. Am J Pathol. 2021;191(1):157–67. [DOI] [PMC free article] [PubMed] [Google Scholar]
- 73.Mu L, et al. The role of TMIGD1 as a Tumor suppressor in colorectal cancer. Genet Test Mol Biomarkers. 2022;26(4):174–83. [DOI] [PubMed] [Google Scholar]
- 74.Ding X, et al. SLC26A3 (DRA) prevents TNF-alpha-induced barrier dysfunction and dextran sulfate sodium-induced acute colitis. Lab Invest. 2018;98(4):462–76. [DOI] [PubMed] [Google Scholar]
- 75.Zhang M, et al. Physiological and pathophysiological role of ion channels and transporters in the colorectum and colorectal cancer. J Cell Mol Med. 2020;24(17):9486–94. [DOI] [PMC free article] [PubMed] [Google Scholar]
- 76.Scott RO, Thelin WR, Milgram SL. A novel PDZ protein regulates the activity of guanylyl cyclase C, the heat-stable enterotoxin receptor. J Biol Chem. 2002;277(25):22934–41. [DOI] [PubMed] [Google Scholar]
- 77.Zachos NC, et al. Elevated intracellular calcium stimulates NHE3 activity by an IKEPP (NHERF4) dependent mechanism. Cell Physiol Biochem. 2008;22(5–6):693–704. [DOI] [PMC free article] [PubMed] [Google Scholar]
- 78.Gu Y, et al. NHERF1 regulates the progression of colorectal cancer through the interplay with VEGFR2 pathway. Oncotarget. 2017;8(5):7753. [DOI] [PMC free article] [PubMed] [Google Scholar]
- 79.Leiphrakpam PD, et al. Prognostic and therapeutic implications of NHERF1 expression and regulation in colorectal cancer. J Surg Oncol. 2020;121(3):547–60. [DOI] [PMC free article] [PubMed] [Google Scholar]
- 80.Chen X, et al. Long non-coding RNAs and complex diseases: from experimental results to computational models. Brief Bioinform. 2017;18(4):558–76. [DOI] [PMC free article] [PubMed] [Google Scholar]
- 81.Chen X, et al. MicroRNAs and complex diseases: from experimental results to computational models. Brief Bioinform. 2019;20(2):515–39. [DOI] [PubMed] [Google Scholar]
- 82.Chen X, et al. Predicting miRNA–disease association based on inductive matrix completion. Bioinformatics. 2018;34(24):4256–65. [DOI] [PubMed] [Google Scholar]
- 83.Chen X, et al. BNPMDA: bipartite network projection for MiRNA–disease association prediction. Bioinformatics. 2018;34(18):3178–86. [DOI] [PubMed] [Google Scholar]
- 84.Chen X, et al. MDHGI: matrix decomposition and heterogeneous graph inference for miRNA-disease association prediction. PLoS Comput Biol. 2018;14(8): e1006418. [DOI] [PMC free article] [PubMed] [Google Scholar]
- 85.Chen X, Huang L. LRSSLMDA: laplacian regularized sparse subspace learning for MiRNA-disease association prediction. PLoS Comput Biol. 2017;13(12): e1005912. [DOI] [PMC free article] [PubMed] [Google Scholar]
- 86.Salmena L, et al. A ceRNA hypothesis: the rosetta stone of a hidden RNA language? Cell. 2011;146(3):353–8. [DOI] [PMC free article] [PubMed] [Google Scholar]
- 87.Yan C, et al. PVT 1-derived miR-1207-5p promotes breast cancer cell growth by targeting STAT 6. Cancer Sci. 2017;108(5):868–76. [DOI] [PMC free article] [PubMed] [Google Scholar]
- 88.Wang X, et al. Plasma microRNA-1207–5p as a potential biomarker for diagnosis and prognosis of colorectal cancer. Clin Lab. 2020. 10.7754/Clin.Lab.2020.191269. [DOI] [PubMed] [Google Scholar]
- 89.Ng L, et al. High Levels of Tumor miR-187-3p—a potential tumor-suppressor microRNA—Are correlated with poor prognosis in colorectal cancer. Cells. 2022;11(15):2421. [DOI] [PMC free article] [PubMed] [Google Scholar]
- 90.Sun J, et al. Tumor exosome promotes Th17 cell differentiation by transmitting the lncRNA CRNDE-h in colorectal cancer. Cell Death Dis. 2021;12(1):123. [DOI] [PMC free article] [PubMed] [Google Scholar]
- 91.Hansen FJ, et al. Tumor infiltration with CD20+ CD73+ B cells correlates with better outcome in colorectal cancer. Int J Mol Sci. 2022;23(9):5163. [DOI] [PMC free article] [PubMed] [Google Scholar]
- 92.Nersesian S, et al. NK cell infiltration is associated with improved overall survival in solid cancers: a systematic review and meta-analysis. Trans Oncol. 2021;14(1): 100930. [DOI] [PMC free article] [PubMed] [Google Scholar]
- 93.Forssell J, et al. High macrophage infiltration along the tumor front correlates with improved survival in colon cancer. Clin Cancer Res. 2007;13(5):1472–9. [DOI] [PubMed] [Google Scholar]
- 94.Oosterling SJ, et al. Macrophages direct tumour histology and clinical outcome in a colon cancer model. J Pathol A J Pathol Soc Great Britain Ireland. 2005;207(2):147–55. [DOI] [PubMed] [Google Scholar]
- 95.Andrzej P, et al. Influence of lactose intolerance on colorectal cancer incidence in the Polish population. Hered Cancer Clin Pract. 2015. 10.1186/1897-4287-13-S1-A7. [Google Scholar]
- 96.Kurniali PC, Hrinczenko B, Al-Janadi A. Management of locally advanced and metastatic colon cancer in elderly patients. World J Gastroenterol: WJG. 2014;20(8):1910. [DOI] [PMC free article] [PubMed] [Google Scholar]
- 97.Esan O, Wierzbicki AS. Volanesorsen in the treatment of familial chylomicronemia syndrome or hypertriglyceridaemia: design, development and place in therapy. Drug Design Develop Ther. 2020;14:2623–36. [DOI] [PMC free article] [PubMed] [Google Scholar]
- 98.Hsu S-H, et al. The association between hypertriglyceridemia and colorectal cancer: a long-term community cohort study in Taiwan. Int J Environ Res Public Health. 2022;19(13):7804. [DOI] [PMC free article] [PubMed] [Google Scholar]
Associated Data
This section collects any data citations, data availability statements, or supplementary materials included in this article.
Supplementary Materials
Data Availability Statement
The datasets presented in this study can be found in online repositories. The names of the repository/repositories and accession number(s) can be found in the article/Supplementary Material. The experimental data is available upon request from the corresponding authors.


