

Abstract
Understanding the architecture of the human deep brain is especially challenging because of the complex organization of the nuclei and fascicles that support most sensorimotor and behaviour controls. There are scant dedicated tools to explore and analyse this region. Here we took a transdisciplinary approach to build a new deep-brain MRI architecture atlas drawing on advanced clinical experience of MRI-based deep brain mapping. This new tool comprises a young-male-adult MRI template spatially normalized to the ICBM152, containing T1, inversion-recovery, and diffusion MRI datasets (in vivo acquisition), and an MRI atlas of 118 labelled deep brain structures. It is open-source and gives users high resolution image datasets to describe nuclear-based and axonal architecture, combining pioneering and recent knowledge. It is a useful addition to current 3D atlases and clinical tools.
Subject terms: Brain, Neuroscience
Background & Summary
Deep brain (DB) is a catch-all term for subcortical structures of the diencephalon-mesencephalic region, and specifically the deep grey nuclei – basal ganglia, hypothalamus, thalamus, subthalamic area, and hippocampal complex, with their related white-matter (WM) components. Knowledge of DB architecture and function is of the utmost importance to understand major functions such as motricity, gnosia, and behaviour, and the pathophysiology of numerous neuropsychiatric disorders such as Parkinson’s disease, depression, Tourette syndrome, pain, and disorder of consciousness. It also has major therapeutic implications, notably for DB stimulation (DBS)1. However, the DB’s intricate organization is challenging for research and makes clinical progress slow (e.g. in functional connectomics)2. DB nuclei differ widely in size, shape, connectivity, and function, have an unsettled terminology, and are often barely visible by MRI and even on histological images. The internuclear connections of WM fibres are short and of complex shape with sharp turns, making their 3D mapping difficult even using diffusion tensor imaging with fibre tracking (DTI-FT).
Software packages and numerical atlases dedicated to DB study are scant. They derive from manual contouring such as AAL3, merged atlases such as the CIT 168 atlas4, the CONN atlas5 and the Brainnetome6, or complex merged methods such as the Multi-contrast PD25 atlas7 and PD1268. In functional neurosurgery, identifying DB structural architecture still relies on classical 2D stereotactic atlases9–11, extendable by automatic12 or manual13 segmentation of nuclei. The atlases depict the architecture to ranging degrees of precision, but without details on the organization of the neuron fibres (axons) running through the WM and grey matter (GM) territories. The axon organization (hereafter “fibre architecture”) extends the concept of myeloarchitecture used by Oskar Vogt that refers to layers of intracortical fibres14.
DTI-FT, which probes the fibre architecture of brain in vivo15, shows large fascicles and yields fine-scale information16. DTI-FT results depend notably on magnetic field, gradient strength, acquisition parameters such as the voxel size, and the diffusion experimental design (including gradient distribution and shells), and the fiber tracking used17–22. High magnetic field, which is ≤3 T in medical practice to limit induced nerve stimulations, enables to decrease the voxel size. The duration of acquisition can also be shortened, minimizing subject movements. The greater number of diffusion directions, easier to acquire with high field, yields finer information on water-proton motion. The models of diffusion and FT methods determine the final representation of fiber systems, the interpretation of which depends on knowledge of the underlying architecture. DTI-FT methods so far give a fair representation of the fibre architecture within a given voxel for quasi-parallel, homogeneous bundles of axons. Several diffusion models extract the underlying bundle architecture, insofar as it is known, such as diffusion tensor eigen vector15,23, and more sophisticated models derived from high angular resolution diffusion imaging (HARDI) acquisition, such as q-ball imaging – Funk-Radon transform24 and fibre orientation density function25. The principle of the representation of diffusion orientation by colour encoding, or Directionally encoded Color (DEC), most often uses an RGB colour scheme, transversal in red, longitudinal in green, and vertical in blue26. The DEC maps can be used to identify distinct fiber sets, such as the corticofugal pyramidal tract within the posterior limb of the internal capsule as indicated by the colour blue. The nuances of colours refine the visual analysis showing changes of orientation of fascicles, such as the temporo-pontine, or Türck, fascicle that becomes purple, when it inclines toward the pons. FT methods allow computed tracing of fibres that visualize the construct, enabling plausible biological interpretations of fascicles: (i) step-by-step methods such as streamline tractography27, (ii) probabilistic tractography28, (iii) global approaches, such as diffusion-optimization spherical deconvolution29 and HARDI-based annealing and probabilistic tractography30.
The specific features of the human DB fibre architecture probed by DTI-FT have elicited little interest (Table 1)31–41. These studies also have limitations: few labelled structures, lack of combined, colocalized information of DEC, DTI and nuclear labels, and no labelled open-access files. Even so, DTI of DB is proposed in medical practice, such as for targeting in functional neurosurgery42,43, for the study of pain44, for the prognosis of disorders of consciousness45, and for the segmentation of deep brain nuclei46–48. Thorough knowledge of DTI-based connectivity has become a prerequisite to decipher most neurological and neuropsychiatric diseases49,50.
Table 1.
DTI and fibre tracking studies, dedicated to or including human DB data; Directionally encoded Color, DEC; n.a., no available data; the persons who made drawings are specified, person or profession if known; the present study is added for quick comparison; open access files* (i.e. no programming and no authorization required).
| Studies | DTI | brain | deep brain | DEC maps | fascicle | open access files* | ||
|---|---|---|---|---|---|---|---|---|
| field (directions) | voxel (mm3): raw (reconstructed) | region (structures) | contouring | |||||
| Behrens et al.33 | 1.5-Tesla (54) | 2.3 × 2.3 × 2.3 (1.7 × 1.7 × 2.3) | 1 healthy subject (+8 healthy subjects) | thalamus (11) | manual drawing, histologic atlases; persons | no | yes | no |
| Nagae-Poetscher et al.34 | 3-Tesla (30) | 1.8 × 1.8 × 1.8 (0.8 × 0.8 × 0.8) | 3 healthy subjects | brainstem (7) | no drawing; indication by arrows; persons | yes | yes | no |
| Kollias et al.36 | 3-Tesla (15) | 1.33 × 1.33 × 2 (n.a.) | n.a. | brain stem and midbrain (35) | no drawing; indication by arrows; persons | yes | yes | no |
| Delman et al.35 | 9.4-Tesla (6) | 0.24 × 0.24 × 1 (n.a.) | 1 specimen (n.a.) | brain stem (n.a.) | yes | no | no | |
| Lemaire et al.37 | 3-Tesla (32) | 1.25 × 1.25 × 1.5 (0.94 × 0.94 × 1.5) | 6 healthy subjects | deep brain (11) | manual drawing; multiatlases; 1 neurosurgeon | yes | yes | no |
| Coenen et al.38 | 3-Tesla (17) | 1.5 × 1.5 × 3 (n.a.) | 55 healthy subjects | basal forebrain (0) | MNI coordinates | no | yes | no |
| Oishi et al.40 | 11.7-Tesla (10) | 0.25 × 0.2 × 0.12 (0.125 × 0.1 × 0.24) | 1 specimen | deep brain (36) | manual drawing, 3 histology atlases; 1 person | yes | yes | no |
| Chu et al., 2022 | 3-Tesla (64 & 128) | 2 × 2 × 2 (n.a.) | 380, 115 and 61 health children | full brain (0) | average DTI template | yes | no | no |
| Radwan et al., 2022 | 3-Tesla (90) | 1.25 × 1.25 × 1.25 (n.a.) | 20 healthy subjects | full brain (n.a.) | mixed, manual drawing and automatic parcellation (atlases, n.a.); imbricated methodologies; persons | no | yes | no |
| 3-Tesla (125 to 300) | 2.5 × 2.5 × 2.5 (n.a.) | 1 healthy subject | ||||||
| Pujol et al., 2017, 2022 | 3-Tesla (270) | 1.25 × 1.25 × 1.25 (n.a.) | 5 healthy subjects | STN related (4) | manual drawing and positioning of ROIs; histologic atlas; persons | no | yes | no |
| Wu et al., 2022 | 3-Tesla (30, 32, 40 & 48) | 2 × 2 × 2 (n.a.) | 2 datasets of 202 non-demented patients | full brain (0) | average DTI template | yes | no | yes |
| Schira et al.41 | 3-Tesla (32) | 1.25 × 1.25 × 1.25 (0.625 × 0.625 × 0.625) | 2 healthy subjects | full brain (n.a.) | manual drawing, histological atlas (n.a.); consensus between authors | yes | no | no |
| Present study | 3-Tesla (60) | 0.53 × 0.53 × 2 (1 × 1 × 1) | 1 healthy subject | deep brain (118) | MRI structural atlas (MDBA) | yes | yes | yes |
To improve knowledge of DB structural architecture, we took a cross-disciplinary approach to produce an open-access, high-resolution, 3D MRI multimodal template of the DB with an advanced MRI-based atlas of 118 labelled structures, usable by researchers and clinicians with standard computer facilities.
The template consisted of T1, inversion-recovery and DTI sequences of one healthy adult subject. The inversion-recovery sequence, known as white-matter attenuated inversion recovery (WAIR), dedicated to deep brain analysis, is used in routine clinical practice13,51,52. The template was normalized to the ICBM 152 asymmetric nonlinear average T2 template53 previously horizontalized to the bi-commissural plane through the anterior commissure (AC) and the posterior commissure (PC). We developed an extended version of a high-resolution MRI DB atlas with an advanced dictionary54, named eMDBA (extended MRI Deep Brain Atlas). Diffusion MRI datasets were spatially aligned to eMDBA with nonlinear diffeomorphic registration. We computed a whole brain tractogram based on the first eigen vector using a tensor line algorithm. The normalized template datasets with the eMDBA were brought together under the name DB-MA atlas (Deep Brain – MRI Architecture). The DB-MA atlas was validated using a slice-based approach, looking at large-scale and small-scale DB architecture. Thirteen distinct planes, crossing the DB were selected because they were available in the literature with an advanced labelling of structures. They enabled an extensive, methodical, and reproduceable, analysis along these reference planes. We exemplified the contribution of the DB-MA atlas, focusing on the thalamo-subthalamic region, looking at two mesoscopic architectures, nuclear-based according to DB nuclei, and connectivity-based or fibre architecture according to related FT traces. The relevance and accuracy of the DB-MA atlas were evaluated against a body of multidisciplinary scientific data combining pioneering and recent knowledge.
Methods
Healthy subject MRI data sets
One voluntary healthy subject, male, right-handed, 25 years old, gave his free consent to perform the experiment and share the data (ethical approval; CECIC Rhône-Alpes-Auvergne, Grenoble, IRB 5921). He was scanned without a contrast injection in four sessions lasting about 1 hour each (no sedation). These yielded a set of three sequences close to clinical protocols: (i) a white-matter attenuated inversion recovery (WAIR) sequence13, on a Siemens 1.5 T machine (Avanto, Syringo MR B17), in the axial, coronal, and sagittal planes, and for each orientation three concatenated acquisitions of 30 images (90 slices), matrix 512 × 512, pixel size 0.5273 × 0.5273 mm², slice thickness 2 mm, (ii) a 3D T1 IR BRAVO HR, on a General Electric 3 T DISCOVERY MR750 (23\LX\MR Software release: DV22.0_V02_1122.a) machine, in the axial plane, matrix 512 × 512, pixel size 0.4688 × 0.4688 mm², 288 slices, slice distance 0.7 mm, slice thickness 1.4 mm, and (iii) a DTI, 60 directions, b-value 3000 s/mm², on a General Electric 3 T DISCOVERY MR750 machine (23\LX\MR Software release: DV22.0_V02_1122.a; 32-channels receive coil), in the axial plane, matrix 256 × 256, pixel size 1.0938 × 1.0938 mm², 47 contiguous slices of 3.5-mm thickness (7 times), gradient homogeneity optimized beforehand. Splitting into four sessions and two machines was justified by the 1-hour duration of each acquisition (too long for one session) and the specific features of the WAIR sequence developed on the 1.5 T machine used in clinical routine.
Registration and normalization of image data sets
The T1, WAIR and diffusion MRI datasets were co-registered in the horizontalized ACPC system. AC and PC were positioned manually on the centres of commissures, with a superior inter-commissural point placed above the mid-inter-commissural point, between the right and left sulci of the corpus callosum. Registration of T1 and WAIR datasets used normalized mutual information, rigid transform, and anisotropic scaling in 3D (quasi-Newton optimization for finest resolution; Amira 6.4.0, Thermo Fisher Scientific Inc, Waltham, MA, USA). T1 and WAIR were spatially normalized to the ICBM 152 asymmetric nonlinear average (152 healthy subjects) T2 template53 horizontalized to ACPC (ICBM152acpc). The registration to the ICBM152acpc used non-linear diffeomorphism (DSI studio, https://dsi-studio.labsolver.org/citation.html, settings: edge on, large deform on, mutual information, resolution 1, dimension 12, smoothing 0.2, speed 1.0, final visual quality control). The image datasets were resampled (Lanczos filter) to isotropic 0.5-mm side voxels. The DTI sequence led to seven acquisitions by DTI series, one b = 0 series and 60 diffusion directions series (b = 3000 s/mm²). These 61 averaged diffusion MRI datasets were registered to the WAIR template using non-linear diffeomorphism giving isotropic 1-mm side voxels (DSI studio, https://dsi-studio.labsolver.org/citation.html; settings, edge on, large deform on, mutual information, resolution 1, dimension 12, smoothing 0.2, speed 1.0, final visual quality control), enabling to minimize the impact of DTI related distortions55. Two masks were created (Amira 6.4.0, Thermo Fisher Scientific Inc, Waltham, MA, USA): one simplified mask of gross brain contours, automatically extracted and manually optimized from the WAIR dataset, and one detailed mask of brain gyri excluding ventricles, fully manually contoured from the raw T1 dataset.
DTI tractography
Symmetric second-order tensors and fibre tracking were computed23 from the diffusion MRI datasets (Amira 6.4.0, Thermo Fisher Scientific Inc, Waltham, MA, USA; filtering, kernel 3, sigma 0.6). The table of gradients of MRI scanner was previously reorientated in relation to the ACPC system (measurement of pitch, roll and yaw angles on T1 dataset; 3 × 3 rotation matrix) to aid the interpretation of DEC maps. Tensor line fibre tracking (positive Ev, streamline and deflection algorithms) was computed for the main eigen vector, E1. FT settings for whole brain fibre tracing were as follows: FA parameters, FA >0.15, step 0.1; angle <75°; tracking options, vector sign considered (local alignment), step size 4 mm and length 160 mm. DEC maps were computed from E1 (Amira 6.4.0, Thermo Fisher Scientific Inc, Waltham, MA, USA; RGB color field, FA scaling).
The extended MRI deep brain atlas
We extended manually to fully cover the DB (small anterior addition of striatum), a set of 119 labelled structures coming from a DB atlas54. This DB atlas was built from an MRI dataset of high resolution images (voxel size 0.125 × 0.125 × 0.250 mm3; resampled according to the ACPC system) of a human anatomic specimen scanned at 4.7 tesla (3D T1 spin echo sequence; Bruker, Ettlingen, Germany). The labelled structures were meticulously manually contoured on the MRI images according to contrasts and advanced knowledge of DB architecture (Amira 6.4.0, Thermo Fisher Scientific Inc, Waltham, MA, USA). This allowed to show the DB nuclear architecture through 18 axial, 19 coronal and 15 sagittal plates. For our purpose, the extended labels and the 4.7 dataset were symmetrized (Amira 6.4.0, Thermo Fisher Scientific Inc, Waltham, MA, USA) and registered to the WAIR template using non-linear diffeomorphism (DSI studio, https://dsi-studio.labsolver.org/citation.html, settings: edge on, large deform on, mutual information, resolution 1, dimension 12, smoothing 0.2, speed 1.0, final visual quality control). The registered labels were named eMDBA (extended MRI Deep Brain Atlas) and consisted of 118 structures, of which five were unique (AC, PC, pineal gland, interbrain central grey, and periaqueductal grey). Two structures were not included in the eMDBA, because they were too small and their shapes too complex for the 1 mm-side resampled voxels: the group, supraoptic and suprachiasmatic nuclei of the hypothalamus, and the inferior parabigeminal area. The abbreviations, labels and colour code of structures are in the eMDBA Labels.xlsx file (Data Records).
Reference slices
Thirteen distinct slices were defined for visual assessment of the topographic information with reference to histological drawings and anatomical photographs of human specimens. Most came from the classical literature. They had to be oriented unambiguously, showing contours, locations, and names of DB structures for a satisfactory analysis. Two slices in relation to AC and PC served as a geometrical frame of reference: the axial slice through the bi-commissural plane56 [axial ACPC], and the coronal slice at the midpoint between AC and PC [coro MIP], between the mammillary bodies and the brain peduncles57. The axial ACPC and coro MIP slices enabled comparisons with most current human stereotactic atlases and derivatives9,11,58. The mammillo-subthalamo-thalamic slice, pseudo-coronal, slightly backward inclined (anteriorwise)56,59,60 [coro-bw MSV], was used for subthalamic nucleus (STN) analysis. The brachio-rubro-thalamic slice, pseudo-coronal, frontward inclined (posteriorwise)56,61 [coro-fw BRT], enabled the exploration of the brachium conjunctivum, the red nucleus (RN), the STN and the anterior thalamus around the mammillo-thalamic fascicle. The pseudo-axial slice, upward inclined (anteriorwise)9,62 [axial-uw BFG], was placed on the forebrain connectivity in the basal-brain region (hereafter “basal forebrain gate”). The axial-uw BFG was completed by one sagittal slice, and one pseudo-sagittal slice inclined along the anterior limb of the internal capsule, both crossing the basal forebrain gate, and a coronal slice crossing the anterior limb parallel to coro MIP [coro Alic]. The pseudo-axial slice, upward inclined (anteriorwise), through the ventricular foramen56,62,63 [axial-uw VF], enabled the analysis of the internal capsule. The slice parallel to the axial ACPC, crossing the inferior borders of colliculi and the interpeduncular nucleus56 served for the analysis of the commissure of Wernekink [axial cow ACPC]. The coronal slice, parallel to coro MIP going through the red nucleus and the ventro-intermediate nucleus of the thalamus (Vim) [coro RV] facilitated the understanding of cortico-thalamo-subthalamic connections. The analysis of large subcortical fascicles bordering and crossing the DB made use of: (i) the slice, upward inclined (anteriorwise), through the mammillary body (MB) and the posterior commissure [MB-PC], (ii) coronal slices coro MIP, coro Alic, and two slices through AC and PC [coro AC, coro PC], and (iii) an axial slice, upward inclined (anteriorwise), crossing the anterior margin sulcus of the insula, showing the uncinate fascicle56 [axial uncinate]. The 13 reference slices are in Supplementary information 1.
eMDBA-based interpretation of deep brain structural topography
We focused on the thalamo-subthalamic region, looking at the nuclear-based and connectivity-based architectures, with special emphasis on the STN, MB, RN, Vim, and pedunculopontine nucleus (PPN) landmarks, and the lesser-known ventral tegmental area (VTA). The detailed analysis drew on the information contained in the reference slices, according to DEC and whole brain fibre tracing. The DEC maps quickly identified the main orientation of FT, such as vertical cortical projections in blue within the posterior limb of the internal capsule. The colours according to the absolute value scheme26 enabled a finer analysis of subtle variations in orientations, also better identified with the colocation of tracing and DB structures. Fiber tracing slices were made of all the traces present in the 1 mm-thick piece. The eMDBA labels were coloured using the eMDBA colour code. Fiber tracing was labelled10,56,61,64, otherwise described and affixed with FT (e.g. thalamo-striatal FT). By construct, the terminology of fascicles does not tell us the direction of bundle connectivity, as petal and fugal attributes are not distinguished.
In sum, we first visually assessed the robustness of the gross brain architecture of the DB-MA atlas according to the 13 reference slices (i.e. the topography of large fascicles crossing or bordering the DB). We then analysed the mesoscopic topographic information of DB, focusing on thalamo-subthalamic connectivity. All registration and fibre tracking settings were optimized for reasonable computation times and display on a laptop computer (Windows 11 pro, x64; i7, 11th generation, 3.30 GHz; 32 GB RAM; GPU 4 GB). The template preparation and analysis workflow are shown in Fig. 1.
Fig. 1.

Template preparation and eMDBA analysis workflow.
Data Records
The DB-MA atlas, fully anonymized and masked, is in open access65. All datasets were exported from Amira (Amira 6.4.0, Thermo Fisher Scientific Inc, Waltham, MA, USA). The atlas is deposited at66.
The T1 image dataset is made up of 0.5-mm isotropic voxels, with a 602 × 754 × 634 lattice (greyscale, 32-bit float) in NIfTI format (T1 DBMA atlas).
The WAIR image dataset is made up of 0.5-mm isotropic voxels, with a 301 × 377 × 317 lattice (greyscale, 16-bit unsigned) in NIfTI format (Wair DBMA atlas).
The DEC image data is made of 0.5-mm isotropic voxels, with a 301 × 377 × 317 lattice (RGBA, 8-bit unsigned) in ascii.am Amira format (DEC DBMA atlas).
The DTI tracing dataset is made up of 7003729 lines, 120449556 points (5 values per point) in ascii.lineset.am Amira format (Tracing FT160mm-E1 DBMA atlas).
The eMDBA atlas is made up of 0.5-mm isotropic voxels, with a 301 × 377 × 317 lattice (label format, 8-bit unsigned) in NIfTI format (eMDBA DBMA atlas).
The colour code of eMDBA labels (acronyms and names) is in the eMDBA Labels file (.xlsx).
Technical Validation
The normalized healthy subject image data sets, T1, WAIR, and DEC, showed advanced architectural information (Fig. 2). T1 and WAIR images showed tangible complementary information, WAIR images being more detailed than T1 ones. The DB-MA atlas, intended to be fully mergeable with ICBM152 and CIT168 population-based atlases, enabled any atlas combination, and any display along any slice orientation (Fig. 3).
Fig. 2.

DB-MA atlas datasets: left to right, T1, WAIR, DEC, DTI-FT and eMDBA (coloured surfaces); axial horizontal plane through ACPC (top row); coronal plane through the midpoint between AC and PC (bottom row); ACPC system (yellow box), x-width 60 mm, y-length (ACPC length) 30 mm, z-height 60 mm.
Fig. 3.
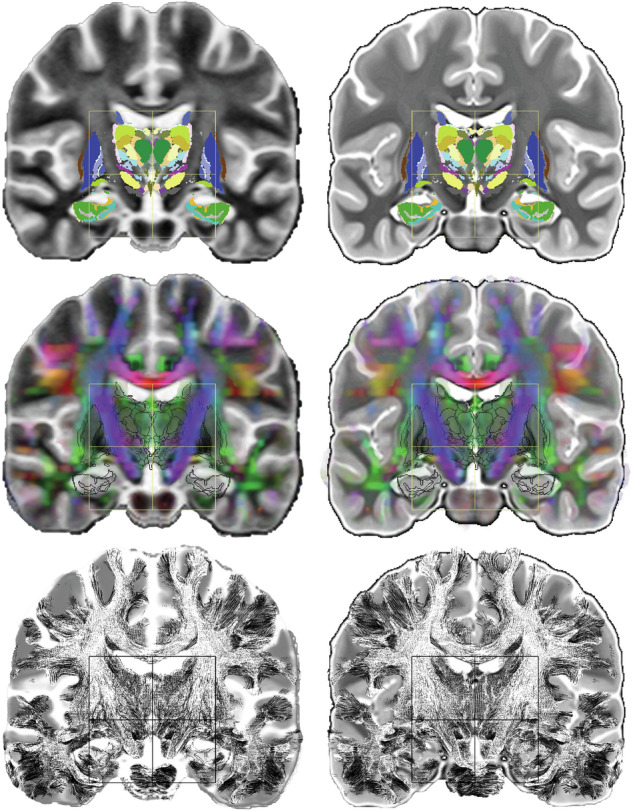
DB-MA atlas merged with the ICBM152 (left) and CIT168 (right) population-based atlases: coronal slice through the midpoint between AC and PC [coro MIP]; eMDBA labels (top row), DEC map with eMDBA contours (middle row), and whole brain fibre tracing with eMDBA contours (bottom row); ACPC system (box), x-width 60 mm, z-height 60 mm.
The comparison of DTI fibre architecture and microstructure of WM bundles of confocal and polarized light microscopy data63 showed that DEC maps provided pertinent topographic information within the internal capsule (Fig. 4).
Fig. 4.
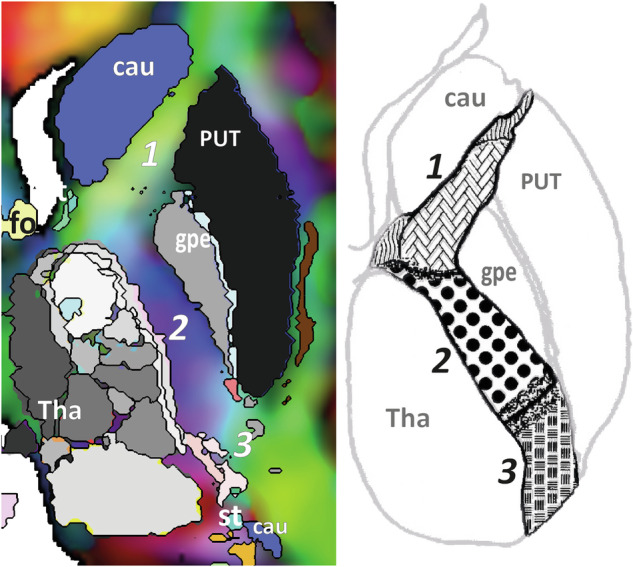
Pseudo-axial slice through the ventricular foramen [axial-uw VF] showing the anterior (1), posterior (2) and retrolenticular (3) limbs of the internal capsule with a specific colour coding detailing the segregation reported by confocal and polarized light microscopy, such as vertical fibres intermingled with horizontal thalamo-lenticular fibres (purple): DEC map with eMDBA labels (left); drawing adapted from Axer & Keyserlingk (right); caudate (cau), putamen (PUT), external globus pallidums (gpe), thalamus (Thal), stria terminalis (st), fornix (fo).
In a first step, looking at large structures crossing or bordering the DB, the atlas showed several important fascicles, supporting further specific DB analysis: (i) in the medial part of the hemisphere, the cingulum (CIN), the fronto-occipital fascicle (FOF), the tapetum (TP) and the corpus callosum FT (CC FT), (ii) in the internal capsule, the cortico-caudal FT (Cx FT) connecting cortices and lower structures (DB, brainstem, cerebellum, and spinal cord), the fascicle of Türck (TF), the temporo-thalamic fascicle of Arnold (ArF), the uncinate fascicle (UF), and the sensorimotor related FT (e.g. the corticobulbar and the cortico-spinal fascicles, which include the emblematic pyramidal fascicle) and the inferior longitudinal fascicle (ILF), and (iii) in the temporal stem, the ArF, the ILF, and the UF (Fig. 5).
Fig. 5.

Coronal slice through the anterior limb of the internal capsule [coro Alic] (anterior view) showing the cingulum (CIN), corpus callosum FT (CC FT), fronto-occipital fascicle (FOF) and pre-commissural fornix (pCFo); DEC slice with tracing and overlay of eMDBA labels (coloured surfaces; caudate, cau; putamen, put; nucleus accumbens, acc).
In a second step, looking at small-scale DB architecture, the atlas showed a fine-grained architecture, exemplified for the thalamo-subthalamic connectivity. Vertically, the cortico-caudal FT split into cortico-thalamic and cortico-subthalamic traces, crossing respectively the superficial lateral and external lamina of thalamus terminating mainly within the ventrolateral nuclei, and the lateral part of the zona incerta, STN, and Forel’s fields, terminating in tegmental structures (Fig. 6). Transversally, the tracing showed the connectivity of temporal cortices, lenticular, and sublenticular structures, with thalamo-subthalamic structures, crossing and bordering the internal capsule, belonging to the lenticular fascicle, the thalamic fascicle, the temporo-thalamic fascicle of Arnold, and lenticulo-thalamic and subthalamic FT (Fig. 7). The cerebello-rubro-thalamo-cortical pathway was identified, notably the brachium conjunctivum and the tegmental commissures of Wernekink and of Bechterew. The meso-organization of the region located medially to the internal capsule and between the hypothalamus and the red nucleus (our basal forebrain gate), was detailed showing the traces of the basal forebrain FT (medial), the ansa lenticularis (lateral), the lenticular fascicle (superior and lateral), the fornix, and the stria terminalis (anterior and medial) (Fig. 8).
Fig. 6.

DEC (background) with eMDBA labels (A,C, coloured surfaces; B, only contours), and tracing along the [coro MIP] slice: A and B, fascicle of Türck (TF), cortico-caudal FT (Cx FT), cortico-subthalamus FT (CST FT), cortico-thalamus FT (CT FT), cortico-internal-globus-pallidums FT (Cgpi FT), callosal FT (CC FT), fronto-occipital fascicle (FOF), nucleus anterolateral of thalamus (AL), nucleus dorsolateral of thalamus (DL), caudate (Cau), fornix (Fo), internal globus pallidums (gpi); nucleus intermediolateral of thalamus (IL), medial nucleus of thalamus (M); subthalamus nucleus (STN), substantia nigra (SN), ventral tegmental area (VTA), ventro-oral nucleus of the thalamus (VO), zona incerta (ZI); B, selection of direct cortical connectivity of STN (*) and gpi (#).
Fig. 7.
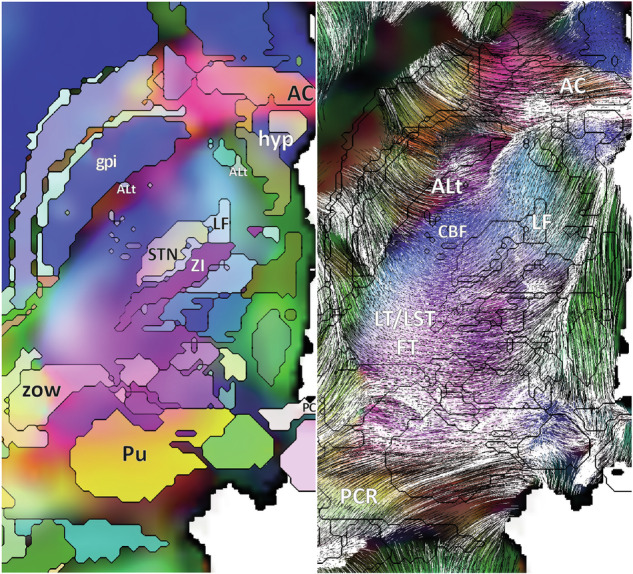
DEC with eMDBA labels (left), and tracings with eMDBA contours (right) along the axial ACPC slice: lenticular fascicle (LF), corticobulbar fascicle (CBF), tip-pallidal fascicle of ansa lenticularis (ALt), lenticulo-thalamic and subthalamic FT (LT/LST FT), pulvino-cortical radiations (PCR); internal globus pallidums (gpi), subthalamus nucleus (STN), pulvinar (Pu), zone of Wernicke (zow), hypothalamus (hyp), anterior commissure (AC), posterior commissure (PC).
Fig. 8.
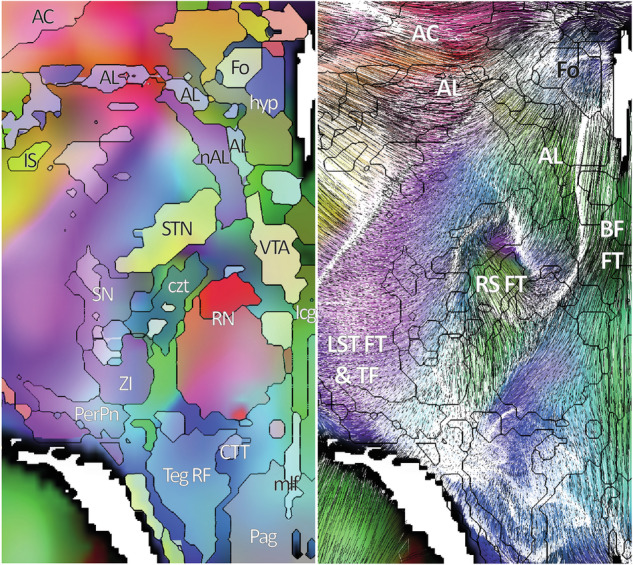
DEC with eMDBA labels (left), and tracing with eMDBA contours (right) along the pseudo axial slice through the basal forebrain gate (axial-uw BFG slice): ansa lenticularis (AL), fornix (Fo), lenticulo-subthalamic FT (LST FT), fascicle of Türck (TF), anterior commissure (AC), rubro-STN FT (RS FT), and basal forebrain FT (BF FT); hypothalamus (hyp), substantia innominata (IS), ventral tegmental area (VTA), nucleus ansa lenticularis (nAL), red nucleus (RN), peripeduncular nucleus (PerPn), interbrain central grey (Icg), periaqueductal grey (Pag), central tegmental tract (CTT), central zone of tegmentum (czt), medial longitudinal fascicle (mlf), zona incerta (ZI), tegmental reticular formation (Teg RF).
In a third step, looking at the differences between the nuclear-based and the fibre architectures, DEC maps highlighted different diffusion fields that did not match with the nuclear-based architecture. The DB-MA atlas thus showed, within the thalamo-subthalamic region, in the coronal plane, a median part (of right and left hemispheres), characterized by a main longitudinal orientation (green; DEC), flanked by two lateral regions, right and left, merging vertical and transversal orientations within the internal capsule (blue, purple, pink; DEC) (Fig. 6). Within the thalamus, in the axial plane, the DEC-related fibre architecture revealed the particular location of the ventro-intermediate nucleus, in the anterior zone of cortico-thalamic tracing and lenticulo-thalamic FT (pink-purple), and behind the longitudinal tracing (green) (Fig. 9).
Fig. 9.

DEC (left) with tracing (right) and eMDBA contours along an axial slice parallel to ACPC (+3 mm above), through the ventro-intermediate nucleus of the thalamus (vim; white arrows) showing its particular location (see text): caudate (cau), putamen (put), external globus pallidus (gpe), fornix (Fo), mammillo-thalamic fascicle (mtf), ventro-oral thalamus (VO), ventrocaudal thalamus (VC), centromedian nucleus (CM), median nucleus (M), pulvinar (Pu).
Complementary extended data for the technical evaluation are given in Supplementary information 2.
Usage Notes
The DB-MA atlas provides new normalized colocalized tools showing DB MRI architecture, nuclear and fibre, with 118 labelled DB structures, and is open-source. It facilitates the 3D analysis of topography, adding information to the literature and nonspecific open access atlases, including historic data, notably thanks to the advanced labelling. In addition, the spatial normalization to ICBM 152 enables registration with most label brain atlases (Fig. 3). It appreciably refines our understanding of fibre and nuclear-based architectures of DB. DTI tracing clarifies the meso-architecture, already interpretable, though more aggregated, with DEC maps.
Our results can help to further decipher the wiring of the brain67, particularly since our data compare favourably with those reported with a sophisticated tracking method (e.g. see introduction). In addition, the use of labelled reference slices provided with the DB-MA atlas might upgrade the quality control of topographic atlases. Despite efforts to date, there are still no gold standard atlases of DB but only benchmarks, especially in the medical field where manual and atlas-based contouring have their advantages and disadvantages68–72.
We opted to make use of slices, as the 13 reference slices, and notably for DTI showing the main water diffusion without 3D fascicle display, to avoid fascicle-reconstruction biases linked to models and ROI positioning. Moreover, the display of 3D fascicle representation, intermingled in a reduce volume, would have been unclear and hard to interpret. Finally, the definitions of some fascicles, particularly in the DB, is still unsettled73. Hence the display and interpretation of entire fascicles extending over several slices was not accessible, except for those running parallel to the slice orientation (e.g. Fig. 6). Nevertheless, the DB-MA atlas allows advanced analysis along any slice orientation chosen by the user.
We note that the WAIR sequence highlights low MRI contrasts that reflect the imbrication of nuclei and WM bundles, compared with T1 (Fig. 2). This IR sequence was selected because it is reliable in clinical practice13,52.
The whole DB tracing pinpointed the thalamo-subthalamic meso-connectivity and large fascicles bordering and crossing, visualizing intricate organizations. For example, as regards large fascicles, the DB-MA atlas clearly shows the architecture of the poorly known occipito-frontal fascicle, identified by Talairach and Tournoux10 that runs above the caudate, anteroposterior, and below the corpus callosum (Fig. 5). As regards the DB more specifically, the DB-MA atlas updates insights into the internal capsule architecture. It clearly shows the segregated organization of fibre bundles within the internal capsule63 (Fig. 4). At a more advanced level of interpretation of the organization, it shows the transversal network of fibres in the posterior limb apparently made up of lenticulo-thalamic and lenticulo-subthalamic fibres, such as the strio-Luysian radiations56 and intrastriatal fibres60 (Figs. 7, 8, and Supplementary information 2). The DB-MA atlas also helps to locate the cortico-subthalamic hyper direct pathway74,75, of small size56,76, likely made up essentially of collateral branching to the STN, ZI, and RN77,78. This pathway seems embedded in the cortico-subthalamic FT, indistinguishable from corticopetal connectivity, which has long been studied for the STN56,79. The atlas also shows a cortico-internal globus pallidums FT (Cgpi FT; Fig. 6), already reported80, arguing for a direct connectivity between the internal pallidums and the cortex81–83. This illustrates the utility of the DB-MA atlas for understanding the basal ganglia connectivity and organization. The atlas also adds some architectural information about the basal forebrain gate, where several fascicles are intermingled, and which has been targeted by DBS to treat hyperaggressivity84, depression85, and cluster headache86 (Fig. 8 and Supplementary information 2).
The DEC maps of the DB-MA atlas also reveal the fibre architecture, bringing new insights into the deep brain, which differs from the nuclear architecture of basal ganglia. This is notable in the thalamus, where the atlas illustrates the orientation of fibres connecting thalamic nuclei. This could also help to locate nuclei and interpret connectivity, for example the ventro-intermediate nucleus in anti-tremor surgery (Fig. 9). In the subthalamus, the atlas shows the different orientation of fibres within the STN (Fig. 10), illustrating another aspect of its anatomical and functional segregation59,87,88.
Fig. 10.

3D rendering of the mammillary body (MB), the subthalamic nucleus (STN) and the ventro-intermediate nucleus of the thalamus (Vim) coloured according to DEC (MSV slice; left, WAIR, top right, DEC) showing the differences between connectivity-based and nuclear based architectures. Internal architecture of STN (adapted from Mettler 1948) matching with the connectivity-based architecture (see text): myelinated reticulum of the lateral part of STN (1); subthalamo-prerubral fibres (2); perforating pallidosubthalamic fibres (3); zona incerta, zi.
The DB-MA atlas has some limitations, the first being its narrow focus on the DB. However, the ICBM-152 normalization lets us merge DB-MA data with most numerical atlases and software environments (Fig. 3), such as SPM89, FSL90, and Lead-DBS91, thereby widening its scope. Another constraint, though not specific to the DB-MA atlas, is the unsettled terminology of nuclear structures and fascicles. Consensual definitions are required to support further progress in the field. Unified databases of structures, where labels and topography are clear and standardized, will facilitate new artificial intelligence-based strategies92. The DB-MA atlas is based on one healthy subject as the template of T1, WAIR and diffusion MRI datasets and one other healthy subject as the template for the eMDBA, which together can be used as a benchmark. The DB-MA atlas does not therefore reflect interindividual variability. Benchmarking is mandatory for the determination of reference sets of DB contours to help define gold standards, where expert analysis can be performed jointly with computed approaches. In addition to all this, although the DB-MA atlas provides advanced resources, the semi-clinical conditions of DTI acquisition and the common model of diffusion analysis leave room for future improvements.
In summary, meso- and macro-aspects of DB fibre architecture emerged against a body of multidisciplinary scientific data (Supplementary information 1, 2). The 60-direction DTI tensor line fibre tracking and 160 mm tracing yielded advanced meso-connectivity data for the DB, accurately interpreted when registered with the eMDBA. The DB-MA atlas is an open-source multimodal, truthful tool that should help physicians and scientists gain a better understanding of DB architecture and connectivity.
Supplementary information
Acknowledgements
This work was part-funded by the Fondation de l’Avenir (Ptolemée program, 21 0099 01: grants for PhD student AD and scientist OO).
Author contributions
(CRediT) Jean-Jacques Lemaire: Conceptualization, methodology, writing – original draft, visualization, funding acquisition, writing – review & editing. Rémi Chaix: formal analysis, validation, writing – review & editing. Aigerim Dautkulova: data curation, software. Anna Sontheimer: investigation, resources, project administration. Jérôme Coste: data curation, project administration, writing – review & editing. Ana-Rachel Marques: validation, writing – review & editing, Adrien Wohrer: validation, writing – review & editing. Karine Chassain: investigation, resources. Omar Ouachikh: visualisation, writing – review & editing. Omar Ait-Aider: supervision, writing – review & editing. Denys Fontaine: conceptualization, methodology, writing – original draft, supervision, writing – review & editing.
Code availability
Computation (affine registration, DTI analysis) and display (slice composition) were performed with Amira 6.4.0, Thermo Fisher Scientific Inc, Waltham, MA, USA.
Non-linear diffeomorphism was performed with DSI studio: https://dsi-studio.labsolver.org/citation.html; settings, edge on, large deform on, mutual information, resolution 1, dimension 12, smoothing 0.2, speed 1.0, final visual quality control.
No custom code was used during this study for the curation and/or validation of the dataset.
Competing interests
The authors declare no competing interests.
Footnotes
Publisher’s note Springer Nature remains neutral with regard to jurisdictional claims in published maps and institutional affiliations.
Change history
12/24/2024
A Correction to this paper has been published: 10.1038/s41597-024-04274-0
Supplementary information
The online version contains supplementary material available at 10.1038/s41597-024-04053-x.
References
- 1.Neumann, W.-J., Horn, A. & Kühn, A. A. Insights and opportunities for deep brain stimulation as a brain circuit intervention. Trends in Neurosciences46, 472–487 (2023). [DOI] [PubMed] [Google Scholar]
- 2.Schmitt, O., Eipert, P., Kettlitz, R., Leßmann, F. & Wree, A. The connectome of the basal ganglia. Brain Struct Funct221, 753–814 (2016). [DOI] [PubMed] [Google Scholar]
- 3.Rolls, E. T., Huang, C., Lin, C., Feng, J. & Joliot, M. Automated anatomical labelling atlas 3. NeuroImage206, 5 (2020). [DOI] [PubMed] [Google Scholar]
- 4.Tyszka, J. M., Pauli, W. & Nili, A. An In Vivo High Resolution Atlas of the Subcortical Human Brain (CIT168). 10.17605/OSF.IO/R2HVK (2017).
- 5.NITRC: IIT Human Brain Atlas (v.5.0): Tool/Resource Info. https://www.nitrc.org/projects/iit/ (2019).
- 6.Fan, L. et al. The Human Brainnetome Atlas: A New Brain Atlas Based on Connectional Architecture. Cereb. Cortex26, 3508–3526 (2016). [DOI] [PMC free article] [PubMed] [Google Scholar]
- 7.Xiao, Y. et al. A dataset of multi-contrast population-averaged brain MRI atlases of a Parkinson’s disease cohort. Data Brief12, 370–379 (2017). [DOI] [PMC free article] [PubMed] [Google Scholar]
- 8.Multi-contrast PD126 and CTRL17 templates – NIST. https://nist.mni.mcgill.ca/multi-contrast-pd126-and-ctrl17-templates/.
- 9.Schaltenbrand, G. & Wahren, W. Atlas for Stereotaxy of the Human Brain. (Thieme, Stuttgart, New York, 1977).
- 10.Talairach, J. & Tournoux, P. Co-Planar Stereotaxic Atlas of the Human Brain/3-Dimensional Proportional System: An Approach to Cerebral Imaging. (Thieme, Stuttgart, New York, 1988).
- 11.Mai, J. K., Majtanik, M. & Paxinos, G. Atlas of the Human Brain. (Academic Press, Elsevier, Amsterdam, Boston, Heidelberg, London, New York, Oxford, Paris, San Diego, San Francisco, Singapore, Sydney, Tokyo, 2016).
- 12.Polanski, W. H. et al. Comparison of Automatic Segmentation Algorithms for the Subthalamic Nucleus. Stereotact Funct Neurosurg98, 256–262 (2020). [DOI] [PubMed] [Google Scholar]
- 13.Zerroug, A. et al. Personalized mapping of the deep brain with a white matter attenuated inversion recovery (WAIR) sequence at 1.5-tesla: Experience based on a series of 156 patients. Neurochirurgie62, 183–9 (2016). [DOI] [PubMed] [Google Scholar]
- 14.Judaš, M. & Cepanec, M. Oskar Vogt: The first myeloarchitectonic map of the human frontal cortex. Translational Neuroscience1, 72–94 (2010). [Google Scholar]
- 15.Basser, P. J., Mattiello, J. & LeBihan, D. MR diffusion tensor spectroscopy and imaging. Biophys J66, 259–67 (1994). [DOI] [PMC free article] [PubMed] [Google Scholar]
- 16.Jeurissen, B., Descoteaux, M., Mori, S. & Leemans, A. Diffusion MRI fiber tractography of the brain. NMR in Biomedicine32, e3785 (2019). [DOI] [PubMed] [Google Scholar]
- 17.Afzali, M. et al. The sensitivity of diffusion MRI to microstructural properties and experimental factors. Journal of Neuroscience Methods347, 108951 (2021). [DOI] [PMC free article] [PubMed] [Google Scholar]
- 18.Mukherjee, P., Chung, S. W., Berman, J. I., Hess, C. P. & Henry, R. G. Diffusion Tensor MR Imaging and Fiber Tractography: Technical Considerations. AJNR Am J Neuroradiol29, 843–852 (2008). [DOI] [PMC free article] [PubMed] [Google Scholar]
- 19.Jones, D. K. & Cercignani, M. Twenty‐five pitfalls in the analysis of diffusion MRI data. NMR in Biomedicine23, 803–820 (2010). [DOI] [PubMed] [Google Scholar]
- 20.Barrio-Arranz, G., De Luis-García, R., Tristán-Vega, A., Martín-Fernández, M. & Aja-Fernández, S. Impact of MR Acquisition Parameters on DTI Scalar Indexes: A Tractography Based Approach. PLoS ONE10, e0137905 (2015). [DOI] [PMC free article] [PubMed] [Google Scholar]
- 21.Jelescu, I. O. & Budde, M. D. Design and Validation of Diffusion MRI Models of White Matter. Front. Phys. 5 (2017). [DOI] [PMC free article] [PubMed]
- 22.Magdoom, K. N., Avram, A. V., Sarlls, J. E., Dario, G. & Basser, P. J. A novel framework for in-vivo diffusion tensor distribution MRI of the human brain. NeuroImage271, 120003 (2023). [DOI] [PMC free article] [PubMed] [Google Scholar]
- 23.Westin, C.-F. et al. Processing and visualization for diffusion tensor MRI. Medical Image Analysis6, 93–108 (2002). [DOI] [PubMed] [Google Scholar]
- 24.Tuch, D. S. Q-ball imaging. Magn Reson Med52, 1358–1372 (2004). [DOI] [PubMed] [Google Scholar]
- 25.Tournier, J.-D., Calamante, F., Gadian, D. G. & Connelly, A. Direct estimation of the fiber orientation density function from diffusion-weighted MRI data using spherical deconvolution. NeuroImage23, 1176–1185 (2004). [DOI] [PubMed] [Google Scholar]
- 26.Pajevic, S. & Pierpaoli, C. Color schemes to represent the orientation of anisotropic tissues from diffusion tensor data: application to white matter fiber tract mapping in the human brain. Magn Reson Med42, 526–540 (1999). [PubMed] [Google Scholar]
- 27.O’Donnell, L. J. & Westin, C.-F. An introduction to diffusion tensor image analysis. Neurosurg. Clin. N. Am.22, 185–196 (2011). viii. [DOI] [PMC free article] [PubMed] [Google Scholar]
- 28.Behrens, T. E. J., Berg, H. J., Jbabdi, S., Rushworth, M. F. S. & Woolrich, M. W. Probabilistic diffusion tractography with multiple fibre orientations: What can we gain? Neuroimage34, 144–155 (2007). [DOI] [PMC free article] [PubMed] [Google Scholar]
- 29.Tournier, J.-D., Calamante, F. & Connelly, A. Robust determination of the fibre orientation distribution in diffusion MRI: Non-negativity constrained super-resolved spherical deconvolution. NeuroImage35, 1459–1472 (2007). [DOI] [PubMed] [Google Scholar]
- 30.Reisert, M. et al. Global fiber reconstruction becomes practical. NeuroImage54, 955–962 (2011). [DOI] [PubMed] [Google Scholar]
- 31.Pujol, J. et al. The lateral asymmetry of the human brain studied by volumetric magnetic resonance imaging. Neuroimage17, 670–9 (2002). [PubMed] [Google Scholar]
- 32.Pujol, S. et al. In vivo Exploration of the Connectivity between the Subthalamic Nucleus and the Globus Pallidus in the Human Brain Using Multi-Fiber Tractography. Frontiers in Neuroanatomy10, (2017). [DOI] [PMC free article] [PubMed]
- 33.Behrens, T. E. J. et al. Non-invasive mapping of connections between human thalamus and cortex using diffusion imaging. Nat Neurosci6, 750–7 (2003). [DOI] [PubMed] [Google Scholar]
- 34.Nagae-Poetscher, L. M. et al. High-resolution diffusion tensor imaging of the brain stem at 3 T. Am J Neuroradiol25, 1325–30 (2004). [PMC free article] [PubMed] [Google Scholar]
- 35.Delman, B. N., Cheuk, Y. T. & Naidich, T. P. Diffusion Tensor Imaging (DTI) of fixed Brain Tissue at 9.4 Tesla. in Duvernoy’s Atlas of the Human Brain Stem and Cerebellum 549–560 (Springer-Verlag/Wien, Austria, 2009).
- 36.Kollias, S. S., Law, M., Lui, Y., Naidich, T. P. & Delman, B. N. Diffusion Tensor Imaging (DTI) in vivo: Anatomic-DTI correlation at 3T. in Duvernoy’s Atlas of the Human Brain Stem and Cerebellum 498–548 (Springer-Verlag/Wien, Austria, 2009).
- 37.Lemaire, J.-J. et al. White matter anatomy of the human deep brain revisited with high resolution DTI fibre tracking. Neurochirurgie57, 52–67 (2011). [DOI] [PubMed] [Google Scholar]
- 38.Coenen, V. A. et al. The anatomy of the human medial forebrain bundle: Ventral tegmental area connections to reward-associated subcortical and frontal lobe regions. Neuroimage Clin18, 770–783 (2018). [DOI] [PMC free article] [PubMed] [Google Scholar]
- 39.Najdenovska, E. et al. In-vivo probabilistic atlas of human thalamic nuclei based on diffusion- weighted magnetic resonance imaging. Sci Data5, 180270 (2018). [DOI] [PMC free article] [PubMed] [Google Scholar]
- 40.Oishi, K., Mori, S., Troncoso, J. C. & Lenz, F. A. Mapping tracts in the human subthalamic area by 11.7T ex vivo diffusion tensor imaging. Brain Struct Funct225, 1293–1312 (2020). [DOI] [PMC free article] [PubMed] [Google Scholar]
- 41.Schira, M. M. et al. HumanBrainAtlas: an in vivo MRI dataset for detailed segmentations. Brain Struct Funct228, 1849–1863 (2023). [DOI] [PMC free article] [PubMed] [Google Scholar]
- 42.Sedrak, M. et al. Diffusion tensor imaging (DTI) and colored fractional anisotropy (FA) mapping of the subthalamic nucleus (STN) and the globus pallidus interna (GPi). Acta Neurochir152, 2079–2084 (2010). [DOI] [PMC free article] [PubMed] [Google Scholar]
- 43.Coenen, V. A. et al. A detailed analysis of anatomical plausibility of crossed and uncrossed streamline rendition of the dentato-rubro-thalamic tract (DRT(T)) in a commercial stereotactic planning system. Acta Neurochir163, 2809–2824 (2021). [DOI] [PMC free article] [PubMed] [Google Scholar]
- 44.Zhang, Y. et al. Diffusion tensor tractography of brainstem fibers and its application in pain. PLoS One15, e0213952 (2020). [DOI] [PMC free article] [PubMed] [Google Scholar]
- 45.Puybasset, L. et al. Prognostic value of global deep white matter DTI metrics for 1-year outcome prediction in ICU traumatic brain injury patients: an MRI-COMA and CENTER-TBI combined study. Intensive Care Med48, 201–212 (2022). [DOI] [PubMed] [Google Scholar]
- 46.Unrath, A., Klose, U., Grodd, W., Ludolph, A. C. & Kassubek, J. Directional colour encoding of the human thalamus by diffusion tensor imaging. Neuroscience Letters434, 322–327 (2008). [DOI] [PubMed] [Google Scholar]
- 47.Ellmore, T. M., Murphy, S. M., Cruz, K., Castriotta, R. J. & Schiess, M. C. Averaging of diffusion tensor imaging direction-encoded color maps for localizing substantia nigra. Computers in Biology and Medicine51, 104–110 (2014). [DOI] [PubMed] [Google Scholar]
- 48.Calixto, C. et al. Detailed anatomic segmentations of a fetal brain diffusion tensor imaging atlas between 23 and 30 weeks of gestation. Hum Brain Mapp44, 1593–1602 (2022). [DOI] [PMC free article] [PubMed] [Google Scholar]
- 49.Labayru, G. et al. White matter integrity changes and neurocognitive functioning in adult-late onset DM1: a follow-up DTI study. Sci Rep12, 3988 (2022). [DOI] [PMC free article] [PubMed] [Google Scholar]
- 50.Gao, M. et al. Multimodal brain connectome-based prediction of suicide risk in people with late-life depression. Nat. Mental Health1, 100–113 (2023). [Google Scholar]
- 51.Vassal, F. et al. Direct stereotactic targeting of the ventrointermediate nucleus of the thalamus based on anatomic 1.5-T MRI mapping with a white matter attenuated inversion recovery (WAIR) sequence. Brain Stimul5, 625–633 (2012). [DOI] [PubMed] [Google Scholar]
- 52.El Ouadih, Y. et al. Deep brain stimulation of the subthalamic nucleus in severe Parkinson’s disease: relationships between dual-contact topographic setting and 1-year worsening of speech and gait. Acta Neurochir (Wien)165, 3927–3941 (2023). [DOI] [PubMed] [Google Scholar]
- 53.Collins, L. ICBM 2009c Nonlinear Asymmetric template. https://nist.mni.mcgill.ca/icbm-152-nonlinear-atlases-2009/ (2009).
- 54.Lemaire, J.-J. et al. MRI Atlas of the Human Deep Brain. Front. Neurol.10, 851 (2019). [DOI] [PMC free article] [PubMed] [Google Scholar]
- 55.Huang, H. et al. Correction of B0 susceptibility induced distortion in diffusion-weighted images using large-deformation diffeomorphic metric mapping. Magnetic Resonance Imaging26, 1294–1302 (2008). [DOI] [PMC free article] [PubMed] [Google Scholar]
- 56.Dejerine, J. Anatomie Des Centres Nerveux (Tomes 1 and 2). (Paris, 1901).
- 57.Charcot, J.-M. Leçons sur les localisations dans les maladies du cerveau. (V. ADRIEN DELAHYE, Paris, 1876).
- 58.Talairach, J., David, M., Tournoux, P., Corredor, H. & Kvasina, T. Atlas d’anatomie Stéréotaxique. Repérage Radiologique Indirect Des Noyaux Gris Centraux Des Régions Mésencéphalo-Sous-Optiques et Hypothalamiques de l’homme. (Masson et Cie, Paris, 1957).
- 59.Mettler, F. Neuroanatomy. (C.V.Mosby, St. Louis, 1948).
- 60.Nieuwenhuys, R., Voogd, J. & Huijzen, C. The Human Central Nervous System. (Springer-Verlag, Berlin, Heidelberg, New York, 2008).
- 61.Riley, H. An Atlas of the Basal Ganglia, Brain Stem and Spinal Cord. (Baltimore, 1953).
- 62.Luys, J. Iconographie photographique des centres nerveux: ouvrage accompagné d’un atlas de soixante-dix photographies et de soixante-cinq schémas lithographiés. Atlas de soixante-dix photographies: avec soixante-cinq lithographiés. (Baillière, 1873).
- 63.Axer, H. & Keyserlingk, D. G. v. Mapping of fiber orientation in human internal capsule by means of polarized light and confocal scanning laser microscopy. Journal of Neuroscience Methods94, 165–175 (2000). [DOI] [PubMed] [Google Scholar]
- 64.Catani, M. & Thiebaut de Schotten, M. Atlas of Human Brain Connections. (Oxford University Press, Oxford, UK, 2012).
- 65.Perkel, J. M. How to make your scientific data accessible, discoverable and useful. Nature618, 1098–1099 (2023). [DOI] [PubMed] [Google Scholar]
- 66.Lemaire, J. J. et al. DB_MA atlas.10.17605/OSF.IO/6M3JV (2024).
- 67.Lee, D. & Park, H.-J. A populational connection distribution map for the whole brain white matter reveals ordered cortical wiring in the space of white matter. NeuroImage254, 119167 (2022). [DOI] [PubMed] [Google Scholar]
- 68.Abosch, A., Yacoub, E., Ugurbil, K. & Harel, N. An assessment of current brain targets for deep brain stimulation surgery with susceptibility-weighted imaging at 7 tesla. Neurosurgery67, 1745–1756; discussion 1756 (2010). [DOI] [PMC free article] [PubMed]
- 69.Yang, A. I. et al. Tractography-Based Surgical Targeting for Thalamic Deep Brain Stimulation: A Comparison of Probabilistic vs Deterministic Fiber Tracking of the Dentato-Rubro-Thalamic Tract. Neurosurgery90, 419–425 (2022). [DOI] [PMC free article] [PubMed] [Google Scholar]
- 70.Constanthin, P. E., Zemzemi, N., Cuny, E. & Engelhardt, J. Comparison of two segmentation software tools for deep brain stimulation of the subthalamic and ventro-intermedius nuclei. Acta Neurochir (Wien)165, 3397–3402 (2023). [DOI] [PubMed] [Google Scholar]
- 71.Miller, C. P. K. et al. Automatic Segmentation of Parkinson Disease Therapeutic Targets Using Nonlinear Registration and Clinical MR Imaging: Comparison of Methodology, Presence of Disease, and Quality Control. Stereotactic and Functional Neurosurgery101, 146–157 (2023). [DOI] [PubMed] [Google Scholar]
- 72.Shaff, N. et al. Comparison of automated and manual quantification methods for neuromelanin-sensitive MRI in Parkinson’s disease. Hum Brain Mapp10.1002/hbm.26544 (2023). [DOI] [PMC free article] [PubMed] [Google Scholar]
- 73.Mandonnet, E., Sarubbo, S. & Petit, L. The Nomenclature of Human White Matter Association Pathways: Proposal for a Systematic Taxonomic Anatomical Classification. Front Neuroanat12, 94 (2018). [DOI] [PMC free article] [PubMed] [Google Scholar]
- 74.Nambu, A. Seven problems on the basal ganglia. Current Opinion in Neurobiology18, 595–604 (2008). [DOI] [PubMed] [Google Scholar]
- 75.Jorge, A. et al. Hyperdirect connectivity of opercular speech network to the subthalamic nucleus. Cell Rep38, 110477 (2022). [DOI] [PMC free article] [PubMed] [Google Scholar]
- 76.MaiJ. & Ashwell, K. The Human Nervous System (Second Edition): Fetal Development of the Central Nervous System. (George Paxinos and Jürgen K. Mai, 2004).
- 77.Yelnik, J. & Percheron, G. Subthalamic neurons in primates: a quantitative and comparative analysis. Neuroscience4, 1717–1743 (1979). [DOI] [PubMed] [Google Scholar]
- 78.Coudé, D., Parent, A. & Parent, M. Single-axon tracing of the corticosubthalamic hyperdirect pathway in primates. Brain Struct Funct223, 3959–3973 (2018). [DOI] [PubMed] [Google Scholar]
- 79.Fulton, J. F. Physiology of the Nervous System. (London, New York, Toronto, 1943).
- 80.Milardi, D. et al. Basal ganglia network by constrained spherical deconvolution: A possible cortico‐pallidal pathway? Movement Disorders30, 342–349 (2015). [DOI] [PubMed] [Google Scholar]
- 81.Cacciola, A. et al. A Connectomic Analysis of the Human Basal Ganglia Network. Frontiers in Neuroanatomy11, (2017). [DOI] [PMC free article] [PubMed]
- 82.Ni, Z. et al. Pallidal deep brain stimulation modulates cortical excitability and plasticity. Ann Neurol83, 352–362 (2018). [DOI] [PubMed] [Google Scholar]
- 83.Sontheimer, A. et al. Disrupted Pallido-Thalamo-Cortical Functional Connectivity in Chronic Disorders of Consciousness. Brain Sciences11, 356 (2021). [DOI] [PMC free article] [PubMed] [Google Scholar]
- 84.Sano, K., Mayanagi, Y., Sekino, H., Ogashiwa, M. & Ishijima, B. Results of stimulation and destruction of the posterior hypothalamus in man. J. Neurosurg33, 689–707 (1970). [DOI] [PubMed] [Google Scholar]
- 85.Coenen, V. A. et al. Medial forebrain bundle stimulation as a pathophysiological mechanism for hypomania in subthalamic nucleus deep brain stimulation for Parkinson’s disease. Neurosurgery64, 1106–1114, discussion 1114-1115 (2009). [DOI] [PubMed] [Google Scholar]
- 86.Fontaine, D. et al. Anatomical location of effective deep brain stimulation electrodes in chronic cluster headache. Brain133, 1214–1223 (2010). [DOI] [PubMed] [Google Scholar]
- 87.Obeso, J. A. et al. Functional organization of the basal ganglia: therapeutic implications for Parkinson’s disease. Mov. Disord23(Suppl 3), S548–559 (2008). [DOI] [PubMed] [Google Scholar]
- 88.Haynes, W. I. A. & Haber, S. N. The organization of prefrontal-subthalamic inputs in primates provides an anatomical substrate for both functional specificity and integration: implications for Basal Ganglia models and deep brain stimulation. J Neurosci33, 4804–4814 (2013). [DOI] [PMC free article] [PubMed] [Google Scholar]
- 89.SPM - Statistical Parametric Mapping. https://www.fil.ion.ucl.ac.uk/spm/ (2023).
- 90.FSL - FslWiki. https://fsl.fmrib.ox.ac.uk/fsl/fslwiki/ (2020).
- 91.Neudorfer, C. et al. Lead-DBS v3.0: Mapping deep brain stimulation effects to local anatomy and global networks. NeuroImage268, 119862 (2023). [DOI] [PMC free article] [PubMed] [Google Scholar]
- 92.Bobák, P., Čmolík, L. & Čadík, M. Reinforced Labels: Multi-Agent Deep Reinforcement Learning for Point-Feature Label Placement. IEEE Trans. Visual. Comput. Graphics 1–14, 10.1109/TVCG.2023.3313729 (2023). [DOI] [PubMed]
Associated Data
This section collects any data citations, data availability statements, or supplementary materials included in this article.
Data Citations
- Lemaire, J. J. et al. DB_MA atlas.10.17605/OSF.IO/6M3JV (2024).
Supplementary Materials
Data Availability Statement
Computation (affine registration, DTI analysis) and display (slice composition) were performed with Amira 6.4.0, Thermo Fisher Scientific Inc, Waltham, MA, USA.
Non-linear diffeomorphism was performed with DSI studio: https://dsi-studio.labsolver.org/citation.html; settings, edge on, large deform on, mutual information, resolution 1, dimension 12, smoothing 0.2, speed 1.0, final visual quality control.
No custom code was used during this study for the curation and/or validation of the dataset.