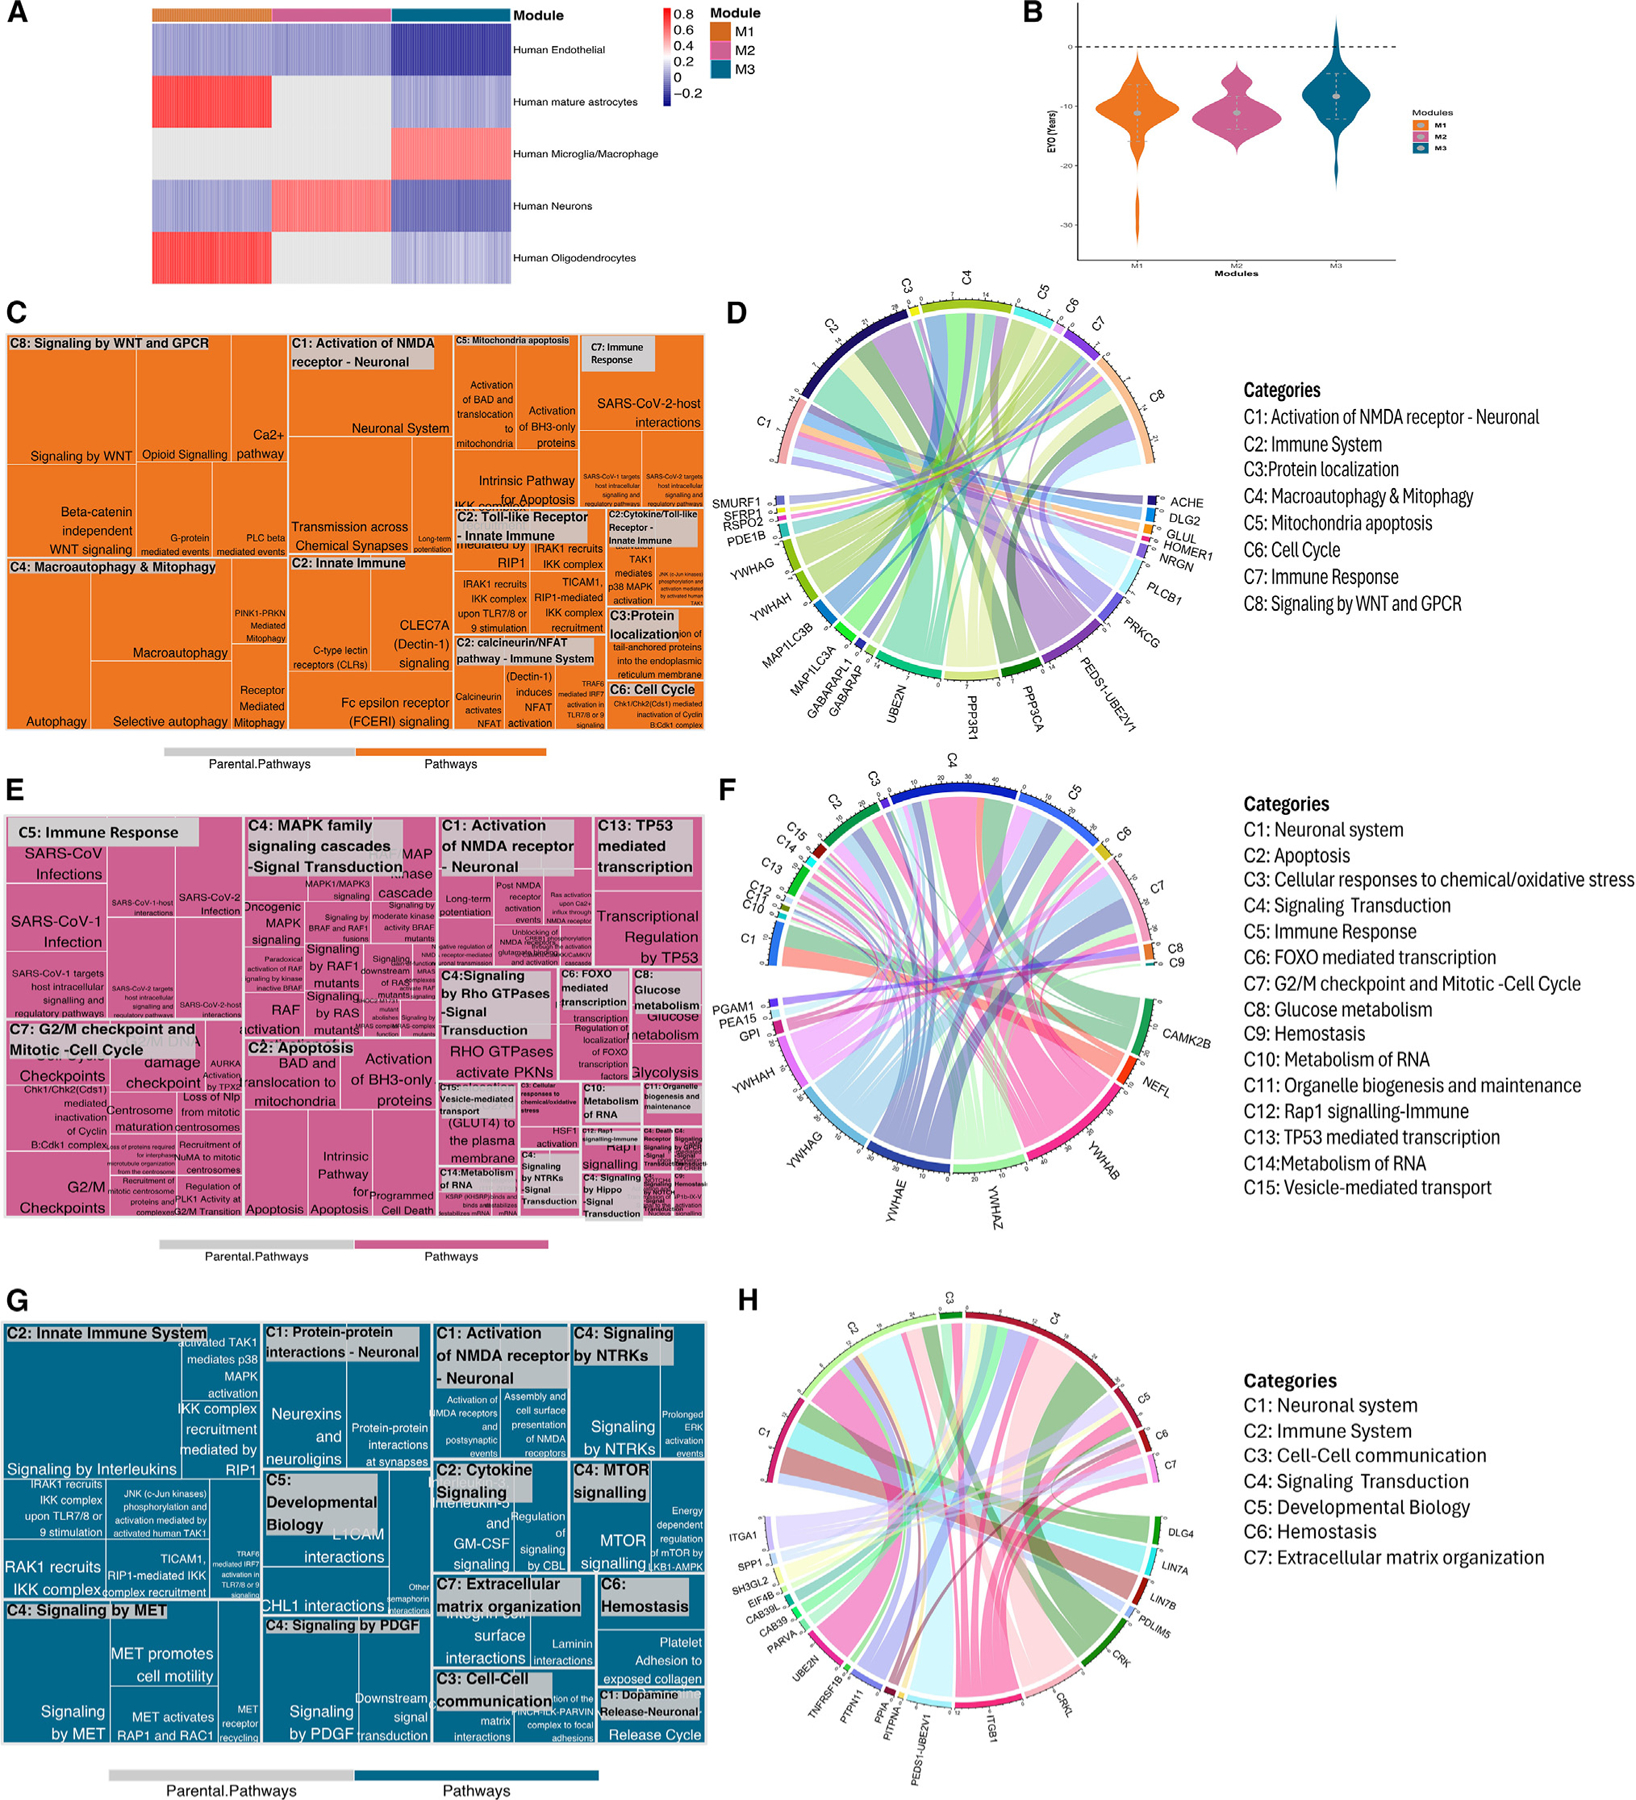
Figure 4. Co-expression network analysis of significant pseudo-trajectory proteins and pathway enrichment for each module.

(A) Heatmap showing GSVA scores for each cell type across modules. Higher GSVA score is shown in red, highlighting an enrichment for that cell type within the module, whereas lower GSVA scores, represented in blue, show depletion. Gray color indicates that the module did not have any genes/proteins associated with the cell type.
(B) EYO comparison for functional identified proteins from Reactome pathway analysis.
(C–H) Reactome pathway analysis for each module. Treemap (C, E, and G) represents the significantly enriched pathways with summarized categories (C#, such as C1); chord diagram (D, F, and H) shows the enriched proteins in categorized pathways. The colored patterns labeling proteins represent the different cell types, and the colors are consistent with bar colors in cell-type enrichment (A).
See also Figures S4 and S5.
