Figure 3.
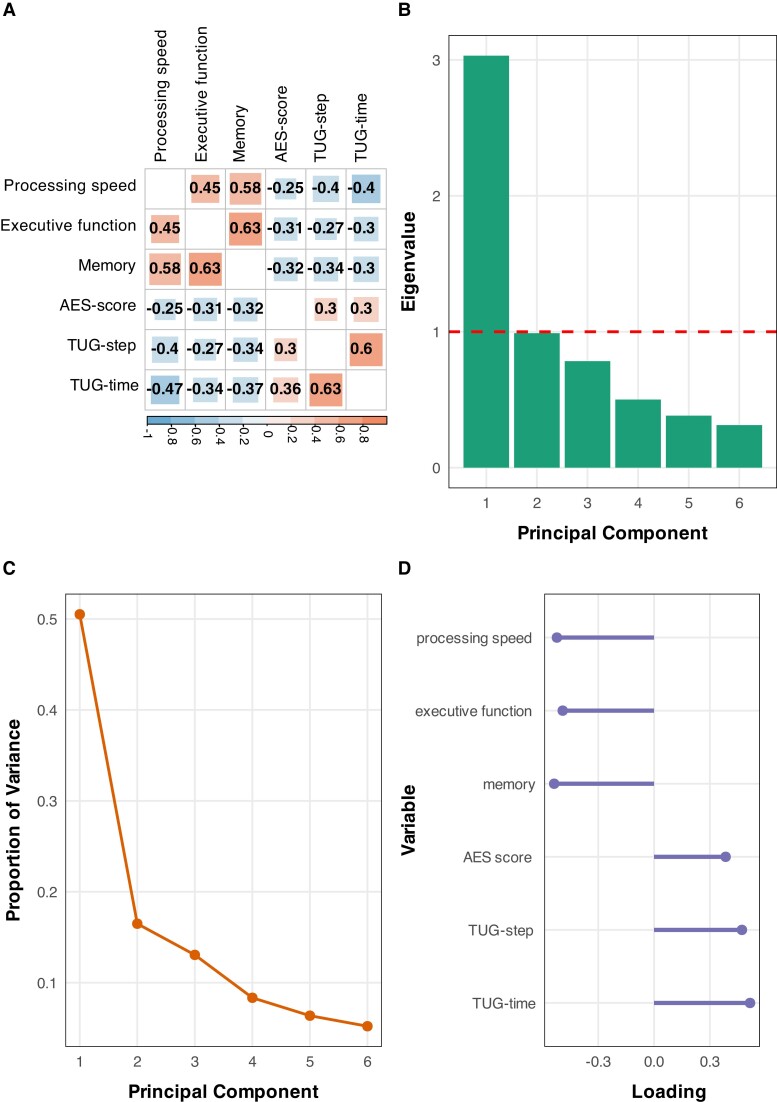
Principal component analysis for the six clinical measures of cognition, apathy and gait. (A) Inter-correlation analyses among six clinical measures. Numbers within squares represent correlation coefficients (P-corrected <0.05); P-values were corrected using the Bonferroni method. (B) Eigenvalue of each principal component analysis (PCA)-derived PC. The PC with an eigenvalue value >1 (red line) was preserved. (C) The proportion of variance explained by any given PC. (D) The factor loading of each original clinical measure to the preserved PC (i.e. the first PC, PC1). AES = Apathy Evaluation Scale; TUG = Timed Up and Go test.

