

Abstract
Compensatory mechanisms in Parkinson’s disease are defined as the changes that the brain uses to adapt to neurodegeneration and progressive dopamine reduction. Motor compensation in early Parkinson’s disease could, in part, be responsible for a unilateral onset of clinical motor signs despite the presence of bilateral nigrostriatal degeneration. Although several mechanisms have been proposed for compensatory adaptations in Parkinson’s disease, the underlying pathophysiology is unclear.
Here, we investigate motor compensation in Parkinson’s disease by investigating the relationship between clinical signs, dopamine transporter imaging data and neurophysiological measures of the primary motor cortex (M1), using transcranial magnetic stimulation in presymptomatic and symptomatic hemispheres of patients. In this cross-sectional, multicentre study, we screened 82 individuals with Parkinson’s disease. Patients were evaluated clinically in their medication OFF state using standardized scales. Sixteen Parkinson’s disease patients with bilateral dopamine transporter deficit in the putamina but unilateral symptoms were included. Twenty-eight sex- and age-matched healthy controls were also investigated. In all participants, we tested cortical excitability using single- and paired-pulse techniques, interhemispheric inhibition and cortical plasticity with paired associative stimulation. Data were analysed with ANOVAs, multiple linear regression and logistic regression models. Individual coefficients of motor compensation were defined in patients based on clinical and imaging data, i.e. the motor compensation coefficient. The motor compensation coefficient includes an asymmetry score to balance motor and dopamine transporter data between the two hemispheres, in addition to a hemispheric ratio accounting for the relative mismatch between the magnitude of motor signs and dopaminergic deficit.
In patients, corticospinal excitability and plasticity were higher in the presymptomatic compared with the symptomatic M1. Also, interhemispheric inhibition from the presymptomatic to the symptomatic M1 was reduced. Lower putamen binding was associated with higher plasticity and reduced interhemispheric inhibition in the presymptomatic hemisphere. The motor compensation coefficient distinguished the presymptomatic from the symptomatic hemisphere. Finally, in the presymptomatic hemisphere, a higher motor compensation coefficient was associated with lower corticospinal excitability and interhemispheric inhibition and with higher plasticity.
In conclusion, the present study suggests that motor compensation involves M1–striatal networks and intercortical connections becoming more effective with progressive loss of dopaminergic terminals in the putamen. The balance between these motor networks seems to be driven by cortical plasticity.
Keywords: Parkinson’s disease, cortical plasticity, dopamine transporter compensatory mechanisms
Passaretti, Cilia et al. explore motor compensation in early Parkinson's disease with unilateral motor signs but bilateral loss of dopaminergic terminals, and find that cortical associative plasticity can counteract dopaminergic terminal loss and help maintain normal motor function.
See Ballanger et al. (https://doi.org/10.1093/brain/awae328) for a scientific commentary on this article.
See Ballanger et al. (https://doi.org/10.1093/brain/awae328) for a scientific commentary on this article.
Introduction
Idiopathic Parkinson’s disease (PD) is a pathological condition characterized by the degeneration of dopaminergic neurons within the substantia nigra pars compacta.1 From a clinical point of view, one of the main features of PD natural history is the asymmetric onset of motor signs.2 One possible explanation for the asymmetric clinical presentation of PD relies on the physiological reorganization of corticostriatal projections as a consequence of pathological changes.3,4 In this regard, some abnormalities of the primary motor cortex (M1) and its output projections have been described in PD,5 but their pathophysiological role is not fully known. Above all, the question is whether changes in cortical activity influence the unilateral onset of PD symptoms and the disease progression6 and whether changes in cortical activity reflect striatal degeneration1,2 or are compensatory mechanisms, i.e. resilience mechanisms of the brain coping with neurodegeneration.7
The hypothesis that motor compensatory mechanisms in PD reflect adaptations of motor networks despite the increasing neurodegenerative burden possibly explains the asymmetric presentation of motor signs, regardless of the similar extent of loss of nigrostriatal terminals.8,9 Mechanisms of motor compensation in PD are still largely unknown. Using the transcranial magnetic stimulation (TMS) technique, it has been hypothesized that the increased corticospinal excitability and the reduced intracortical inhibition,10-14 together with the increased M1 long-term potentiation-like plasticity in PD might be compensatory changes to the abnormal input that M1 receives from the subcortical structures.4,15-19 Although some previous studies have compared the less affected with the more affected hemisphere, aiming to investigate mechanisms of compensation in PD, none of these studies examined motor asymmetry or a possible relationship between neurophysiological changes in cortical motor areas and nigrostriatal density using dopamine transporter (DAT) imaging.4,7,10,18,20,21
The aim of the present study is to identify possible neurophysiological markers of cortical motor compensation by investigating PD patients with unilateral clinical motor signs but evidence of loss of bilateral nigrostriatal terminals. We hypothesize that the lack of motor signs in the presymptomatic hemisphere despite bilateral nigrostriatal denervation is attributable to active compensatory mechanisms. To support our hypothesis, we also calculate individual coefficients of motor compensation in patients using clinical and imaging data, i.e. the motor compensation coefficient (MCC), which represents the brain hemispheric coping response in the face of dopaminergic neurodegeneration.
Materials and methods
Participants
We screened 82 patients aged 40–80 years with clinically defined PD according to established criteria22 who underwent DAT imaging during the period from 15 May 2022 to 15 September 2022 at the Parkinson and Movement Disorders Unit, Department of Clinical Neurosciences, Fondazione IRCCS Istituto Neurologico Carlo Besta, Milano, Italy and the Department of Human Neurosciences, Sapienza University of Rome, Italy. We excluded patients with dementia according to The Diagnostic and Statistical Manual of Mental Disorders, Fifth Edition (DSM-V) criteria,23 previous head trauma and history of anti-dopaminergic drug intake. From the original sample of PD patients, we selected only those who had unilateral motor signs but bilateral reduction of striatal DAT binding values (details about imaging and clinical criteria provided below are depicted in Fig. 1). A total of 16 PD were enrolled (Table 1). We included 28 age- and sex-matched healthy control subjects who had no signs of parkinsonism, no first- and second-degree relatives with PD and dementia according to DSM-V criteria, previous head trauma or history of intake of anti-dopaminergic drugs. All subjects were right-handed as evaluated by the handedness questionnaire24; 8 of 16 patients with PD (50%) had a right symptomatic side. Patients were tested after ≥24 h of washout of all dopaminergic medications, in the practically defined medication OFF condition.25 The experimental procedures, which adhered to the Declaration of Helsinki regulations and to international safety guidelines,26,27 were approved by the local Ethics Committee (CE no. 59/2020). All the participants gave their written informed consent to the study and video recording.
Figure 1.

Screening and selection of Parkinson’s disease patients. The initial cohort of 82 subjects had already been screened for other clinical exclusion criteria. DAT = dopamine transporter; MDS-UPDRS = Movement Disorder Society-sponsored revision of the Unified Parkinson’s Disease Rating Scale; PD = Parkinson’s disease.
Table 1.
Demographic and clinical data of patients with Parkinson’s disease and healthy controls
| Parameter | PD | HC | P-value |
|---|---|---|---|
| Age, years | 58.1 ± 8.8 | 63.9 ± 11.02 | 0.159 |
| Sex, female/male | 8/8 | 14/14 | 0.824 |
| Disease duration, months | 38.2 ± 20.6 | – | – |
| MDS-UPDRS I | 4.9 ± 2.7 | – | – |
| MDS-UPDRS II | 3.9 ± 2.3 | – | – |
| MDS-UPDRS IV | 0.0 | – | – |
| MDS-UPDRS | 25.6 ± 5.4 | – | – |
| LEDD | 260.6 ± 138.7 | – | – |
Results are shown as mean values ± 1 SD; P-values are by unpaired, two-tailed t-tests. HC = healthy controls; LEDD = L-DOPA equivalent daily dose; MDS-UPDRS = Movement Disorder Society-sponsored revision of the Unified Parkinson’s Disease Rating Scale; PD = Parkinson’s disease.
Dopamine transporter imaging
DAT values were measured using single photon computed tomography (SPECT) with 123I-N-ω-fluoropropyl-2β-carbomethoxy-3β-(4-iodophenyl) tropane (FP-CIT), performed according to a previously published protocol.28 DAT SPECT images were evaluated using DATQUANT software, which reconstructed all SPECT data with the same algorithm and filter parameters as those used for the normal database and performed a volume-of-interest determination of radiotracer binding in different regions of the striatum bilaterally. An area in the occipital cortex served as the background region. The quantified regions include the striatum, caudate, putamen and posterior putamen. For each region, the striatal binding ratio (difference in mean counts between the region and background divided by the mean background counts), percentage deviation from the age-matched mean of the normal database, z-score and the age-matched mean value from the normal database are presented. Age-matching to the normal database was done on a pooled mean, matched for patients <55 years of age and >55 years of age. The normal database includes 118 healthy volunteers (no diagnosis of parkinsonism nor first-degree family history of PD or dementia), including 73 males and 45 females, aged from 31 to 84 years, who contributed to the Parkinson’s Disease Progression Markers Initiative.29
Reduced DAT binding in the putamen is an early biomarker of nigrostriatal neurodegeneration, followed by later involvement of the caudate nucleus. DAT density was considered significantly reduced when putamen z-score < −1.0,30 and patients were included if putaminal DAT density was reduced bilaterally. According to this imaging criterion, 14 PD patients were excluded because of a putamen z-score ≥ −1.0 on the less affected hemisphere (Fig. 1). To confirm the significant reduction of DAT density in all patients, as a sensitivity analysis we studied the posterior putamen as an earlier marker of PD.30
The asymmetry index (AI) of dopaminergic binding in the putamen was calculated separately as the z-score (AIz), which was computed using the following formula31:
Namely, the AIz corresponds to the absolute value of the ratio considering the difference of putaminal z-score between the symptomatic and asymptomatic body sides () as the numerator and the mean z-score between the two sides () as the denominator.
Clinical evaluation
Clinical work-up in the 16 selected PD patients included the Movement Disorder Society revision of the Unified Parkinson's Disease Rating Scale (MDS-UPDRS)32,33 and the Hoehn and Yahr34 stage. The clinical assessment was performed by a neurologist blinded to the experimental procedures. The MDS-UPDRS-III (rigidity items excluded) was video-recorded (after obtaining the patient’s consent to video) and assessed by a second blinded neurologist, both experienced in movement disorders. Based on previous studies on subtle parkinsonism in healthy subjects,21,35 we adjusted the minimum UPDRS cut-off to MDS-UPDRS, multiplying by the weighting factor (which is a validated formula that is widely used to recalculate UPDRS scores into MDS-UPDRS equivalents).36 Accordingly, an MDS-UPDRS-IIIside (considering all the lateralized items) score of <3.0 was considered as not indicative of parkinsonism. This approach is in line with previous studies using kinematic data, showing that MDS-UPDRS motor scores on bradykinesia items of <3.0 are not able to differentiate PD from healthy controls.37,38 According to this clinical criterion, 47 subjects were excluded because MDS-UPDRS-III ≥ 3 on the less affected body side (Fig. 1).
The asymmetry in motor scores was quantified on first-rater data with an AI, as follows31,39:
namely, the absolute value of the ratio of the difference of MDS-UPDRS motor scores between the symptomatic and asymptomatic body sides () and the mean of MDS-UPDRS-III scores () of the two sides.
TMS techniques and EMG recordings
TMS was performed on the 16 enrolled PD patients and on the 28 healthy controls. Single- and paired-pulse TMS was delivered using two Magstim magnetic stimulators (Magstim Company) connected to a figure-of-eight-shaped coil, with the intersection of the coil held tangentially to the scalp and the coil handle positioned at an angle of ∼45° from the midline, pointing backwards. We initially defined the bilateral hotspot of the abductor pollicis brevis muscle, i.e. the optimal scalp position to elicit motor evoked potentials (MEPs) of maximal amplitude in the muscle. We then determined the resting and active motor thresholds (RMT and AMT) to the nearest 1% of the maximal stimulator output.26,27 We measured the MEP input–output (I/O) curve to investigate M1 excitability, with 30 single-pulse stimuli in groups of 10 at three stimulation intensities, at 100%, 120% and 140% of RMT. The order of intensities was chosen randomly to avoid possible hysteresis effects.40
We assessed short-interval intracortical inhibition (SICI) and intracortical facilitation (ICF) using paired-pulse TMS with a subthreshold conditioning stimulus (80% RMT) and a suprathreshold test stimulus (1 mV MEP) with an interstimulus interval (ISI) between conditioning stimulus (CS) and test stimulus (TS) of 2 ms for SICI and 10 ms for ICF.27,41-43 Ten trials were acquired for each ISI.
We used the paired-pulse TMS to measure interhemispheric inhibition (IHI) between the hand areas of the two M1 bilaterally.21,44-46 The CS was administered over the abductor pollicis brevis hotspot at two different ISIs [10 ms, short-IHI (s-IHI); 40 ms, long-IHI (l-IHI)] before the TS. The TS was administered over the contralateral abductor pollicis brevis hotspot at a random frequency and at an intensity able to induce MEPs of ∼1 mV amplitude. Fifteen trials for each ISI were collected. The IHI was expressed as the percentage ratio between the unconditioned and conditioned MEP. The IHI was recorded at two ISIs to test different interhemispheric projections mediated by different populations of γ-aminobutyric acid (GABA)ergic inhibitory neurons.47
To study cortical plasticity, paired associative stimulation (PAS) was delivered bilaterally over M1 in patients and over the dominant hemisphere in healthy controls.4,18,41,43,48 PAS was composed of 200 electrical stimuli, delivered to the median nerve at the wrist by means of a Digitimer DS7 (Digitimer), paired with TMS stimuli (adjusted to 1 mV MEP intensity), delivered over the contralateral abductor pollicis brevis hotspot (rate 0.25 Hz, electrical stimulation intensity two to three times the perceptual sensory threshold). The electrical conditioning stimulus preceded each TMS stimulus at an ISI of 21.5 ms.49 During PAS, participants were instructed to look at their hand and to report every 20th peripheral electrical stimulus in their sensory perception to ensure constant attention levels and comparable conditions between sessions.41,43 Changes in M1 excitability were registered at three time points: T1 (5 min after PAS), T2 (15 min after PAS) and T3 (30 min after PAS). The same protocol was repeated for the other side. Twenty MEPs were recorded at 1 mV intensity at each measurement time point (including T0).
EMG activity was recorded from the abductor pollicis brevis muscle of the more affected side in patients and of the dominant side in healthy controls, using surface electrodes taped in a belly–tendon montage, according to an established method.41 Peak-to-peak MEP amplitude was measured within a time window of 20–40 ms after the TMS artefact. Traces with background EMG activity exceeding 100 µV in the 200 ms time window preceding the TMS artefact were rejected online.
The steepness of the I/O MEP curve, i.e. the slope of the regression line across the scatterplot of the MEP amplitude (y-axis) versus the stimulation intensity (x-axis) was calculated. SICI, ICF and IHI were expressed as the percentage ratio between the amplitude of conditioned and unconditioned MEP. The steepness of the intracortical excitability curve, i.e. the slope of the regression line across the scatterplot of the MEP amplitude percentage ratios (y-axis) versus the ISI (x-axis), was calculated. The PAS effect was measured as the normalized percentage ratio of post-PAS single-pulse MEP amplitude to pre-PAS values.41
For the TMS assessment, one hemisphere was tested after the other, with between-subject randomization of the symptomatic and the presymptomatic hemispheres and with single- and paired-pulse randomization.
Motor compensation coefficient
We developed an ad hoc novel MCC (Fig. 2), including clinical and imaging data, as an attempt to quantify motor compensation and its correlation with neurophysiological data. Our concept of the MCC integrated the following observations.
Figure 2.

Graphical representation of motor compensatory coefficient. The MCC is composed of an asymmetry score (left side of the formula) to balance motor and DAT measures between the two hemispheres, and a hemispheric ratio (right side of the formula) accounting for the relative mismatch between the magnitude of motor signs and dopaminergic deficit. Coloured bars generally applied for individual DAT tracer binding are used for graphical purposes only to represent z-scores. Left: Example case of mild motor compensation on the presymptomatic side, with high putamen binding asymmetry, attributable to higher putamen binding in the presymptomatic hemisphere. Right: Example case of high motor compensation, with lower putamen asymmetry, higher clinical asymmetry, lower presymptomatic putamen binding, but still no motor symptoms on the presymptomatic body side. AIM = motor asymmetry index; AIZ = putamen z-score asymmetry index; DAT = dopamine transporter; Mside = motor score of reference side; MCC = motor compensatory coefficient; Zside = putamen z-score of reference side; ΔM = difference of motor scores.
The first part of the MCC formula is an asymmetry score, based on the evidence that the more the striatum is denervated, the more the compensatory mechanisms are necessary to maintain a physiological motor performance,50 whereas the failure to compensate for the reduction in nigrostriatal terminals results in the onset of motor symptoms. Nevertheless, greater clinical asymmetry corresponds to greater motor compensation on the presymptomatic side when the putamen binding is bilaterally reduced. These observations lead to the following formula: (i) numerator = the elevated to the ratio between and its absolute value (accounting for clinical asymmetry); and (ii) denominator = . The second part of the MCC formula is a specific hemispheric ratio, accounting for the relative mismatch between the magnitude of motor signs and dopaminergic deficit. Lower MDS-UPDRS-III scores () indicate higher compensation when the contralateral DAT binding is constant (corresponding to putaminal z-score, ); conversely, greater DAT reduction indicates higher compensation when the motor score () is constant. This relationship is expressed in the hemispheric ratio: (i) numerator = absolute values of ; and (ii) denominator = logarithm of (adjusting for the different range of the two variables).
Logistic regression was used to confirm that MCC was able to distinguish the presymptomatic hemisphere from the symptomatic hemisphere as a logistic variable. Sensitivity, specificity, accuracy and the area under the curve (AUC) of the receiver operating characteristic analysis were calculated using the logistic model. A bootstrapping method with 2000 repetitions was used to estimate the 95% confidence interval (CI). Multivariate linear regression analysis was performed to demonstrate which neurophysiological variables were associated with higher MCC (dependent variable).
Statistical analyses
Descriptive statistics of continuous variables are reported as the mean and standard deviation (SD), whereas categorical variables are presented as counts and percentages. Possible sex or age differences between PD patients and healthy controls were assessed using the χ2 test and the Mann–Whitney U-test, respectively. Group comparisons on clinical variables and motor thresholds between symptomatic and presymptomatic hemispheres were performed with two-tailed paired t-tests, and comparisons between patients’ hemispheres and healthy controls were performed using two-tailed unpaired t-tests. Different neurophysiological variables were evaluated in separate analysis. TMS parameters between PD and healthy controls were evaluated using a repeated-measures two-way ANOVA, with the between-group factor ‘hemisphere’ (presymptomatic, symptomatic, and healthy controls). In all repeated-measures two-way ANOVAs we also used: (i) the within-group factor ‘stimulus intensity’ (100%, 120% and 140% RMT) for analysis of I/O curves; (ii) the within-group factor ‘ISI’ (10 and 40 ms) for IHI evaluation; and (iii) the within-factor ‘time point’ (T1, T2 and T3) when evaluating the effects of PAS. We also applied separate one-way ANOVAs for and I/O MEP slope and for SICI, ICF and intracortical excitability slope (PP slope). Conditional on a significant F-value, to explore the strength of main effects and/or interaction between factors in all ANOVAs we used post hoc Fisher’s test and follow-up ANOVAs. Greenhouse–Geisser corrections were applied whenever we found a violation of sphericity in Mauchly’s tests. Different multivariate linear regression analyses were performed to determine whether MDS-UPDRS-IIIside and DAT parameters (dependent variables) were associated with neurophysiological measures. Predictive variables were selected through a stepwise method. Regression models were run separately on the overall sample and for the two hemispheres (presymptomatic and symptomatic). Unless otherwise stated, the results are indicated as mean values ±1 SD. The level of significance was thus set at P < 0.05. All the analyses were performed with the software STATISTICA® (StatSoft) and implemented in R v.4.2.2 (R Foundation for Statistical Computing).
Results
Demographic and clinical data are summarized in Tables 1 and 2. As for inclusion criteria, all patients included in the study had bilateral denervation at DAT imaging 123I-FP-CIT binding, with putamen z-scores of <−1.0 [(min, max); presymptomatic, (−3.229, −1.327); symptomatic, [(−3.727, −1.310)], and DAT binding in the posterior putamen demonstrated marked nigrostriatal denervation [(min, max); presymptomatic, (−5.07, −2.03); symptomatic, (−5.35, −1.91)] (Table 2).
Table 2.
Clinical and dopamine transporter imaging data in presymptomatic and symptomatic hemispheres of Parkinson’s disease patients
| Parameter | Symptomatic | Presymptomatic | P-value |
|---|---|---|---|
| Side, right/left | 8/8 | 8/8 | – |
| MDS-UPDRSIIIside, rater I | 9.7 ± 2.4 | 0.6 ± 0.6 | <0.001 |
| MDS-UPDRSIII-wrside, rater I | 8.5 ± 2.9 | 0.6 ± 0.6 | <0.001 |
| MDS-UPDRSIII-wrside, rater II | 9.4 ± 3.2 | 0.9 ± 1.0 | <0.001 |
| Inter-rater | 0.458 | 0.324 | – |
| MDS-UPDRSIIITOT, rater I | 16.8 ± 3.3 | – | – |
| MDS-UPDRSIII-wrTOT, rater I | 15.1 ± 3.6 | – | – |
| MDS-UPDRSIII-wrTOT, rater II | 17.2 ± 3.7 | – | – |
| Inter-rater | 0.165 | – | – |
| Striatum z-score | −2.378 ± 0.794 | −1.671 ± 0.711 | <0.001 |
| Putamen z-score | −2.902 ± 0.630 | −2.230 ± 0.565 | 0.003 |
| Posterior putamen z-score | −3.386 ± 1.655 | −2.756 ± 1.644 | 0.289 |
| Caudate z-score | −1.243 ± 1.046 | −0.580 ± 0.896 | 0.001 |
| Putamen/caudate ratio | 0.664 ± 0.187 | 0.716 ± 0.066 | 0.276 |
Results are shown as mean values ± 1 SD. P-values are by paired, two-tailed t-tests; significant results are shown in bold. MDS-UPDRS = Movement Disorder Society-sponsored revision of the Unified Parkinson’s Disease Rating Scale; TOT = total mesures referred to general MDS-UPDRSIII scores; wr = without rigidity.
MDS-UPDRS = Movement Disorder Society-sponsored revision of the Unified Parkinson’s Disease Rating Scale; TOT = total mesures referred to general MDS-UPDRSIII scores; wr = without rigidity.
No significant difference in ratings was evident between the two raters in the evaluation of MDS-UPDRS-III and for the partial scores of the presymptomatic and the symptomatic sides. As expected, there was a significant difference in MDS-UPDRS-IIIside scores between the presymptomatic and the symptomatic body side in PD patients attributable to higher scores on the more affected side (P < 0.001) (Table 2). Missing data were <10% for each subject included.
TMS measures
Corticospinal excitability: motor thresholds and I/O curve
The analyses did not reveal any differences in RMT and AMT between hemispheres in patients with PD nor between patients and healthy controls (Supplementary Table 1). Concerning the I/O curve, the two-way ANOVA yielded a significant effect of the main factor ‘stimulus intensity’ [F(2,106) = 75.0, P < 0.001], with an increasing MEP amplitude at higher stimulation intensity. Corticospinal excitability analysis also showed a significant effect of the main factor ‘Group’ [F(2,53) = 9.9, P < 0.001] and interaction ‘Group × Stimulus intensity’ [F(4,106) = 6.7, P < 0.001] (Fig. 3A). Post hoc analyses demonstrated greater corticospinal excitability in both presymptomatic and symptomatic hemispheres and M1 of patients compared with healthy controls, at 120% (presymptomatic hemisphere versus healthy control, P = 0.008; symptomatic hemisphere versus healthy control, P = 0.025) and 140% of RMT (presymptomatic hemisphere versus healthy control, P < 0.001; symptomatic hemisphere versus healthy control, P < 0.001). A significant difference was found at 140% of RMT, with higher MEP amplitude values being observed in the presymptomatic compared with the symptomatic hemisphere in patients (P = 0.007). Accordingly, the ANOVA also demonstrated a significant effect of the main factor ‘group’ on the slope of the I/O curve [F(2,84) = 7.2, P = 0.002]. Post hoc analyses demonstrated that the I/O curve was steeper in the presymptomatic hemisphere compared with the symptomatic hemisphere (P = 0.025) and with the healthy controls (P < 0.001).
Figure 3.

Neurophysiological measures. In each panel are depicted neurophysiological data of symptomatic (light blue) and presymptomatic (intermediate blue) hemispheres of patients with PD and of healthy controls (HCs) (dark blue). Boxes represent the median value and the interquartile interval; lower and upper extremes are settled at 1.5 interquartile intervals under the first and over the third quartile, respectively. Dots are single data-points exceeding the upper and lower limits. The significance of post hoc analyses is represented by bars indicating the comparison, and asterisks indicate the level of significance (*P < 0.05, **P < 0.01 and ***P < 0.001). (A) Input–output curve of MEPs at baseline. The y-axis shows the MEP amplitudes (in millivolts); the x-axis shows the three stimulation intensities (100%, 120% and 140% of resting motor threshold). (B) ICF and SICI at baseline. The y-axis shows the percentage ratio between conditioned and unconditioned MEP amplitudes; the x-axis shows the ISIs. (C) Interhemispheric inhibition at baseline. The y-axis shows the percentage ratio between conditioned and unconditioned MEP amplitudes; the x-axis shows the two ISIs (D) Effect of PAS on corticospinal excitability. The y-axis shows the percentage ratio between conditioned and unconditioned MEP amplitudes. The x-axis shows T1 = 5 min post PAS; T2 = 15 min post PAS; T3 = 30 min post PAS. ICF = intracortical facilitation; IHI = interhemispheric inhibition; ISIs = interstimulus intervals; MEP = motor evoked potential; PAS = paired associative stimulation; PD = Parkinson’s disease; SICI = short-interval intracortical inhibition.
Intracortical excitability: SICI/ICF
The analyses demonstrated a significant effect of the factor ‘group’ in intracortical inhibition [F(2,47) = 4.4, P = 0.018]. SICI was lower in the symptomatic hemisphere compared with both the presymptomatic hemisphere (P = 0.006) and healthy controls (P = 0.041), with no significant difference observed between the presymptomatic hemisphere and healthy controls (Fig. 3B). ICF was reduced [F(2,47) = 8.0, P = 0.001] in both the presymptomatic (P = 0.003) and the symptomatic (P < 0.001) hemispheres compared with healthy controls (Fig. 3B). No difference was found between the symptomatic and presymptomatic hemispheres.
As a result of reduced inhibition and reduced facilitation, the slope of intracortical excitability [F(2,47) = 11.46, P < 0.001] was significantly reduced in both the presymptomatic (P = 0.005) and the symptomatic (P < 0.001) hemispheres of PD patients compared with healthy controls (Fig. 3B).
Interhemispheric inhibition
We found a significant effect of the factor ‘Group’ [F(2,49) = 3.9, P = 0.036]. Specifically, the symptomatic hemisphere demonstrated reduced l-IHI compared with healthy controls (P = 0.014) and with the presymptomatic hemisphere (P = 0.011), whereas no difference was observed between the presymptomatic hemisphere and healthy controls (Fig. 2C). Short-IHI did not differ between the three groups.
Cortical associative plasticity
Two-way ANOVA revealed that the effect of PAS was different between groups [F(2,47) = 6.4, P < 0.001]. The presymptomatic hemisphere had a larger response to PAS than the symptomatic one [F(1,30) = 7.3, P = 0.012], and this effect was statistically significant at T2 (P = 0.012). However, the PAS effect did not differ between the presymptomatic hemisphere in PD patients and healthy controls. In contrast, the symptomatic hemisphere exhibited a reduced response to PAS compared with healthy controls [F(1,32) = 17.75, P < 0.001], with this reduced response being observed at every time point (T1, P < 0.001; T2, P < 0.001; T3, P = 0.037; Fig. 3D).
Multivariate linear regression analyses
Four multiple linear regression analysis models were obtained to predict MDS-UPDRS-IIIside, putamen z-score, caudate z-score and putamen/caudate ratio with neurophysiological variables (Supplementary Table 2).
The multiple regression model for MDS-UPDRS-IIIside considered the I/O curve and l-IHI as independent variables. It evidenced an overall direct effect of l-IHI [adjusted R2 (adj-R2) = 0.321, l-IHI: b = 0.46, P = 0.011] and a direct effect on the symptomatic side of the I/O curve (adj-R2 = 0.340, RMT140: b = 0.65, P = 0.038); it was not associated with the presymptomatic side (adj-R2 = 0.167, P = 0.183).
The multiple regression model for putamen z-score considered l-IHI, ICF and PAS as independent variables. It demonstrated an effect of l-IHI and PAS on the presymptomatic hemisphere (adj-R2 = 0.510, l-IHI: b = −0.75, P = 0.003; PAS T1: b = −0.45, P = 0.044) and a significative effect of ICF on the symptomatic hemisphere (adj-R2= 0.528, ICF: b = 0.86, P = 0.001).
The multiple regression model for the caudate z-score considered PAS as the independent variable and demonstrated a direct effect on the symptomatic side (adj-R2 = 0.280, PAS T1: b = 0.57, P = 0.020).
Multiple regression for the putamen/caudate ratio considered the I/O curve and PAS as independent variables. It showed an overall effect of corticospinal excitability and cortical plasticity (adj-R2 = 0.404, RMT140: b = 0.60, P = 0.001; PAST1: b = −0.524, P = 0.002), an effect on the presymptomatic side of corticospinal excitability (adj-R2 = 0.221, RMT140: b = 0.62, P = 0.028), and on symptomatic side a significative effect of corticospinal excitability and PAS (adj-R2 = 0.544, RMT140: b = 0.39, P = 0.046; PAST1: b = −0.59, P = 0.005).
In summary, higher scores of MDS-UPDRS-III were associated with higher corticospinal excitability in the symptomatic hemisphere. The reduction in putamen binding was associated with higher PAS and lower IHI in the presymptomatic hemisphere and lower ICF in the symptomatic hemisphere. The reduction in caudate binding was associated with a reduction of PAS in the symptomatic hemisphere. Finally, relatively higher putamen binding (i.e. higher putamen/caudate ratio) was associated with higher corticospinal excitability in both hemispheres of patients. An inverse association was also evidenced between cortical associative plasticity and putamen/caudate binding ratio, especially in the symptomatic hemisphere.
Motor compensation coefficient
As expected, the MCC was highly sensitive (93.75%, 95% CI: 0.813–1) and specific (93.75%, CI: 0.813–1) in the classification of the hemisphere as symptomatic or presymptomatic as evidenced by the area under the receiver operating characteristic curve = 0.984 (95% CI: 0.941–1) and an accuracy of 93.75% (95% CI: 0.813–1) (Fig. 4). High classification rates were confirmed by an adjunctive analysis not accounting for tremor items of MDS-UPDRS in the calculation of MCC (area under the receiver operating characteristic curve = 1.000, 95% CI: 1–1).
Figure 4.
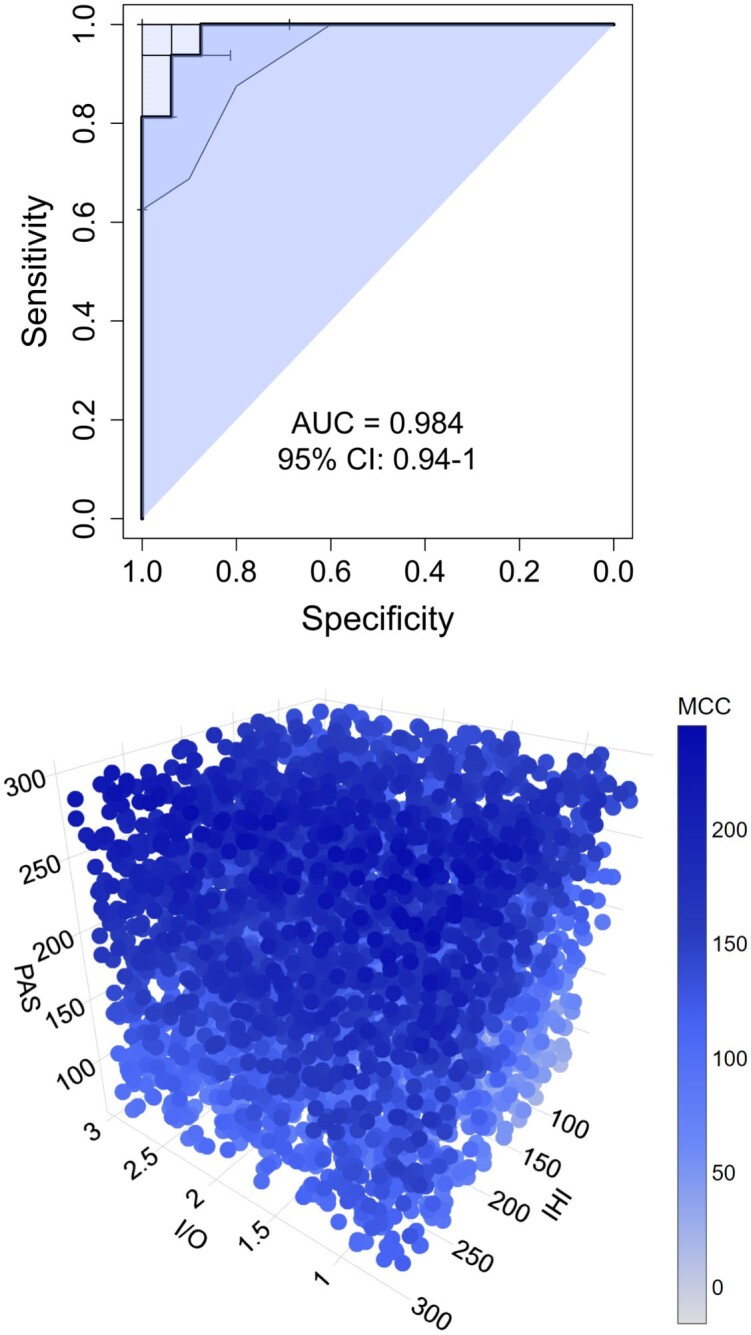
Motor compensation coefficient. The top panel represents the area under the receiver operating characteristic curve of the motor compensation coefficient. The bottom panel represents a three-dimensional scatterplot of linear regression between neurophysiological parameters (I/O = input–output curve; IHI = interhemispheric inhibition; PAS = cortical associative plasticity) and the values of the motor compensation coefficient (MCC) (blue bar) in the presymptomatic hemisphere. AUC = area under the curve; CI = confidence interval.
A multiple regression model was obtained to analyse neurophysiological associations for MCC (Fig. 4 and Supplementary Table 3). It considered the I/O curve, PAS and l-IHI as independent variables. It evidenced an overall significant effect of PAS (adj-R2 = 0.349, PAST2: b = 0.73, P < 0.001) and significant association of I/O curve, l-IHI and PAS on the presymptomatic side (adj-R2 = 0.678, RMT140: b = −0.72, P = 0.003; l-IHI: b = 0.36, P = 0.04; PAST2: b = 1.06, P < 0.001).
Discussion
This study provides new information on motor compensation in PD patients. It is the first neurophysiological investigation of a selected cohort of PD patients with clinically unilateral motor signs and bilateral nigrostriatal denervation as demonstrated by DAT imaging. The presymptomatic M1 demonstrated distinctive neurophysiological features in comparison to healthy controls: namely, we evidenced increased corticospinal excitability. In the symptomatic M1, there was decreased l-IHI and decreased PAS. Conversely, the slope of intracortical excitability was significantly reduced in both the presymptomatic and symptomatic hemispheres of PD patients compared with healthy controls. When we tested the possible relationship between TMS data and quantitative DAT measurements in patients, we observed a direct association between corticospinal excitability and relative putamen binding in both hemispheres of patients. An inverse association was detected between measures of l-IHI and plasticity in the presymptomatic hemisphere and dopaminergic binding in the putamen. Also, we demonstrated an association between cortical plasticity and caudate binding in the symptomatic hemisphere. Finally, the analysis revealed a direct association between increased plasticity in the presymptomatic hemisphere and MCC values, an ad hoc measurement designed to quantify motor compensation. Overall, the results possibly provide neuropsychological evidence of motor compensatory mechanisms in early PD.
Changes in M1 activity reflect dopaminergic denervation of the basal ganglia
One major finding of this study is the evidence of correlation between increased corticospinal excitability and a relatively higher putamen binding (i.e. higher putamen/caudate ratio) in both hemispheres of patients. Another key finding is the observed association between higher levels of cortical plasticity, along with reduced interhemispheric activity in the presymptomatic M1 and reduced binding in the putamen. Interestingly, in the symptomatic hemisphere reduced putamen binding was associated with lower ICF, and reduced caudate binding was associated with lower levels of cortical plasticity. Consistently, we found an inverse association between cortical associative plasticity and putamen/caudate binding ratio, especially in the symptomatic hemisphere. These findings suggest that presymptomatic and symptomatic M1s undergo secondary alterations in response to dopaminergic denervation of the basal ganglia.51-53 These observations align with evidence from animal studies, which have demonstrated that dopamine depletion in the basal ganglia leads to plasticity changes in M1.54,55
The evidence of a correlation between changes in M1 activity and dopaminergic denervation of the basal ganglia provides insight into the pathophysiological role of striatal networks, centred on the putamen and caudate nucleus, possibly suggesting compensatory mechanisms, as also confirmed by MCC analysis (Fig. 5). We explored different corticostriatal networks, considering both M1–striatal mechanisms based on intracortical activity and M1–corticostriatal mechanisms determined by interhemispheric motor projections and cortical associative plasticity networks.
Figure 5.

Graphical representation of major findings of the study. Goal-directed and habitual motor network modifications respond to the reduction in striatal dopamine binding. The cortical neurophysiological response was associated with different striatal binding conditions in the presymptomatic and symptomatic hemispheres, as demonstrated by linear models. In the presymptomatic hemisphere, higher putamen binding was associated with higher M1 corticospinal excitability (habitual putamen–M1 network, enlightened corticoputaminal projections in grey). The reduction in putamen binding in the presymptomatic hemisphere is associated with higher M1 cortical plasticity (goal-directed motor network). In these circumstances, the caudate nucleus exhibits a heightened level of activity compared with the putamen (light blue caudate and corticocaudate networks), and this dominance is correlated with increased levels of associative plasticity (light blue areas and M1–motor associative area networks) and reduced interhemispheric inhibition (dotted blue line between bilateral M1s). The symptomatic hemisphere demonstrates a reduction of cortical plasticity associated with lower caudate binding and a higher putamen/caudate ratio, in keeping with reduced activity of the goal-directed motor network. IHI = interhemispheric inhibition; I/O = input–output curve; M1 = primary motor cortex; PAS = cortical associative plasticity.
Neurophysiological segregation of M1–striatal networks
M1 is the principal source of output controlling skilled and dexterous movements and exhibits somatotopic connectivity to the posterior putamen.3 These connections are involved in the habitual motor network, i.e. in the execution of habitual and learned actions or inhibition of actions.56 Most importantly, corticostriatal projections from M1 regulate striatal dopamine release in animal models and humans,57-60 which relies on a distinct topographic organization. Increased activity in M1 boosts dopamine release in the putamen,61 whereas heightened activity in the prefrontal cortex increases dopamine release in the caudate nucleus.62 Hence, increased M1 excitability might represent a mechanism of motor compensation to promote dopamine release in M1–putamen, contributing to the clinical sparing of the presymptomatic side and in the delay of symptom onset. However, although M1 hyperactivity might initially compensate for impairment progression, it can turn into a stressor with a causative role in PD pathophysiology,2 and its dysregulated activation and reduced specificity exacerbate the corticostriatal motor network imbalance.1,2 This hypothesis, even if consistent with the association with clinical motor impairment, seems unlikely because, if considered valid, we would have expected the I/O curve in the symptomatic hemisphere to be higher than in the presymptomatic one, with a greater difference from healthy controls, whereas our data imply otherwise.
Presymptomatic M1 exhibited normal SICI, whereas symptomatic M1 demonstrated a global reduction of SICI, with a decrease of GABAA interneuron transmission. Conversely, ICF was reduced both in the presymptomatic and symptomatic hemispheres and associated with putamen denervation in the symptomatic hemisphere. Previous observations in PD demonstrated great variability in intracortical excitability, considering both inhibitory and facilitatory measurements.4,10,63-66 We should outline that clinical impairment of the presymptomatic side in our sample of PD patients is less evident compared with other studies that tested a mildly symptomatic side.21,47,48 This might explain the differences observed and the distinct results in our data when comparing measurements from the presymptomatic and symptomatic hemispheres. This might be a case of intracortical inhibition not demonstrating any abnormality in the presymptomatic hemispheres of our patients, as opposed to previous results.10 It seems plausible that both inhibitory and facilitatory circuits are modified in different disease stages.10
These modifications could outline a mechanism of motor compensation contributing to increased M1 output but eventually resulting in a less modulable M1 activity.
Interhemispheric motor projections
The modulation of M1 is influenced further by interhemispheric projections. In the presymptomatic hemisphere, reduction in l-IHI is associated with reduced putamen binding. IHI is a measure of associative bilateral interactions.67 s-IHI and l-IHI rely on distinct anatomical projections and different receptor mechanisms. Specifically, the s-IHI is more exclusively dependent on callosal connections,21,68 whereas the l-IHI is mediated mainly by postsynaptic GABAB receptors, also implying alternative interhemispheric projections.44,47 The absence of significant modifications of s-IHI also in the symptomatic hemisphere outlines the presence of functioning callosal short-term inhibition pathways in the early phases of PD. It is difficult to assess whether modifications in interhemispheric inhibition depend on changes in ipsilateral or contralateral hemisphere activity, although both mechanisms seem to be involved in this neurophysiological process.69 A decrease in l-IHI, indicative of lower inhibition, is correlated with a diminished putamen DAT binding and predicts a higher MCC when symptoms are absent while correlating with motor impairment on the symptomatic side. These observations outline the role of interhemispheric brain projections in modulating the presymptomatic M1 response to dopamine denervation.
Associative plasticity networks and motor adaptation
When considering the association between changes in M1 activity and dopaminergic denervation of the basal ganglia, another relevant finding is that cortical plasticity as assessed by PAS increases with putamen denervation in the presymptomatic hemisphere, and the decline in PAS response is associated with the caudate nucleus denervation in the symptomatic hemisphere. The caudate nucleus receives projections from different cortical associative areas of the network for goal-directed behaviour. M1 associative plasticity might thus reflect the activity of the associative network for goal-directed behaviour, which possibly compensates for the impaired habitual motor network. Previous studies suggest that M1 associative plasticity networks have a compensatory role, which declines over time.70 Different observations, however, correlated the PAS reduction with the severity of major motor symptoms in PD.41,71,72 In addition, the cortical plasticity response to dopaminergic dosages demonstrated an inverted U-shape, with low dopaminergic tone resulting in impairment of plasticity and moderate dose facilitation.73-75 Likewise, our results suggest that the presymptomatic hemisphere plasticity adaptation might contribute to maintaining motor function despite the putamen denervation, as also underlined by the association with MCC.
Limitations and future perspectives
This study was performed in patients with unilateral motor signs, and the results need to be replicated in patients investigated at different stages (e.g. prodromal or advanced disease with bilateral signs). Although our sample of patients is relatively small, it is in line with the majority of previous neurophysiological studies on PD.19 Another potential confounding factor could be the occurrence of meta-plasticity induced by the first PAS protocol on the other hemisphere (tested for the second). We decided to study both hemispheres in the same session to lessen the impact of intraindividual variability in comparing the two hemispheres.76 Moreover, considering the high somatotopy of the PAS effect,77 we do not expect any plasticity modification of M1 induced by application of the PAS protocol on the contralateral hemisphere; nevertheless, to avoid interhemispheric interaction on plasticity measures, we applied a between-subject randomization of the symptomatic and the presymptomatic hemispheres.
Conclusion
We investigated the neurophysiological mechanisms responsible for highly asymmetric motor manifestations with bilateral reduction in DAT binding and found differences in PD hemispheres. Cortical changes to PD neurodegeneration can be explained by the involvement of two main neurophysiological networks. One directly involves the M1–putamen network, which is strongly implicated in the earliest stages of the disease and is responsible for the increased corticospinal excitability. The second involves the M1–caudate networks and cortico-M1 connections responsible for cortical plasticity. The impairment of these networks is correlated with clinical worsening. The balance between these networks leads to motor adaptation, with cortical plasticity playing a key role. Finally, this study provides a new perspective on the interplay between cortical areas and basal ganglia. New insight into the compensatory and dysfunctional motor networks in PD could promote innovative neuromodulatory approaches for therapeutic purposes.
Supplementary Material
Acknowledgements
We are thankful to all participants for their contribution in the study.
Contributor Information
Massimiliano Passaretti, Parkinson and Movement Disorders Unit, Department of Clinical Neurosciences, Fondazione IRCCS Istituto Neurologico Carlo Besta, 20133 Milan, Italy; Department of Human Neurosciences, Sapienza University of Rome, 00185 Rome, Italy; Department of Clinical Neuroscience, Karolinska Institutet, 17165 Solna, Sweden.
Roberto Cilia, Parkinson and Movement Disorders Unit, Department of Clinical Neurosciences, Fondazione IRCCS Istituto Neurologico Carlo Besta, 20133 Milan, Italy.
Sara Rinaldo, Parkinson and Movement Disorders Unit, Department of Clinical Neurosciences, Fondazione IRCCS Istituto Neurologico Carlo Besta, 20133 Milan, Italy.
Davide Rossi Sebastiano, Neurophysiology Unit, Department of Clinical Neurosciences, Fondazione IRCCS Istituto Neurologico Carlo Besta, 20133 Milan, Italy.
Eva Orunesu, Nuclear Medicine Unit, Fondazione IRCCS Cà Granda, Ospedale Maggiore Policlinico, 20122 Milan, Italy.
Grazia Devigili, Parkinson and Movement Disorders Unit, Department of Clinical Neurosciences, Fondazione IRCCS Istituto Neurologico Carlo Besta, 20133 Milan, Italy.
Arianna Braccia, Parkinson and Movement Disorders Unit, Department of Clinical Neurosciences, Fondazione IRCCS Istituto Neurologico Carlo Besta, 20133 Milan, Italy.
Giulia Paparella, Department of Human Neurosciences, Sapienza University of Rome, 00185 Rome, Italy; IRCCS Neuromed, 86077 Pozzilli (IS), Italy.
Martina De Riggi, Department of Human Neurosciences, Sapienza University of Rome, 00185 Rome, Italy.
Thilo van Eimeren, Department of Nuclear Medicine, Faculty of Medicine and University Hospital Cologne, University of Cologne, 50937 Cologne, Germany.
Antonio Paolo Strafella, Krembil Brain Institute, University Health Network, Toronto, ON M5R 1E8, Canada; Campbell Family Mental Health Research Institute, Centre for Addiction and Mental Health, Toronto, ON M5S 2S1, Canada.
Paola Lanteri, Neurophysiology Unit, Department of Clinical Neurosciences, Fondazione IRCCS Istituto Neurologico Carlo Besta, 20133 Milan, Italy.
Alfredo Berardelli, Department of Human Neurosciences, Sapienza University of Rome, 00185 Rome, Italy; IRCCS Neuromed, 86077 Pozzilli (IS), Italy.
Matteo Bologna, Department of Human Neurosciences, Sapienza University of Rome, 00185 Rome, Italy; IRCCS Neuromed, 86077 Pozzilli (IS), Italy.
Roberto Eleopra, Parkinson and Movement Disorders Unit, Department of Clinical Neurosciences, Fondazione IRCCS Istituto Neurologico Carlo Besta, 20133 Milan, Italy.
Data availability
Data are available upon reasonable request to the corresponding author.
Funding
This work was partially supported by the Ministero Italiano della Salute (RRC 2023 for R.C.).
Competing interests
All authors declare no competing interests. R.C. has received speaking honoraria from Zambon Italia; Zambon SAU; Bial Italia Srl; Advisory board fees from Bial; Research support from the Ministero Italiano della Salute; Editor-in-Chief of the neuromuscular and movement disorders section of Brain Sciences; Associate Editor of Parkinsonism and Related Disorders and Frontiers in Neurology. T.v.E. is a civil servant of North Rhine-Westphalia (Germany) and an employee of the University Hospital of Cologne, Germany. In the past 2 years, he received honoraria, stipends or speaker fees from the Lundbeck Foundation, Gain Therapeutics, Orion Pharma, Lundbeck Pharma, Atheneum and the International Movement Disorders Society; he receives materials from Life Molecular Imaging and Lilly Pharma; and he owns stocks in the NVIDIA, Microsoft and IBM corporations. Multiple unrelated research projects are currently supported by the German Research Foundation.
Supplementary material
Supplementary material is available at Brain online.
References
- 1. Diederich NJ, Surmeier DJ, Uchihara T, Grillner S, Goetz CG. Parkinson’s disease: Is it a consequence of human brain evolution? Mov Disord. 2019;34:453–459. [DOI] [PMC free article] [PubMed] [Google Scholar]
- 2. Foffani G, Obeso JA. A cortical pathogenic theory of Parkinson’s disease. Neuron. 2018;99:1116–1128. [DOI] [PubMed] [Google Scholar]
- 3. Nambu A. Somatotopic organization of the primate basal ganglia. Front Neuroanat. 2011;5:26. [DOI] [PMC free article] [PubMed] [Google Scholar]
- 4. Kojovic M, Bologna M, Kassavetis P, et al. Functional reorganization of sensorimotor cortex in early Parkinson disease. Neurology. 2012;78:1441–1448. [DOI] [PMC free article] [PubMed] [Google Scholar]
- 5. Bologna M, Paparella G, Fasano A, Hallett M, Berardelli A. Evolving concepts on bradykinesia. Brain. 2020;143:727–750. [DOI] [PMC free article] [PubMed] [Google Scholar]
- 6. Pagano G, Ferrara N, Brooks DJ, Pavese N. Age at onset and Parkinson disease phenotype. Neurology. 2016;86:1400–1407. [DOI] [PMC free article] [PubMed] [Google Scholar]
- 7. Hoenig MC, Dzialas V, Drzezga A, van Eimeren T. The concept of motor reserve in Parkinson’s disease: New wine in old bottles? Mov Disord. 2023;38:16–20. [DOI] [PubMed] [Google Scholar]
- 8. Stern Y. What is cognitive reserve? Theory and research application of the reserve concept. J Int Neuropsychol Soc. 2002;8:448–460. [PubMed] [Google Scholar]
- 9. Arenaza-Urquijo EM, Vemuri P. Improving the resistance and resilience framework for aging and dementia studies. Alzheimers Res Ther. 2020;12:41. [DOI] [PMC free article] [PubMed] [Google Scholar]
- 10. Ammann C, Dileone M, Pagge C, et al. Cortical disinhibition in Parkinson’s disease. Brain. 2020;143:3408–3421. [DOI] [PubMed] [Google Scholar]
- 11. Bologna M, Suppa A, Conte A, Latorre A, Rothwell JC, Berardelli A. Are studies of motor cortex plasticity relevant in human patients with Parkinson’s disease? Clin Neurophysiol. 2016;127:50–59. [DOI] [PubMed] [Google Scholar]
- 12. Chen R, Berardelli A, Bhattacharya A, et al. Clinical neurophysiology of Parkinson’s disease and parkinsonism. Clin Neurophysiol Pract. 2022;7:201–227. [DOI] [PMC free article] [PubMed] [Google Scholar]
- 13. Rothwell J, Antal A, Burke D, et al. Central nervous system physiology. Clin Neurophysiol. 2021;132:3043–3083. [DOI] [PMC free article] [PubMed] [Google Scholar]
- 14. Siebner HR, Funke K, Aberra AS, et al. Transcranial magnetic stimulation of the brain: What is stimulated?—A consensus and critical position paper. Clin Neurophysiol. 2022;140:59–97. [DOI] [PMC free article] [PubMed] [Google Scholar]
- 15. Blesa J, Trigo-Damas I, Dileone M, Del Rey NLG, Hernandez LF, Obeso JA. Compensatory mechanisms in Parkinson’s disease: Circuits adaptations and role in disease modification. Exp Neurol. 2017;298(Pt B):148–161. [DOI] [PubMed] [Google Scholar]
- 16. Guerra A, Colella D, Cannavacciuolo A, et al. Short-term plasticity of the motor cortex compensates for bradykinesia in Parkinson’s disease. Neurobiol Dis. 2023;182:106137. [DOI] [PubMed] [Google Scholar]
- 17. Guerra A, Colella D, Giangrosso M, et al. Driving motor cortex oscillations modulates bradykinesia in Parkinson’s disease. Brain. 2022;145:224–236. [DOI] [PubMed] [Google Scholar]
- 18. Kojovic M, Kassavetis P, Bologna M, et al. Transcranial magnetic stimulation follow-up study in early Parkinson’s disease: A decline in compensation with disease progression? Mov Disord. 2015;30:1098–1106. [DOI] [PubMed] [Google Scholar]
- 19. Latorre A, Rocchi L, Berardelli A, Bhatia KP, Rothwell JC. The interindividual variability of transcranial magnetic stimulation effects: Implications for diagnostic use in movement disorders. Mov Disord. 2019;34:936–949. [DOI] [PubMed] [Google Scholar]
- 20. Brotchie J, Fitzer-Attas C. Mechanisms compensating for dopamine loss in early Parkinson disease. Neurology. 2009;72(7 Suppl):S32–S38. [DOI] [PubMed] [Google Scholar]
- 21. Paparella G, De Riggi M, Cannavacciuolo A, et al. Interhemispheric imbalance and bradykinesia features in Parkinson’s disease. Brain Commun. 2024;6:fcae020. [DOI] [PMC free article] [PubMed] [Google Scholar]
- 22. Postuma RB, Berg D, Stern M, et al. MDS clinical diagnostic criteria for Parkinson’s disease. Mov Disord. 2015;30:1591–1601. [DOI] [PubMed] [Google Scholar]
- 23. American Psychiatric Association, DSM-5 Task Force . Diagnostic and statistical manual of mental disorders: DSM-5 (5th edn). American Psychiatric Publishing; 2013. 10.1176/appi.books.9780890425596 [DOI] [Google Scholar]
- 24. Oldfield RC. The assessment and analysis of handedness: The Edinburgh inventory. Neuropsychologia. 1971;9:97–113. [DOI] [PubMed] [Google Scholar]
- 25. Defer GL, Widner H, Marié RM, Rémy P, Levivier M. Core assessment program for surgical interventional therapies in Parkinson’s disease (CAPSIT-PD). Mov Disord. 1999;14:572–584. [DOI] [PubMed] [Google Scholar]
- 26. Rossi S, Hallett M, Rossini PM, Pascual-Leone A, Safety of TMS Consensus Group . Safety, ethical considerations, and application guidelines for the use of transcranial magnetic stimulation in clinical practice and research. Clin Neurophysiol. 2009;120:2008–2039. [DOI] [PMC free article] [PubMed] [Google Scholar]
- 27. Rossini PM, Burke D, Chen R, et al. Non-invasive electrical and magnetic stimulation of the brain, spinal cord, roots and peripheral nerves: Basic principles and procedures for routine clinical and research application. An updated report from an I.F.C.N. Committee. Clin Neurophysiol. 2015;126:1071–1107. [DOI] [PMC free article] [PubMed] [Google Scholar]
- 28. Cilia R, Ko JH, Cho SS, et al. Reduced dopamine transporter density in the ventral striatum of patients with Parkinson’s disease and pathological gambling. Neurobiol Dis. 2010;39:98–104. [DOI] [PubMed] [Google Scholar]
- 29. Parkinson Progression Marker Initiative . The Parkinson progression marker initiative (PPMI). Prog Neurobiol. 2011;95:629–635. [DOI] [PMC free article] [PubMed] [Google Scholar]
- 30. Lanfranchi F, Arnaldi D, Miceli A, et al. Different z-score cut-offs for striatal binding ratio (SBR) of DaT SPECT are needed to support the diagnosis of Parkinson’s disease (PD) and dementia with Lewy bodies (DLB). Eur J Nucl Med Mol Imaging. 2023;50:1090–1102. [DOI] [PubMed] [Google Scholar]
- 31. Banwinkler M, Dzialas V, Parkinson’s Progression Markers Initiative, Hoenig MC, van Eimeren T. Gray matter volume loss in proposed brain-first and body-first Parkinson’s disease subtypes. Mov Disord. 2022;37:2066–2074. [DOI] [PubMed] [Google Scholar]
- 32. Goetz CG, Tilley BC, Shaftman SR, et al. Movement Disorder Society-sponsored revision of the unified Parkinson’s disease rating scale (MDS-UPDRS): Scale presentation and clinimetric testing results. Mov Disord. 2008;23:2129–2170. [DOI] [PubMed] [Google Scholar]
- 33. Antonini A, Abbruzzese G, Ferini-Strambi L, et al. Validation of the Italian version of the Movement Disorder Society–unified Parkinson’s disease rating scale. Neurol Sci. 2013;34:683–687. [DOI] [PubMed] [Google Scholar]
- 34. Hoehn MM, Yahr MD. Parkinsonism: Onset, progression and mortality. Neurology. 1967;17:427–442. [DOI] [PubMed] [Google Scholar]
- 35. Noyce AJ, Schrag A, Masters JM, Bestwick JP, Giovannoni G, Lees AJ. Subtle motor disturbances in PREDICT-PD participants. J Neurol Neurosurg Psychiatry. 2017;88:212–217. [DOI] [PMC free article] [PubMed] [Google Scholar]
- 36. Goetz CG, Stebbins GT, Tilley BC. Calibration of unified Parkinson’s disease rating scale scores to Movement Disorder Society-unified Parkinson’s disease rating scale scores. Mov Disord. 2012;27:1239–1242. [DOI] [PubMed] [Google Scholar]
- 37. Williams S, Wong D, Alty JE, Relton SD. Parkinsonian hand or clinician’s eye? Finger tap bradykinesia interrater reliability for 21 movement disorder experts. J Parkinsons Dis. 2023;13:525–536. [DOI] [PMC free article] [PubMed] [Google Scholar]
- 38. Paparella G, Cannavacciuolo A, Angelini L, et al. May bradykinesia features aid in distinguishing Parkinson’s disease, essential tremor, and healthy elderly individuals? J Parkinsons Dis. 2023;13:1047–1060. [DOI] [PMC free article] [PubMed] [Google Scholar]
- 39. Ricciardi L, Visco-Comandini F, Erro R, et al. Emotional facedness in Parkinson’s disease. J Neural Transm (Vienna). 2018;125:1819–1827. [DOI] [PubMed] [Google Scholar]
- 40. Möller C, Arai N, Lücke J, Ziemann U. Hysteresis effects on the input–output curve of motor evoked potentials. Clin Neurophysiol. 2009;120:1003–1008. [DOI] [PubMed] [Google Scholar]
- 41. Bologna M, Guerra A, Paparella G, et al. Neurophysiological correlates of bradykinesia in Parkinson’s disease. Brain. 2018;141:2432–2444. [DOI] [PubMed] [Google Scholar]
- 42. Paparella G, Rocchi L, Bologna M, Berardelli A, Rothwell J. Differential effects of motor skill acquisition on the primary motor and sensory cortices in healthy humans. J Physiol. 2020;598:4031–4045. [DOI] [PubMed] [Google Scholar]
- 43. Passaretti M, Pollini L, Paparella G, et al. Neurophysiological assessment of juvenile parkinsonism due to primary monoamine neurotransmitter disorders. J Neural Transm (Vienna). 2022;129:1011–1021. [DOI] [PMC free article] [PubMed] [Google Scholar]
- 44. Paparella G, De Riggi M, Cannavacciuolo A, et al. Relationship between the interlimb transfer of a visuomotor learning task and interhemispheric inhibition in healthy humans. Cereb Cortex. 2023;33:7335–7346. [DOI] [PubMed] [Google Scholar]
- 45. Bologna M, Caronni A, Berardelli A, Rothwell JC. Practice-related reduction of electromyographic mirroring activity depends on basal levels of interhemispheric inhibition. Eur J Neurosci. 2012;36:3749–3757. [DOI] [PubMed] [Google Scholar]
- 46. Fiori F, Chiappini E, Candidi M, Romei V, Borgomaneri S, Avenanti A. Long-latency interhemispheric interactions between motor-related areas and the primary motor cortex: A dual site TMS study. Sci Rep. 2017;7:14936. [DOI] [PMC free article] [PubMed] [Google Scholar]
- 47. Irlbacher K, Brocke J, Mechow JV, Brandt SA. Effects of GABAA and GABAB agonists on interhemispheric inhibition in man. Clin Neurophysiol. 2007;118:308–316. [DOI] [PubMed] [Google Scholar]
- 48. Wolters A, Sandbrink F, Schlottmann A, et al. A temporally asymmetric Hebbian rule governing plasticity in the human motor cortex. J Neurophysiol. 2003;89:2339–2345. [DOI] [PubMed] [Google Scholar]
- 49. Hamada M, Strigaro G, Murase N, et al. Cerebellar modulation of human associative plasticity. J Physiol. 2012;590:2365–2374. [DOI] [PMC free article] [PubMed] [Google Scholar]
- 50. de la Fuente-Fernández R, Schulzer M, Kuramoto L, et al. Age-specific progression of nigrostriatal dysfunction in Parkinson’s disease. Ann Neurol. 2011;69:803–810. [DOI] [PubMed] [Google Scholar]
- 51. Bateup HS, Santini E, Shen W, et al. Distinct subclasses of medium spiny neurons differentially regulate striatal motor behaviors. Proc Natl Acad Sci U S A. 2010;107:14845–14850. [DOI] [PMC free article] [PubMed] [Google Scholar]
- 52. Cui G, Jun SB, Jin X, et al. Concurrent activation of striatal direct and indirect pathways during action initiation. Nature. 2013;494:238–242. [DOI] [PMC free article] [PubMed] [Google Scholar]
- 53. Kravitz AV, Freeze BS, Parker PRL, et al. Regulation of parkinsonian motor behaviours by optogenetic control of basal ganglia circuitry. Nature. 2010;466:622–626. [DOI] [PMC free article] [PubMed] [Google Scholar]
- 54. Guo L, Xiong H, Kim JI, et al. Dynamic rewiring of neural circuits in the motor cortex in mouse models of Parkinson’s disease. Nat Neurosci. 2015;18:1299–1309. [DOI] [PMC free article] [PubMed] [Google Scholar]
- 55. Xu T, Wang S, Lalchandani RR, Ding JB. Motor learning in animal models of Parkinson’s disease: Aberrant synaptic plasticity in the motor cortex. Mov Disord. 2017;32:487–497. [DOI] [PMC free article] [PubMed] [Google Scholar]
- 56. Jahanshahi M, Obeso I, Rothwell JC, Obeso JA. A fronto–striato–subthalamic–pallidal network for goal-directed and habitual inhibition. Nat Rev Neurosci. 2015;16:719–732. [DOI] [PubMed] [Google Scholar]
- 57. Karreman M, Moghaddam B. The prefrontal cortex regulates the basal release of dopamine in the limbic striatum: An effect mediated by ventral tegmental area. J Neurochem. 1996;66:589–598. [DOI] [PubMed] [Google Scholar]
- 58. Keck ME, Welt T, Müller MB, et al. Repetitive transcranial magnetic stimulation increases the release of dopamine in the mesolimbic and mesostriatal system. Neuropharmacology. 2002;43:101–109. [DOI] [PubMed] [Google Scholar]
- 59. Kosillo P, Zhang YF, Threlfell S, Cragg SJ. Cortical control of striatal dopamine transmission via striatal cholinergic interneurons. Cereb Cortex. 2016;26:4160–4169. [DOI] [PMC free article] [PubMed] [Google Scholar]
- 60. Taber MT, Fibiger HC. Electrical stimulation of the medial prefrontal cortex increases dopamine release in the striatum. Neuropsychopharmacology. 1993;9:271–275. [DOI] [PubMed] [Google Scholar]
- 61. Strafella AP, Paus T, Fraraccio M, Dagher A. Striatal dopamine release induced by repetitive transcranial magnetic stimulation of the human motor cortex. Brain. 2003;126:2609–2615. [DOI] [PubMed] [Google Scholar]
- 62. Strafella AP, Paus T, Barrett J, Dagher A. Repetitive transcranial magnetic stimulation of the human prefrontal cortex induces dopamine release in the caudate nucleus. J Neurosci. 2001;21:RC157–RC157. [DOI] [PMC free article] [PubMed] [Google Scholar]
- 63. Ridding MC, Inzelberg R, Rothwell JC. Changes in excitability of motor cortical circuitry in patients with Parkinson’s disease. Ann Neurol. 1995;37:181–188. [DOI] [PubMed] [Google Scholar]
- 64. Berardelli A, Rona S, Inghilleri M, Manfredi M. Cortical inhibition in Parkinson’s disease. A study with paired magnetic stimulation. Brain. 1996;119(Pt 1):71–77. [DOI] [PubMed] [Google Scholar]
- 65. Strafella AP, Valzania F, Nassetti SA, et al. Effects of chronic levodopa and pergolide treatment on cortical excitability in patients with Parkinson’s disease: A transcranial magnetic stimulation study. Clin Neurophysiol. 2000;111:1198–1202. [DOI] [PubMed] [Google Scholar]
- 66. Bares M, Kanovský P, Klajblová H, Rektor I. Intracortical inhibition and facilitation are impaired in patients with early Parkinson’s disease: A paired TMS study. Eur J Neurol. 2003;10:385–389. [DOI] [PubMed] [Google Scholar]
- 67. Ni Z, Gunraj C, Nelson AJ, et al. Two phases of interhemispheric inhibition between motor related cortical areas and the primary motor cortex in human. Cereb Cortex. 2009;19:1654–1665. [DOI] [PubMed] [Google Scholar]
- 68. Lizarraga KJ, Saravanamuttu J, Baarbé JK, Lang AE, Chen R. Interhemispheric pathways in agenesis of the corpus callosum and Parkinson’s disease. Brain Stimul. 2020;13:360–362. [DOI] [PubMed] [Google Scholar]
- 69. Reis J, Swayne OB, Vandermeeren Y, et al. Contribution of transcranial magnetic stimulation to the understanding of cortical mechanisms involved in motor control. J Physiol. 2008;586(Pt 2):325–351. [DOI] [PMC free article] [PubMed] [Google Scholar]
- 70. Johansson ME, Toni I, Kessels RPC, Bloem BR, Helmich RC. Clinical severity in Parkinson’s disease is determined by decline in cortical compensation. Brain. 2024;147:871–886. [DOI] [PMC free article] [PubMed] [Google Scholar]
- 71. Morgante F, Espay AJ, Gunraj C, Lang AE, Chen R. Motor cortex plasticity in Parkinson’s disease and levodopa-induced dyskinesias. Brain. 2006;129(Pt 4):1059–1069. [DOI] [PubMed] [Google Scholar]
- 72. Ueki Y, Mima T, Kotb MA, et al. Altered plasticity of the human motor cortex in Parkinson’s disease. Ann Neurol. 2006;59:60–71. [DOI] [PubMed] [Google Scholar]
- 73. Kuo MF, Paulus W, Nitsche MA. Boosting focally-induced brain plasticity by dopamine. Cereb Cortex. 2008;18:648–651. [DOI] [PubMed] [Google Scholar]
- 74. Monte-Silva K, Liebetanz D, Grundey J, Paulus W, Nitsche MA. Dosage-dependent non-linear effect of L-dopa on human motor cortex plasticity. J Physiol. 2010;588:3415–3424. [DOI] [PMC free article] [PubMed] [Google Scholar]
- 75. Monte-Silva K, Kuo M-F, Thirugnanasambandam N, Liebetanz D, Paulus W, Nitsche MA. Dose-dependent inverted U-shaped effect of dopamine (D2-like) receptor activation on focal and nonfocal plasticity in humans. J Neurosci. 2009;29:6124–6131. [DOI] [PMC free article] [PubMed] [Google Scholar]
- 76. Guerra A, López-Alonso V, Cheeran B, Suppa A. Variability in non-invasive brain stimulation studies: Reasons and results. Neurosci Lett. 2020;719:133330. [DOI] [PubMed] [Google Scholar]
- 77. Stefan K, Kunesch E, Cohen LG, Benecke R, Classen J. Induction of plasticity in the human motor cortex by paired associative stimulation. Brain. 2000;123(Pt 3):572–584. [DOI] [PubMed] [Google Scholar]
Associated Data
This section collects any data citations, data availability statements, or supplementary materials included in this article.
Supplementary Materials
Data Availability Statement
Data are available upon reasonable request to the corresponding author.