

Abstract
There is substantial evidence to suggest that preference for visual curvature is a reliable phenomenon. Yet, little is known about the ways in which the encoding of curvature in the brain contributes to hedonic evaluation while participants are actively engaged in making choices about objects varying in curvature. To address this question, we reanalyzed fMRI data collected while participants made aesthetic judgments (beautiful vs. not beautiful) and approach-avoidance decisions (enter vs. exit) in relation to measures of (a) computational curvature, (b) perceived curvature, (c) perceived angularity, and (d) aesthetic pleasure in the domain of architecture. Our results show that a region in early visual cortex (BA 17) encompassing largely areas V2-V3 is sensitive to variation in computational curvature across both beauty judgments and approach-avoidance decisions, whereas a region encompassing the fusiform gyrus (BA 37) exhibits sensitivity to perceived curvature only when participants made beauty judgments. These results contribute to our understanding of the neurobiological basis of curvature preference by demonstrating that the sensitivity of the visual cortex to computational curvature is context invariant, whereas the sensitivity of the fusiform gyrus to perceived curvature varies by context.
Keywords: Curvature, Contour, Angularity, Architecture, Design, Vision
Subject terms: Human behaviour, Object vision
Introduction
Humans exhibit a preference for visual curvature. Empirical evidence dating back a century has shown that people prefer curvature in relation to everyday objects1, abstract shapes2–6, lines7–9, paintings10, faces11, and interior spaces12–15, among others16. Furthermore, this effect has been observed in infants17,18, great apes19,20, and across human cultures21, suggesting that it is a robust phenomenon. Indeed, a recent meta-analysis of this literature demonstrated a medium effect size (Hedges’ g of 0.39) for preference for curvature22.
However, although this body of work suggests that preference for curvature is a reliable phenomenon, several experiments have found that a significant minority of people do not conform to this general trend23–25. Evidence from these and other studies suggests that preference for curvature is moderated by both endogenous and contextual factors, including presentation time, stimulus type, expertise, task, and affordances22,26,27. For example, Vartanian and colleagues found that architects and designers exhibit a preference for curved over angular interiors when making beauty judgments, and that laypersons exhibit a preference for curved over angular interiors when making approach-avoidance decisions28. In turn, Palumbo and colleagues demonstrated that preference for curved interiors was reduced in people with autism spectrum disorder, and that quasi-experts (i.e., design students) in fact preferred angular over curved interiors29. More recently, Tawil and colleagues conducted a pair of studies that suggest that the manner in which participants interact with a space is an important factor in the emergence of preference for curvature. Specifically, when participants are exposed to indoor living rooms in a free-exploration photorealistic virtual reality (VR) paradigm, preference for curvature was not observed30. In a follow-up study with images of photo-realistic indoor environments, they did observe a preference for curved interiors, although only in female participants and with respect to images depicting modern interiors31.
These results raise the question of how the encoding of visual curvature contributes to the hedonic evaluation of objects that vary in degree of curvature. By and large, studies that have investigated the neurobiological basis of curvature preference have focused their efforts on understanding the contribution of the corticolimbic reward circuitry to the computation of preference for curvature—motivated by the hypothesis that its engagement underlies hedonic liking32–34. For example, Bar and Neta presented their participants with images of real objects and meaningless patterns in the functional magnetic resonance imaging (fMRI) scanner, and instructed them to make like/dislike choices based on their immediate “gut” reaction35. Behaviourally, they found that participants were more likely to prefer curved over angular stimuli. In addition, they found that viewing and rating of angular images was correlated with greater activation in the amygdala, a structure thought to make contributions to the computation of different aversive responses to sensory stimuli, including fear and displeasure32. Given the association of amygdala with perception of threat and fear processing, the authors concluded that preference for curvature may arise due to our brain’s evolved tendency to use contour curvature as an early warning signal to denote the presence of danger, in this case represented by sharp objects.
In turn, Vartanian and colleagues used fMRI to examine preference for curvature in the domain of architecture. Specifically, they presented participants with images of architectural interiors that varied in curvature under two different conditions36. In the aesthetic judgment condition, participants were instructed to indicate whether they found the space “beautiful” or “not beautiful,” whereas in the approach-avoidance condition participants were instructed to indicate whether they would opt to “enter” or “exit” the space. As predicted, participants were more likely to find curved interiors beautiful, and this preference was correlated with greater activation in the anterior cingulate cortex (ACC)—a core region within the corticolimbic reward circuitry associated with the computation of emotions and reward37,38. Coupled with the fact that pleasantness ratings accounted for nearly 60% of the variance in beauty ratings, the results were consistent with the hypothesis that preference for curvature is driven in part by the encoding and representation of pleasure. In contrast, curvature had no impact on choices in the approach-avoidance condition, although curved interiors activated the visual cortex. These observations suggest that the effect of curvature on behaviour and its neural correlates are context-dependent.
Finally, Banaei and colleagues equipped their participants with mobile electroencephalogram (EEG) units as they walked through different interior forms in VR that varied in curvilinear geometry39. After having traversed a room in VR, participants were asked to rate it according to how pleasurable and arousing they found it to be. Results showed that rooms rated as more pleasurable and arousing correlated with higher activity in the ACC. Since these rooms were characterized by a high degree of curvature geometry, the authors concluded that their results replicated the effect observed by Vartanian et al.36.
Although these studies lend support to the hypothesis that corticolimbic structures linked to the generation of pleasure and displeasure play a role in determining liking and disliking responses to visual stimuli varying in curvature, they do not shed light on whether processes associated with the perceptual encoding of curvature contribute to the computation of preference. Recent research, though, has examined how curvature information is represented by primate visual systems during passive viewing of visual objects. Thus, using a block design administered in a vertical fMRI scanner, Yue and colleagues presented rhesus monkeys with stimuli in several categories including real-world round vs. angular shapes, computer-generated 3D spheres vs. pyramid arrays, and faces vs. objects40. Their results showed a network of hierarchically organized regions in the ventral visual pathway that are selective for the processing of curved visual features, consisting of a posterior curvature-biased patch located in the near-foveal representation of dorsal V4, a middle curvature-biased patch located on the ventral lip of the posterior superior temporal sulcus (STS), and an anterior curvature-biased patch located just below STS. Furthermore, the proximity of this network to the well-known network for face perception suggests that there might be a functional relationship between the processing of curvature and faces in the brain. Motivated by those results, Yue and colleagues conducted a second fMRI study to determine whether a similar curvature-sensitive network would be present in humans. Results from this experiment confirmed that a network of curvature-preferring cortical patches in the occipito-temporal region exists in the human brain, consisting of areas V3, V4, the fusiform curvature patch and the occipital curvature patch41. The fact that in humans, too, some of these areas overlapped with face-selective areas suggests further that there might be a functional overlap between processing of faces and curvature.
The purpose of the present study was to examine if the system of patches in the ventral visual system identified by Yue and colleagues to be specialized for the passive perceptual encoding of curvature is also engaged during active hedonic evaluation of objects varying in curvature. Specifically, we examined whether parts of the neural system identified by Yue and colleagues are sensitive to variation in curvature during explicit evaluations of architectural stimuli that vary in curvature, and whether such activity predicts hedonic outcomes. Toward that end, we reanalyzed fMRI data from a previous study conducted by Vartanian and colleagues in which participants had made aesthetic judgments and approach-avoidance decisions for interior spaces varying in curvature (Fig. 1)36. In addition, for every stimulus used in that previous experiment, we obtained new ratings of perceived curvature, perceived angularity, and aesthetic pleasure collected from a new sample of participants, as well as a computational measure of curvature42,43—defined as the amount of change in orientation from one line segment to the next line segment, divided by the length of the segment. Using parametric analysis of fMRI data, we then examined covariation between neural activation in the visual system and differences in measures of perceived and computational curvature. We tested two main hypotheses. First, behaviourally, we hypothesized that computational and perceived measures of curvature would be positively correlated, based on the notion that the perception of contours within the visual system is driven in part by the signal represented by our formal, mathematical definition of curvature. Second, neurologically, we hypothesized that regions in the ventral visual system would exhibit sensitivity to variations in computational and perceived measures of curvature and angularity. We also predicted that this covariation pattern would vary as a function of the task (i.e., aesthetic judgments and approach-avoidance decisions), given that earlier studies have demonstrated context effects on preference for curvature22 and its neural correlates36.
Fig. 1.

Examples of the experimental stimuli (n = 200). The stimuli in the top and bottom rows were categorized as “curvilinear” and “rectilinear” respectively by the two experts in Vartanian et al. The number underneath each stimulus represents its associated computational curvature value (see Text)42,43.
Methods
Stimuli
The set of stimuli consisted of a previously characterized set of 200 architectural scenes of interior spaces (Fig. 1)36. Two architects (“experts”) had independently categorized the images into two groups: Curvilinear and rectilinear. Only images for which they had reached 100% consensus were included in the final set of 200 images. To computationally measure curvature, the most salient contours in the images were detected and traced automatically. Curvature, in a mathematical sense, is defined as the amount of change in direction over a specific distance along the contour (Fig. 2). Computational curvature was then computed as the amount of change in orientation from one straight contour segment to the next segment, divided by the length of the segment. This is the definition for the term ‘computational curvature’ as used in this study. To obtain the amount of curvature in the entire image, we averaged the computed curvature values across all contour segments in the image, weighted by the length (i.e., number of pixels) in each contour. The algorithms for this procedure were implemented in MATLAB, and are available in the open-source Mid-Level Vision Toolbox (URL: http://mlvtoolbox.org42).
Fig. 2.

Mathematical computation of curvature. The most commonly used mathematical measure quantifies curvature as the amount of change in orientation (θ1 in shape A and θ2 in shape B) from one line segment (P1P2 in shape A and P5P6 in shape B) to the next line segment (P2P3 in shape A and P6P7 in shape B), divided by the length of the second segment (P2P3 and P6P7, respectively).
Behavioural experiment
Participants
The experiment was approved by the Research Ethics Board of the University of Toronto (Protocol 30999). All participants provided written informed consent, and data collection was performed in accordance with the Declaration of Helsinki. Seventy participants (36 male, 32 female, 2 non-binary, age 18–73) took part in the online rating experiment on Prolific. On average, the experiment took 17 min to complete. Participants were compensated for their time at GBP 7.5 per hour.
Procedure
Using two versions of the experiment, each participant viewed 100 scenes presented in random order. Each image was rated by 35 participants. Each image set had an equal number of “curvilinear” and “rectilinear” images as labelled by the experts in Vartanian and colleagues36. Prior to the image rating part of the experiment, participants were given instructions that included definitions of the terms ‘curved’ and ‘angular’. The definitions were both verbal and visual. Participants were presented with visual representations of ‘curved’ and ‘angular’ shapes using a figure taken from a previous study2. Following these instructions, participants completed 10 practice trials, where they rated one image at a time based on 3 criteria: Curvature, angularity, and aesthetic pleasure (Afterwards, mood was measured using the PANAS44. However, those data fall outside the purview of the present manuscript.). These three ratings are referred to as ‘perceived curvature,’ ‘perceived angularity,’ and ‘aesthetic pleasure,’ respectively. Participants were then asked to rate the 100 experimental images based on these three criteria. The presentation order for images as well as the order with which questions were presented for the images were randomized. The procedure for the collection of ratings was adopted from a previous experiment45. Specifically, to measure perceived curvature, participants were asked to rate the degree to which a scene appeared curved to them by responding to the following question: How curved does this room look to you? Responses were collected using a 5-point Likert scale: 1 = “not at all curved”, 2 = “barely curved”, 3 = “somewhat curved”, 4 = “curved”, 5 = “extremely curved.” In turn, for ratings of perceived angularity, participants were asked to rate the degree to which a scene appeared angular to them by responding to the following question: How angular does this image seem to you? Responses were collected using a 5-point Likert scale: 1 = “not at all angular”, 2 = “barely angular”, 3 = “somewhat angular”, 4 = “angular”, 5 = “extremely angular.” Finally, images were also rated on aesthetic pleasure: How much do you enjoy viewing this image? Responses were collected using a 5-point Likert scale: 1 = ”not at all”, 2 = “barely enjoy”, 3 = “somewhat enjoy”, 4 = “enjoy”, 5 = ”enjoy very much.” For each of the three criteria (i.e., perceived curvature, perceived angularity, and aesthetic pleasure), the ratings were converted to z scores (subtract mean, divide by SD) to account for individual differences in the use of the Likert scale, and averaged for each image (35 ratings per image). The behavioural experiment was coded using Inquisit millisecond software, and recruitment was completed remotely using the Prolific recruitment platform. Data and experiment code are available on the Open Science Framework at: https://osf.io/h3uyg/?view_only=e14345005e264fc0b6f69fa0a56ef3c4
Statistical analysis
Analyses of behavioural data were conducted using RStudio. A general linear model with a binomial link function was used (glm, family = “binomial”) with binary decisions (exit/enter or beautiful/not beautiful) as the dependent variables. The logistic regression models included the following regressor variables: Perceived curvature, perceived angularity, aesthetic pleasure, and computational curvature. Separate analyses were completed for each dependent variable (i.e., exit/enter or beautiful/not beautiful).
fMRI
We re-analyzed a previously acquired fMRI dataset first published in Vartanian and colleagues36. For the original fMRI study all participants provided written informed consent under the guidance of the Universidad de la Laguna REB board–El Comité de Éticade la Investigación y de Bienestar Animal (CEIBA), and data collection was performed in accordance with the Declaration of Helsinki. For the detailed fMRI acquisition and imaging parameters, please see Vartanian and colleagues36. Using Statistical Parametric Mapping (SPM12), we conducted a set of parametric analyses under two task conditions: Beauty judgements and approach-avoidance decisions. This experiment had a block design, and the task order (i.e., beauty judgements and approach-avoidance decisions) was counterbalanced across participants (n = 18). In the beauty judgement task, participants viewed an interior architectural space and judged it as “beautiful” or “not beautiful.” In the approach-avoidance task, they viewed an interior architectural space and decided whether they would opt to “enter” or “exit” the space. Across both tasks, we conducted whole brain analyses to identify brain activations that covaried in relation to measures of computational curvature, perceived curvature, perceived angularity, and aesthetic pleasure. Specifically, the parameters included in the analysis consisted of (1) computational curvature, (2) perceived curvature, (3) perceived angularity, (4) aesthetic pleasure as well as (5), luminance, and (6) contrast. Luminance and contrast were included in the model because they have been shown to influence curvature processing; they were entered into the analysis as covariates (i.e., nuisance variables) and modelled out (by assigning a weight of “0” to their corresponding regressors), as was motor response (i.e., RT for entering a response in the fMRI scanner). The parametric analyses were conducted separately for the beauty judgement and approach-avoidance runs within the same GLM, following which we conducted a conjunction analysis to identify patterns of brain activation that were common across both tasks. Finally, a topographic volumetric atlas of the human visual cortex46 was subsequently used to precisely localize regions of interest that had emerged in the parametric analyses. Brain visualizations were obtained using AFNI and Suma47.
Results
Behavioural
Computational vs. perceived measures of curvature and angularity
Table 1 shows the statistical relationship between computational curvature, perceived curvature, perceived angularity, and aesthetic pleasure. As predicted, perceived angularity was correlated negatively with perceived curvature (r = − 0.96). However, and contrary to prediction, we did not observe any correlation between computational curvature and perceived curvature (r = 0.01) or perceived angularity (r = − 0.04). In turn, aesthetic pleasure was correlated positively with perceived curvature (r = 0.26) and negatively (although not statistically significantly) with perceived angularity (r = − 0.11). This suggests that both perceived curvature and angularity are related to aesthetic pleasure, but to varying degrees and in opposite directions. In contrast, computational curvature was unrelated to aesthetic pleasure (r = − 0.01) (Fig. 3).
Table 1.
Correlations between perceived and computational measures.
| Variable | M (SD) | Aesthetic pleasure | Perceived curvature | Perceived angularity |
|---|---|---|---|---|
| Aesthetic pleasure | 3.20 (0.79) | |||
| Perceived curvature | 3.16 (1.25) | 0.26* [0.14, 0.39] | ||
| Perceived angularity | 3.67 (1.10) | − 0.11 [-0.25,0.02] | − 0.96* [-0.97,-0.95] | |
| Computational curvature | 2.02 (0.49) | − 0.01 [-0.14, 0.12] | 0.01 [-0.13, 0.15] | − 0.04 [-0.18, 0.10] |
Pearson correlation coefficients are reported.
*p < 0.01.
Fig. 3.
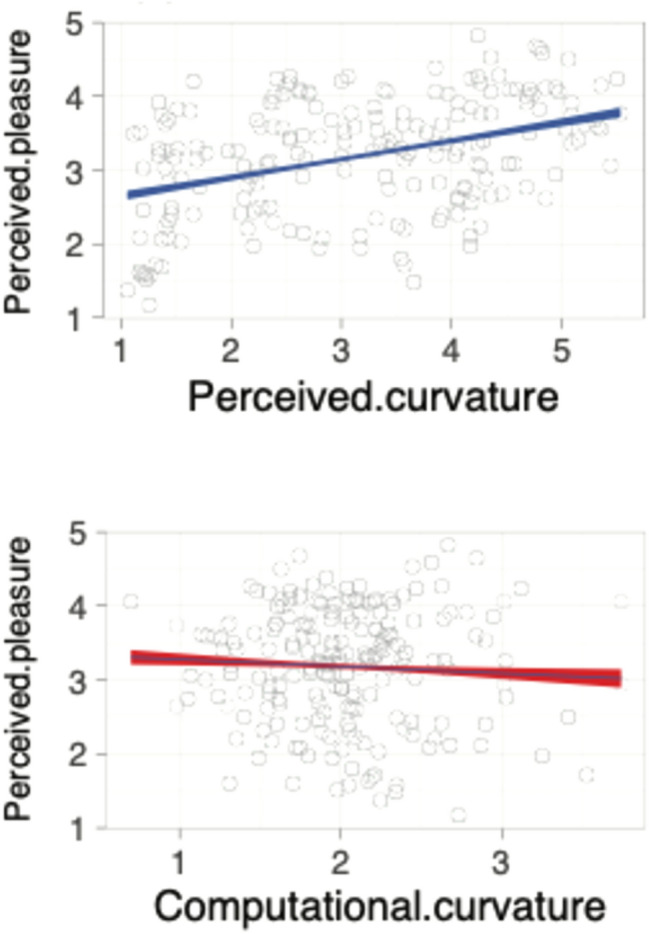
Associations involving perceived pleasure, perceived curvature, and computational curvature.
Expert vs. novice ratings
Recall that each stimulus in the original study was categorized as “curvilinear” or “rectilinear” by two experts (i.e., architects)36. This enabled us to explore the correspondence between those expert ratings and novice ratings of the same stimuli collected in the context of the present study. The results demonstrated that novice observers rated architectural scenes categorized as “curvilinear” by the experts to be higher in perceived curvature (M = 3.68, SD = 0.39), compared to architectural scenes that were categorized as “rectilinear” (M = 1.64, SD = 0.36) by the experts, t(67) = 31.29, p < 0.0001, Cohen’s d = 5.42 (large), 95% CI [4.68, 6.14] (Fig. 4). This suggests that spaces categorized as curvilinear by the experts are perceived similarly as curved by novices. Interestingly, there was no statistically significant difference in computational curvature between spaces categorized as curvilinear (M = 2.04, SD = 0.55) and rectilinear (M = 2.01, SD = 0.45) by the experts, t(198) = 0.45, p = 0.65, Cohen’s d = 0.06 (negligible), 95% CI [− 0.21, 0.34] (Fig. 4). This suggests that experts likely based their categorization of spaces as “curvilinear” or “rectilinear” on scene properties other than what is captured by our measure of computational curvature.
Fig. 4.

Associations involving computational and perceived measures of curvature and categorizations by expert architects. (A) Violin plots exhibiting the extent to which perceived and computational curvature values collected in the present experiment correspond to the categorization of the 200 stimuli as “curvilinear” (i.e., round = ro) and “rectilinear (i.e., sq = square) by the experts in Vartanian et al.
Beauty judgments vs. approach-avoidance decisions
Table 2 shows binomial logistic models which indicate whether perceived angularity, perceived curvature and computational curvature predicted approach-avoidance decisions and beauty judgements collected in the original experiment36. Specifically, for the approach-avoidance and beauty-judgment tasks separately, all three predictors were entered simultaneously into the binomial logistic regression models. The results demonstrated that in the approach-avoidance task, higher perceived angularity predicted a lower likelihood of opting to “exit” the space. In contrast, neither perceived curvature nor computational curvature predicted choices. In turn, in the beauty judgement task, higher perceived curvature and higher perceived angularity predicted higher likelihood of judging the space as “beautiful.” In contrast, computational curvature did not predict choices. Given that in the case of the beauty-judgment task both perceived curvature and perceived angularity were statistically significant predictors of choices, we conducted a follow-up test to examine their relative contributions to the observed pattern of judgments. Focusing on the Odds Ratios (OR), the results demonstrated that perceived curvature was a stronger predictor of choice than perceived angularity, Z = 2.04, p < 0.05. In summary, perceived angularity predicted choices in the approach-avoidance task, whereas perceived curvature and perceived angularity predicted choices in the beauty judgment task. Computational curvature was not predictive of choices in either task.
Table 2.
Logistic regression models predicting choices in beauty judgment and approach-avoidance tasks.
| Estimate [95% CI] | Z value | P value | OR [95% CI] | |
|---|---|---|---|---|
| Approach-avoidance | ||||
| Perceived curvature | − 0.05 [− 0.11, 0.01] | − 1.78 | 0.076 | 1 [0.95, 1.05] |
| Computational curvature | − 0.09 [− 0.21, 0.04] | − 1.35 | 0.176 | 0.94 [0.83, 1.06] |
| Perceived angularity | − 0.10 [− 0.17, 0.04] | − 3.07 | 0.002** | 0.93 [0.88, 0.99] |
| Beauty | ||||
| Perceived curvature | − 0.17 [− 0.25, − 0.08] | − 3.88 | 0.0009** | 0.89 [0.83, 0.95] |
| Computational curvature | 0.11 [− 0.07, 0.29] | 1.23 | 0.22 | 1.14 [0.96, 1.36] |
| Perceived angularity | − 0.10 [− 0.20, − 0.01] | − 2.08 | 0.037* | 1 [0.92, 1.08] |
OR odds ratio; logistic regression predicting choices: “not beautiful” vs. “beautiful” (beauty judgments), “exit” vs. “enter” (approach-avoidance decisions). **p < 0.01; *p < 0.05. The Nagelkerke pseudo R-squared value was computed for each model as a global effect size measure (approach avoidance = 0.002, beauty = 0.011).
Neural
Two sets of parametric analyses (i.e., beauty judgments, approach-avoidance decisions) were conducted to identify brain regions which covaried in activation in relation to curvature measures within the same GLM, following which we carried out conjunction analyses to reveal common areas of activation (Fig. 5; Table 3). Activations were considered statistically significant if they survived a whole-brain voxel-level threshold at p < 0.05, corrected for multiple comparisons (FWE: family-wise error).
Fig. 5.

Associations involving computational and perceived measures of curvature and neural activation. (A) Axial view of activated brain regions color-coded by task type and curvature measure. The bottom right figure shows the corresponding axial sections. (B) Topographic map of visual cortex showing parametric activations in relation to measures of curvature. Top: right, medial; Middle: left, inferior; Bottom: right, inferior.
Table 3.
Regions activated in the parametric analyses in relation to measures of perceived and computational curvature—broken down by task.
| Cluster (k) | X | Y | Z | T | BA | Region | |
|---|---|---|---|---|---|---|---|
| Approach-avoidance | |||||||
| Computational curvature | 1182 | − 16 | − 100 | − 2 | 11.3* | 17 | PVC |
| 1250 | 12 | − 82 | − 2 | 7.92* | 17 | PVC | |
| Beauty judgments | |||||||
| Computational curvature | 3132 | 14 | − 92 | 0 | 8.96* | 17 | PVC |
| Conjunction | 883 | − 14 | − 94 | − 2 | 8.09* | 17 | PVC |
| 902 | 14 | − 86 | − 2 | 7.32* | 17 | PVC | |
| Perceived curvature | 104 | 60 | − 46 | 0 | 3.65* | 37, 22 | FG, TG |
PVC primary visual cortex, FG fusiform gyrus, TG temporal gyrus.
*p < 0.05 (corrected for multiple comparisons based on family-wise error). The coordinates are reported in MNI space.
In the beauty judgement task, activation in bilateral visual cortex (BA 17) with a single right-lateralized peak covaried with computational curvature (Table 3; Fig. 5). The topographic map of subregions within the visual cortex in relation to this parametric analysis shows highest activation in the V2-V3 regions (Fig. 5). Similarly, in the approach-avoidance task, bilateral visual cortex activation (BA 17) covaried with computational curvature. A conjunction analysis identified the bilateral visual cortex (BA 17) as the overlapping region activated across both beauty judgment and approach-avoidance tasks in relation to computational curvature. More specifically, inclusive masking of this conjunction analysis using the probabilistic volumetric topographic maps of the human visual cortex46 demonstrated that the commonly activated region overlapped with V1 (ventral and dorsal), V2 (ventral and dorsal), V3 (ventral and dorsal), and hV4. Brain activation did not covary with measures of perceived curvature, perceived angularity, or aesthetic pleasure in the approach-avoidance task. In contrast, in the beauty judgement task, activation in two regions overlapping with BA 37 (fusiform area) bordering on BA 22 (temporal gyrus) covaried with perceived curvature (Table 3; Fig. 5).
Discussion
This study was conducted to test two main hypotheses. First, behaviourally, we had hypothesized that computational and perceived measures of curvature would be correlated positively, based on the idea that the perception of curvature within the visual system is driven in part by the signal represented by our formal, mathematical definition of curvature. This hypothesis was not supported. There could be a number of reasons for the deviation between computational and perceived measures of curvature. Recall that in the present context computational curvature was calculated based on the amount of change in orientation from one line segment to the next line segment, divided by the length of the segment (Fig. 2)42,43. This method is based on the 2-dimensional representation of the scene in the image plane. In contrast, it is possible that when participants view a 2-dimensional image of a space, they base their evaluation of its curvature on a 3-dimentional mental representation of the scene, the features of which will obviously vary from computational curvature in the 2-dimensional image plane. Indeed, Djebbara and Kalantari have recently shown that affordances (i.e., possibilities for interaction) are a moderator of the curvature effect, thereby impacting its effect size26. In this sense, a 3-dimensional mental representation of the scenes may have impacted perceived curvature by facilitating a representation of their affordances, in turn causing a deviation between perceived and computational measures of curvature. Another possibility is that computational curvature was mainly based on detecting change of orientation, whereas participants might have responded to a different feature in the images when rating perceived curvature. Specifically, the computational measure ranges from no change (i.e., rectilinear) to changes of orientation that increase with angles, and this change in orientation can range from very abrupt (i.e., angular) to very smooth (i.e., curvilinear). As a result, two shapes can have very similar degrees of computational curvature but rather different degrees of perceived curvature (see examples in Fig. 1). This suggests that in the context of research on preference for curvature, the terms “rectilinear” and “angular” are in need of further conceptual and operational clarity and refinement.
Related to our first hypothesis, our results also revealed that naïve ratings of perceived curvature were in line with ratings of the experts (i.e., two architects) who had categorized the original 200 stimuli as “curvilinear” or “rectilinear”36. This finding is useful for interpreting results in this domain because it suggests that these two groups do not differ in the way they perceive curvature in architectural interior spaces. For example, Vartanian and colleagues demonstrated that architects and designers exhibited a preference for curved over angular interior spaces when making beauty judgments, but that laypeople exhibited a preference for curved over angular interiors when making approach-avoidance decisions28. The present results suggest that the differences observed between architects and designers compared to laypeople were likely not related to differences between the two groups in perceived curvature, but rather to the task context (i.e., beauty judgments vs. approach-avoidance decisions). The present findings will also be useful for any future studies seeking to compare the curvature effect between people with and without formal training in architecture and design.
Our second hypothesis, based on the work of Yue and colleagues41, was that regions in the ventral visual system would exhibit sensitivity to variations in computational and perceived measures of curvature and angularity. We also predicted that this covariation would vary as a function of the task (i.e., aesthetic judgments and approach-avoidance decisions), given earlier findings that had demonstrated context effects for preference for curvature in the visual domain22 and its neural correlates36. This hypothesis was partly confirmed. Specifically, our conjunction analysis identified a region overlapping with V1 (ventral and dorsal), V2 (ventral and dorsal), V3 (ventral and dorsal), and hV4 that exhibited sensitivity to computational curvature under both task conditions, with greatest degree of overlap in V2-V3. In contrast, we found that activation in a region overlapping with the fusiform gyrus (BA 37) bordering on the temporal gyrus (BA 22) covaried with perceived curvature only when making beauty judgments. This dissociation suggests that the neural correlates of computational curvature are context invariant, whereas the neural correlates of perceived curvature vary by context.
Our finding that the human visual cortex contains regions which are sensitive to changes in computational curvature is consistent with Yue and colleagues’ discovery of a network of curvature-sensitive cortical patches along with the ventral visual stream in both humans41 and rhesus monkeys40. In humans, Yue and colleagues identified three curvature patches located in retinotopic areas (V2vCO, V3dCP, V4CP), and in occipital and temporal cortex41. In our study, we found bilateral activations in visual cortical regions spanning from V1 through to V4, with highest activations in patches at the border of V2 and V3. These regions are shown to be sensitive to border ownership, and higher-order statistics in visual patterns which rely on earlier edge detection computations at the level of V148,49. Unlike previous studies that involved passive viewing paradigms40,41, the current fMRI dataset shows that even during experimental paradigms that necessitate the making of active choices (i.e., beauty judgements and approach-avoidance decisions), parts of the same visual cortical regions are modulated by changes in computational curvature in relation to architectural scenes. This effect is observed even after controlling for other image properties such as luminance and contrast, which have been shown to influence curvature processing. Because the regions exhibiting sensitivity to computational curvature in the present study overlap in part with the results of Yue and colleagues41, this suggests that a subset of regions that process curvature during passive viewing of visual stimuli remain sensitive to curvature while observers make active choices about architectural scenes, in particular dorsal and ventral V2-V3.
In contrast, perceived curvature in architectural scenes was correlated with activation in a dissociable brain region, and this activation varied by task condition. Specifically, in the beauty judgement task but not in the approach-avoidance task, perceived curvature covaried with activation in BA 37 overlapping with BA 22. Interestingly, in both studies involving rhesus monkeys and humans40,41, Yue and colleagues had noted the proximity of curvature-sensitive regions to those involved in face processing, suggesting that regions that are functionally specialized for face processing might also contribute to processing curvilinear features of other visual stimuli41. Our results are broadly consistent with those findings, but more research is required to determine the precise mechanistic contributions of BA 37 and 22 to the computation of curvature.
As noted earlier, little is known about how curvature information is represented perceptually and cognitively during hedonic evaluation of visual objects. This is a pivotal question because although previous research has made it clear that preference for visual curvature is reliable, it also varies across humans and can be modulated by both endogenous and contextual factors22–25. A likely explanation for this variation is that curvature information is represented differently as a function of varying task conditions and endogenous states. Yet, to date, no experiment has examined how curvature information is encoded perceptually and cognitively during hedonic evaluations. Our results reveal that making explicit beauty judgements and approach-avoidance decisions engage nuclei in the ventral visual system that have been associated with encoding the perceptual representation of curvature information40,41. Activity in a subset of those regions co-varied with computational curvature, but not with ratings of aesthetic pleasure. In contrast, activity in BA 37 overlapping with BA 22 covaried with perceived curvature when participants made beauty judgements, but not when they made approach-avoidance decisions. Because perceived curvature (but not computational curvature) predicted beauty judgements and was also correlated with ratings of aesthetic pleasure, our results suggest that preference for curvature might be influenced more by higher-order mechanisms than by early, bottom-up mechanisms. However, future experiments are needed to test if activation of the specific region observed in our experiment (i.e., BA 37 overlapping with BA 22) causally determines preference for curvature in the suggested manner.
Limitations
Our study has several limitations. First, our measure of computational curvature is one of several measures available in the literature. For example, for the study involving humans, Yue and colleagues41 modified the method used earlier in a study involving rhesus monkeys40 for the quantification of curvature in visual stimuli by calculating the amount of curvilinear and rectilinear information present in each image using curved Gabor filters50, which are themselves “a product of a rotated complex harmonic wave function and a two-dimensional bent and rotated Gaussian function”41. In turn, Clemente and colleagues have focused on what they referred to as tension to define the degree of curvilinearity or rectilinearity of the line connecting the vertexes or apexes, where “minimal tension was defined by a cubic Hermite spline interpolating the apexes, whereas maximal tension corresponded to straight lines forming a polygon”23. As such, the neural correlates of computational curvature reported in the present study are specific to our measure of calculating curvature from scene contours42,43, and their generalizability to other measures of computational curvature remains to be demonstrated empirically. Second, although our stimulus set was balanced in terms of ceiling height and perceived enclosure36, the images were not controlled in terms of other potential confounding factors that have been controlled for in subsequent studies involving other stimulus sets30,31. As such, it will be important to see whether the neural correlates of computational and perceived curvature reported here will be replicated in future neuroscientific studies involving better-matched stimulus sets. Third, perhaps the most important finding to emerge from studies of preference for curvature is that the effect is moderated by many factors22,23,26,31. Therefore, despite the fact that the neural correlates of computational curvature were found to be context-invariant in the present study, it is important to remember that “context” can vary in many ways, and that future work is necessary to determine the boundary conditions of the present findings across a wider set of contextual manipulations.
Conclusion
The geometric features of the environment interact with and can influence our affective states, social behaviours and cognitive states13,14,51–55. Here we provide preliminary evidence to demonstrate that the neural correlates of one such geometric feature—curvature—are dissociable as a function of how it is measured. Specifically, a region in BA 17 overlapping largely with areas V2 and V3 exhibited sensitivity to variation in computational curvature regardless of whether participants were engaged in aesthetic judgments or approach-avoidance decisions, whereas a region in BA 37/22 overlapping with the fusiform gyrus exhibited sensitivity to variation in perceived curvature only when participants were engaged in aesthetic judgments. The region exhibiting sensitivity to computational curvature overlaps in part with the results of Yue and colleagues41, suggesting that a subset of regions that process curvature during passive viewing of visual stimuli remains sensitive to curvature while making active choices about architectural scenes. Further work is necessary to compare multiple measures of computational curvature, perceived curvature and perceived angularity, and to determine the neurobiological mechanisms through which a perceived sense of curvature contributes to preference for curvature in the brain.
Author contributions
OV, DF, and DBW designed the study. DF collected the data. OV, DF, DBW, GHL, and PKH contributed to data analysis. OV, DF, EM, MS, GHL and DBW contributed to the writing of the manuscript.
Funding
This work was supported in part by a grant from the Spanish Government (Grant PID2022-137512NB-I00 funded by MICIU/AEI/10.13039/501100011033 and ERDF/EU) awarded to EM, as well as a SSHRC Insight Grant (Ref. 435–2023-0015) from the Social Sciences and Humanities Research Council of Canada awarded to DBW.
Data availability
Data and experiment code are available on the Open Science Framework at: https://osf.io/h3uyg/?view_only=e14345005e264fc0b6f69fa0a56ef3c4. The MRI scans are available from the corresponding author on reasonable request.
Competing interests
The authors declare no competing interests.
Footnotes
Publisher’s note
Springer Nature remains neutral with regard to jurisdictional claims in published maps and institutional affiliations.
References
- 1.Bar, M. & Neta, M. Humans prefer curved visual objects. Psychol. Sci.17(8), 645–648 (2006). [DOI] [PubMed] [Google Scholar]
- 2.Bertamini, M., Palumbo, L., Gheorghes, T. N. & Galatsidas, M. Do observers like curvature or do they dislike angularity?. Br. J. Psychol.107(1), 154–178. 10.1111/bjop.12132 (2016). [DOI] [PMC free article] [PubMed] [Google Scholar]
- 3.Cotter, K. N., Silvia, P. J., Bertamini, M., Palumbo, L. & Vartanian, O. Curve appeal: Exploring individual differences in preference for curved versus angular objects. i-Perception10.1177/2041669517693023 (2017). [DOI] [PMC free article] [PubMed] [Google Scholar]
- 4.Silvia, P. J. & Barona, C. M. Do people prefer curved objects? Angularity, expertise, and aesthetic preference. Empir. Stud. Arts27(1), 25–42. 10.2190/EM.27.1.b (2009). [Google Scholar]
- 5.Treisman, A. M. & Gelade, G. A feature-integration theory of attention. Cogn. Psychol.12(1), 97–136 (1980). [DOI] [PubMed] [Google Scholar]
- 6.Palumbo, L. & Bertamini, M. The curvature effect: A comparison between preference tasks. Empir. Stud. Arts34, 35–52 (2016). [Google Scholar]
- 7.Hevner, K. Experimental studies of the elements of expression in music. Am. J. Psychol.48(2), 246–268 (1936). [Google Scholar]
- 8.Lundholm, H. The affective tone of lines: Experimental researches. Psychol. Rev.28(1), 43–60 (1921). [Google Scholar]
- 9.Poffenberger, A. T. & Barrows, B. The feeling value of lines. J. Appl. Psychol.8(2), 187–205 (1924). [Google Scholar]
- 10.Ruta, N. et al. Preference for paintings is also affected by curvature. Psychol. Aesth. Creat. Arts17(3), 307–321. 10.1037/aca0000395 (2023). [Google Scholar]
- 11.Aronoff, J. How we recognize angry and happy emotion in people, places, and things. Cross-Cult. Res.40(1), 83–105 (2006). [Google Scholar]
- 12.Dazkir, S. S. & Read, M. A. Furniture forms and their influence on our emotional responses toward interior environments. Environ. Behav.44(5), 722–732 (2012). [Google Scholar]
- 13.Ruta, N., Mastandrea, S., Penacchio, O., Lamaddalena, S. & Bove, G. A comparison between preference judgments of curvature and sharpness in architectural façades. Architect. Sci. Rev.62(2), 171–181. 10.1080/00038628.2018.1558393 (2019). [Google Scholar]
- 14.Shemesh, A. et al. Affective response to architecture–investigating human reaction to spaces with different geometry. Architect. Sci. Rev.60(2), 116–125 (2017). [Google Scholar]
- 15.Van Oel, C. J. & Van den Berkhof, F. D. Consumer preferences in the design of airport passenger areas. J. Environ. Psychol.36, 280–290 (2013). [Google Scholar]
- 16.Gómez-Puerto, G., Munar, E. & Nadal, M. Preference for curvature: A historical and conceptual framework. Front. Hum. Neurosci.10.3389/fnhum.2015.00712 (2016). [DOI] [PMC free article] [PubMed] [Google Scholar]
- 17.Fantz, R. L., & Miranda, S. B. (1975). Newborn infant attention to form of contour. Child Development 224–228. [PubMed]
- 18.Jadva, V., Hines, M. & Golombok, S. Infants’ preferences for toys, colors, and shapes: Sex differences and similarities. Arch. Sex. Behav.39(6), 1261–1273. 10.1007/s10508-010-9618-z (2010). [DOI] [PubMed] [Google Scholar]
- 19.Ebel, S., Kopp, K. & Liebal, K. Object preferences in captive Sumatran orangutans (Pongo abelii). Behav. Process.170, 103993. 10.1016/j.beproc.2019.103993 (2020). [DOI] [PubMed] [Google Scholar]
- 20.Munar, E., Gómez-Puerto, G., Call, J. & Nadal, M. Common visual preference for curved contours in humans and great apes. PLoS ONE10(11), e0141106. 10.1371/journal.pone.0141106 (2015). [DOI] [PMC free article] [PubMed] [Google Scholar]
- 21.Gómez-Puerto, G. et al. Preference for curved contours across cultures. Psychol. Aesth. Creat. Arts12(4), 432–439. 10.1037/aca0000135 (2018). [Google Scholar]
- 22.Chuquichambi, E. G. et al. How universal is preference for visual curvature? A systematic review and meta-analysis. Ann. N.Y. Acad. Sci.1518(1), 151–165. 10.1111/nyas.14919 (2022). [DOI] [PMC free article] [PubMed] [Google Scholar]
- 23.Clemente, A., Penacchio, O., Vila-Vidal, M., Pepperell, R., & Ruta, N. Explaining the curvature effect: Perceptual and hedonic evaluations of visual contour. Psychology of Aesthetics, Creativity, and the Arts (2023).
- 24.Corradi, G. et al. Aesthetic sensitivity to curvature in real objects and abstract designs. Acta Psychol.197, 124–130. 10.1016/j.actpsy.2019.05.012 (2019). [DOI] [PubMed] [Google Scholar]
- 25.Corradi, G., Chuquichambi, E. G., Barrada, J. R., Clemente, A. & Nadal, M. A new conception of visual aesthetic sensitivity. Br. J. Psychol.111(4), 630–658. 10.1111/bjop.12427 (2020). [DOI] [PubMed] [Google Scholar]
- 26.Djebbara, Z. & Kalantari, S. Affordances and curvature preference: The case of real objects and spaces. Ann. N.Y. Acad. Sci.1527, 14–19 (2023). [DOI] [PubMed] [Google Scholar]
- 27.Palumbo, L., Rampone, G. & Bertamini, M. The role of gender and academic degree on preference for smooth curvature of abstract shapes. PeerJ9, e10877 (2021). [DOI] [PMC free article] [PubMed] [Google Scholar]
- 28.Vartanian, O. et al. Preference for curvilinear contour in interior architectural spaces: Evidence from experts and nonexperts. Psychol. Aesth. Creat. Arts13(1), 110 (2019). [Google Scholar]
- 29.Palumbo, L. et al. Visual preference for abstract curvature and for interior spaces: Beyond undergraduate student samples. Psychol. Aesth. Creat. Arts16(4), 577–593. 10.1037/aca0000359 (2022). [Google Scholar]
- 30.Tawil, N., Sztuka, I. M., Pohlmann, K., Sudimac, S. & Kühn, S. The living space: Psychological well-being and mental health in response to interiors presented in virtual reality. Int. J. Environ. Res. Public Health18(23), 12510 (2021). [DOI] [PMC free article] [PubMed] [Google Scholar]
- 31.Tawil, N., Ascone, L. & Kühn, S. The contour effect: Differences in the aesthetic preference and stress response to photo-realistic living environments. Front. Psychol.13, 933344 (2022). [DOI] [PMC free article] [PubMed] [Google Scholar]
- 32.Becker, S. et al. The role of hedonics in the human affectome. Neurosci. Biobehav. Rev.102, 221–241. 10.1016/j.neubiorev.2019.05.003 (2019). [DOI] [PMC free article] [PubMed] [Google Scholar]
- 33.Berridge, K. C. & Kringelbach, M. L. Pleasure systems in the brain. Neuron86, 646–664 (2015). [DOI] [PMC free article] [PubMed] [Google Scholar]
- 34.Skov, M. Sensory liking: How nervous systems assign hedonic value to sensory objects. In The Routledge International Handbook of Neuroaesthetics (eds Skov, M. & Nadal, M.) 31–62 (Routledge, 2022). [Google Scholar]
- 35.Bar, M. & Neta, M. Visual elements of subjective preference modulate amygdala activation. Neuropsychologia45(10), 2191–2200 (2007). [DOI] [PMC free article] [PubMed] [Google Scholar]
- 36.Vartanian, O. et al. Impact of contour on aesthetic judgments and approach-avoidance decisions in architecture. Proc. Natl. Acad. Sci. U S A110, 10446–10453 (2013). [DOI] [PMC free article] [PubMed] [Google Scholar]
- 37.Barrett, L. F., Mesquita, B., Ochsner, K. N. & Gross, J. J. The experience of emotion. Annu. Rev. Psychol.58, 373–403 (2007). [DOI] [PMC free article] [PubMed] [Google Scholar]
- 38.Barrett, L. F. & Wager, T. D. The structure of emotion: Evidence from neuroimaging studies. Curr. Dir. Psychol. Sci.15(2), 79–83 (2006). [Google Scholar]
- 39.Banaei, M., Hatami, J., Yazdanfar, A. & Gramann, K. Walking through architectural spaces: The impact of interior forms on human brain dynamics. Front. Hum. Neurosci.11, 477 (2017). [DOI] [PMC free article] [PubMed] [Google Scholar]
- 40.Yue, X., Pourladian, I. S., Tootell, R. B. & Ungerleider, L. G. Curvature-processing network in macaque visual cortex. Proc. Natl. Acad. Sci. USA111(33), E3467–E3475 (2014). [DOI] [PMC free article] [PubMed] [Google Scholar]
- 41.Yue, X., Robert, S. & Ungerleider, L. G. Curvature processing in human visual cortical areas. NeuroImage222, 117295. 10.1016/j.neuroimage.2020.117295 (2020). [DOI] [PMC free article] [PubMed] [Google Scholar]
- 42.Walther, D. B., Farzanfar, D., Han, S. & Rezanejad, M. The Mid-level Vision Toolbox for computing structural properties of real-world images. Front. Psychol.5, 1140723 (2023). [Google Scholar]
- 43.Walther, D. B. & Shen, D. Nonaccidental properties underlie human categorization of complex natural scenes. Psychol. Sci.25(4), 851–860. 10.1177/0956797613512662 (2014). [DOI] [PMC free article] [PubMed] [Google Scholar]
- 44.Watson, D., Clark, L. A. & Tellegen, A. Development and validation of brief measures of positive and negative affect: The PANAS scales. J. Pers. Soc. Psychol.54(6), 1063 (1988). [DOI] [PubMed] [Google Scholar]
- 45.Farzanfar, D. & Walther, B. Changing what you like: Modifying contour properties shifts aesthetic valuations of scenes. Psychol. Sci.10.1177/09567976231190546 (2023). [DOI] [PubMed] [Google Scholar]
- 46.Wang, L., Mruczek, R. E., Arcaro, M. J. & Kastner, S. Probabilistic maps of visual topography in human cortex. Cerebr. Cortex25(10), 3911–3931 (2015). [DOI] [PMC free article] [PubMed] [Google Scholar]
- 47.Saad, Z. S. & Reynolds, R. C. Suma. Neuroimage62(2), 768–773 (2012). [DOI] [PMC free article] [PubMed] [Google Scholar]
- 48.Peirce, J. W. Understanding mid-level representations in visual processing. J. Vis.15(7), 5–5 (2015). [DOI] [PMC free article] [PubMed] [Google Scholar]
- 49.Zhou, H., Friedman, H. S. & Von Der Heydt, R. Coding of border ownership in monkey visual cortex. J. Neurosci.20(17), 6594–6611 (2000). [DOI] [PMC free article] [PubMed] [Google Scholar]
- 50.Krüger, V., & Sommer, G. Gabor wavelet networks for object representation. Multi-image Analysis 115–128 (2001).
- 51.Coburn, A., Vartanian, O. & Chatterjee, A. Buildings, beauty, and the brain: A neuroscience of architectural experience. J. Cogn. Neurosci.29(9), 1521–1531. 10.1162/jocn_a_01146 (2017). [DOI] [PubMed] [Google Scholar]
- 52.Coutrot, A. et al. Entropy of city street networks linked to future spatial navigation ability. Nature604(7904), 104–110. 10.1038/s41586-022-04486-7 (2022). [DOI] [PubMed] [Google Scholar]
- 53.Damiano, C., Walther, D. B. & Cunningham, W. A. Contour features predict valence and threat judgements in scenes. Sci. Rep.11(1), 1–12. 10.1038/s41598-021-99044-y (2021). [DOI] [PMC free article] [PubMed] [Google Scholar]
- 54.Shemesh, A., Leisman, G., Bar, M. & Grobman, Y. J. A neurocognitive study of the emotional impact of geometrical criteria of architectural space. Architect. Sci. Rev.10.1080/00038628.2021.1940827 (2021). [Google Scholar]
- 55.Hildebrand, G. Origins of Architectural Pleasure (University of California Press, 1999). [Google Scholar]
Associated Data
This section collects any data citations, data availability statements, or supplementary materials included in this article.
Data Availability Statement
Data and experiment code are available on the Open Science Framework at: https://osf.io/h3uyg/?view_only=e14345005e264fc0b6f69fa0a56ef3c4. The MRI scans are available from the corresponding author on reasonable request.