

Abstract
Mavacamten is a selective, allosteric, reversible cardiac myosin inhibitor that has been developed for the treatment of adults with symptomatic obstructive hypertrophic cardiomyopathy (HCM). A population pharmacokinetic (PopPK) model was developed to characterize mavacamten pharmacokinetics (PK) and the variation in mavacamten exposure associated with intrinsic and extrinsic factors. Data from 12 clinical studies (phases 1, 2, and 3) were used. Evaluable participants were those who had at least one mavacamten concentration measurement with associated sampling time and dosing information. The base model included key covariates: body weight, cytochrome P450 isozyme 2C19 (CYP2C19) phenotype with respect to PK, and formulation. The final model was generated using stepwise covariate testing and refinement processes. Simulations were performed to evaluate PK: apparent clearance (CL/F); apparent central and peripheral volumes of distribution; and steady‐state average, trough, and maximum concentrations. Overall, 9244 measurable PK observations from 497 participants were included. A two‐compartment model structure was selected. After stepwise covariate model building and refinement, additional covariates included were: specified mavacamten dose, omeprazole or esomeprazole administration, health/disease status, estimated glomerular filtration rate, fed status, and sex. The final PopPK model accurately characterized mavacamten concentrations. At any given dose, CYP2C19 phenotype was the most influential covariate on exposure parameters (e.g., median CL/F was reduced by 72% in CYP2C19:poor metabolizers compared with the reference participant [CYP2C19:normal metabolizer]). CL/F was also approximately 16% higher in women than in men but lower in participants receiving concomitant omeprazole or esomeprazole (by 33% and 42%, respectively) than in participants not receiving such concomitant therapy.
Study Highlights.
WHAT IS THE CURRENT KNOWLEDGE ON THIS TOPIC?
Mavacamten is a selective, allosteric, reversible cardiac myosin inhibitor that has been developed for the treatment of symptomatic obstructive HCM. It is metabolized by the liver through the cytochrome P450 (CYP) pathway, primarily by the CYP isozyme 2C19 (CYP2C19) and, to a lesser extent, by the CYP3A4 and CYP2C9 isozymes.
WHAT QUESTION DID THIS STUDY ADDRESS?
This study investigated the potential effects of intrinsic and extrinsic covariates on mavacamten PK by developing a population PK model.
WHAT DOES THIS STUDY ADD TO OUR KNOWLEDGE?
The mavacamten PK was well characterized by a linear two‐compartment model with first‐order absorption following a time lag. The most influential covariate on exposure metrics at any given dose was CYP2C19 phenotype (i.e., NM, poor metabolizer, intermediate metabolizer, rapid metabolizer, or ultrarapid metabolizer).
HOW MIGHT THIS CHANGE DRUG DISCOVERY, DEVELOPMENT, AND/OR THERAPEUTICS?
This population PK model is central to the development of a simulation tool for the identification of an optimized echocardiographic‐based dose titration regimen for mavacamten.
INTRODUCTION
Hypertrophic cardiomyopathy (HCM) is a chronic myocardial disease that is largely caused by sarcomere dysfunction and excess myosin–actin cross‐bridging. 1 , 2 It is characterized by left ventricular hypertrophy, accompanied by hypercontractility, impaired relaxation, and increased energy consumption. 3
Epidemiological studies estimate that the majority of patients with HCM have obstructive HCM, 4 which is characterized by left ventricular outflow tract (LVOT) obstruction at rest or on provocation of at least 30 mm Hg. 5 Obstructive HCM may be associated with sudden cardiac death (although uncommon), atrial fibrillation, heart failure, and other cardiovascular comorbidities. 6 , 7 , 8 Moreover, it has been suggested that more severe LVOT obstruction is associated with poorer outcomes, including an increased risk of death. 9
Common signs and symptoms of obstructive HCM include chest pain, palpitations, fatigue, and syncope, all of which can limit physical function and affect the ability to carry out everyday tasks. Obstructive HCM also exerts a toll on relationships, and anxiety and depression are common in patients with this disease. 6 , 8 , 10 The aim of treatment is to manage symptoms, and current guidelines recommend initial pharmacological treatment with non‐vasodilating β‐blockers and non‐dihydropyridine calcium channel blockers (verapamil and diltiazem). 5 , 11 For patients with a poor response to these treatments, disopyramide or septal reduction interventions may be initiated. 5
Mavacamten is a selective, allosteric, reversible cardiac myosin inhibitor that has been developed for the treatment of adults with symptomatic obstructive HCM. It acts by targeting the myosin–actin interactions that play a critical role in HCM pathophysiology. 12 , 13 In the phase 3, randomized, double‐blind, placebo‐controlled, dose‐titrated EXPLORER‐HCM trial (NCT03470545) in patients with symptomatic obstructive HCM, a significantly higher proportion of patients in the mavacamten group than in the placebo group achieved the primary endpoint of an increase in peak oxygen consumption (pVO2) of at least 1.5 mL/kg/min and reduction in New York Heart Association (NYHA) classification of at least one class or an increase in pVO2 of at least 3.0 mL/kg/min without NYHA class increase. 12 Based on these data and on pharmacokinetics (PK) and exposure–response analyses, mavacamten was approved by the US Food and Drug Administration in April 2022 for the treatment of adults with symptomatic obstructive HCM. 14
Previous studies have indicated that mavacamten PK is characterized by a biphasic profile with rapid absorption and a long half‐life (t ½). 14 , 15 Mavacamten is predominantly metabolized in the liver by cytochrome P450 (CYP) isozyme 2C19 (CYP2C19) (74%), with the remainder metabolized via the CYP3A4 (18%) and the CYP2C9 isozymes (8%). 15 , 16 , 17 , 18 In individuals with poor CYP2C19 metabolism (poor metabolizers [PMs]), the exposure to and t ½ of mavacamten is approximately 3‐fold greater than in individuals with normal CYP2C19 metabolism (normal metabolizers [NMs]). 14
It is important to understand fully the intrinsic and extrinsic factors that may affect exposure, because these data can inform mavacamten dose titration guidelines. The objective of this study was to characterize the PK of mavacamten in healthy individuals and in patients with HCM by conducting a population PK (PopPK) analysis to support a model‐based posology recommendation. Covariates assessed to quantify their associated effects on mavacamten PK included CYP2C19 polymorphisms and drug–drug interactions.
MATERIALS AND METHODS
Study population
The mavacamten PopPK analysis was based on pooled data from 12 clinical studies 19 , 20 , 21 , 22 , 23 , 24 , 25 (Table 1): seven phase 1 studies in healthy participants 19 , 20 ; two phase 2 studies in patients with HCM 21 , 23 ; one phase 2 open‐label extension study in patients with obstructive HCM 25 ; one phase 3 study in patients with obstructive HCM 22 ; and one phase 2/3 long‐term extension study in patients with HCM. 24 Study designs for the phase 2 and phase 3 studies have been published elsewhere. 12 , 13 , 26 In all studies, participants were at least 18 years of age and mavacamten was administered orally as a solution, tablets, or capsules.
TABLE 1.
Studies included in the PopPK analysis.
| Study name | Study phase | Study population | Study design | Mavacamten dose or dosage | Mavacamten PK analysis dataset participants, n | Measurable PK observations (excluded observations), n | Measurements below the lower assay limit of quantitation |
|---|---|---|---|---|---|---|---|
| MYK‐461‐002 (NCT02356289) 19 | 1 | Healthy individuals | Randomized, double‐blind, placebo‐controlled SAD | 1, 2, 6, 12, 24, 48 mg | 36 | 723 | 49 |
| MYK‐461‐003 (NCT02480296) 20 | 1 | Healthy individuals | Randomized, double‐blind, placebo‐controlled MAD | 1 mg BID, 3 mg BID, 12.5 mg QD, 18.5 mg QD, 25 mg QD for 28 days (25 mg dose discontinued after 25 days); washout to day 63 | 50 | 3015 (2) | 60 |
| PIONEER‐HCM (NCT02842242) 21 | 2 | Patients with obstructive HCM | 12‐week, open‐label pilot | Part A: starting dose of 10 mg QD (≤ 60 kg) or 15 mg QD (> 60 kg) with dose titration at week 4; Part B: starting dose of 2 mg QD with dose titration at week 4 | 21 | 208 | 20 |
| EXPLORER‐HCM (NCT03470545) 22 | 3 | Patients with obstructive HCM | 30‐week, randomized, double‐blind, placebo‐controlled | 2.5, 5, 10, or 15 mg QD (5 mg QD initially [or placebo] with dose adjustment available at weeks 8 and 14) | 123 | 1179 (3) | 10 |
| MAVERICK‐HCM (NCT03442764) 23 | 2 | Patients with nonobstructive HCM | 16‐week randomized, double‐blind, placebo‐controlled, concentration‐guided | 5 mg QD initially (or placebo); doses titrated at week 6 to achieve one of two target drug concentrations (~200 ng/mL or 500 ng/mL) | 39 | 216 | 19 |
| MAVA‐LTE (NCT03723655) 24 | 2/3 | Patients with obstructive HCM (EXPLORER‐HCM cohort) | 104‐week OLE | 5 mg QD initially (or 2.5 mg if 5 mg deemed too high at end of treatment in EXPLORER); dose adjustment available at weeks 4, 8, 12, and 24 | 122 a | 1414 (2) | 5 |
| PIONEER‐OLE (NCT03496168) 25 | 2 | Patients with obstructive HCM | 104‐week OLE | 5 mg QD initially; dose adjustment available at week 6 (based on week 4 assessment) | 0 a | 95 | 1 |
| MYK‐461‐009 | 1 | Healthy individuals | Randomized, open‐label, single‐dose DDI (verapamil) study | 25 mg | 25 | 343 | 25 |
| MYK‐461‐010 | 1 | Healthy women | Multiple‐dose crossover DDI (oral contraception) study | 25 mg on day 1 and day 2; 15 mg/day on days 3–17 | 13 | 274 | 13 |
| MYK‐461‐011 | 1 | Healthy individuals | Open‐label, single‐dose study in Japanese vs. Caucasian participants | Japanese participants: 5, 15, and 25 mg; Caucasian participants: 25 mg | 28 | 442 | 34 |
| MYK‐461‐012 | 1 | Healthy individuals | Open‐label, single‐dose study of CYP2C19:NMs vs. CYP2C19:PMs | 15 mg | 16 | 280 | 23 |
| MYK‐461‐014 | 1 | Healthy individuals | Randomized, open‐label, single‐dose study of food effect and bioavailability alternative formulations | 15 mg initial capsule (fasted); 15 mg commercial capsule (fasted); 15 mg commercial capsule (fed) | 24 | 1062 | 58 |
| Total: 497 | Total: 9251 (7) b | Total: 317 |
Abbreviations: BID, twice daily; CYP2C19, cytochrome P450 isozyme 2C19; DDI, drug–drug interaction; HCM, hypertrophic cardiomyopathy; LTE, long‐term extension; MAD, multiple ascending dose; NM, normal metabolizer; OLE, open‐label extension; PK, pharmacokinetics; PM, poor metabolizer; PopPK, population pharmacokinetic; QD, once daily; and SAD, single ascending dose.
Participants who previously received mavacamten and went on to enter MAVA‐LTE (n = 138) and participants in the PIONEER‐OLE trial (n = 13) were excluded from the total dataset.
In total, seven observations were excluded, therefore the analysis was conducted based on 9244 records.
In total, 9244 PK observations from 497 participants (192 healthy individuals, 54 patients with nonobstructive HCM, and 251 patients with obstructive HCM) were included in the analysis model (Table 1). Dosing regimens varied between studies, ranging from single oral doses of 1–48 mg to multiple oral dosages of 2–25 mg/day.
Venous blood samples were obtained at various times before and after mavacamten administration, which differed across the individual studies but were accurately recorded (Table S1). Plasma mavacamten concentrations in plasma were determined using a validated assay with a lower limit of quantitation (LLOQ) of 0.2 μg/L. The profile for mean mavacamten plasma concentration versus time after single dose administration in healthy individuals is presented in Supplementary Material Figure S1.
The PopPK analysis population consisted of participants in the studies listed in Table 1 who had received at least one dose of mavacamten and for whom there was at least one mavacamten concentration measurement with associated sampling time and dosing information. Samples without corresponding dosing data were regarded as unevaluable and excluded from the analysis (although retained in the dataset), as were samples with missing time or date information. Concentration samples that were below the LLOQ were retained in the analysis dataset (and comprised <10% of the dataset); participants with no samples above the LLOQ were excluded from the analysis. Actual times (if available) and dates of dose administration were used in the analysis to ensure that, for example, interruptions in dosing were correctly accounted for.
Ethics approval
All studies were conducted in accordance with the ethical principles derived from the Declaration of Helsinki, the Council for International Organizations of Medical Sciences International ethical guidelines for health‐related research involving humans, applicable International Council for Harmonization Good Clinical Practice guidelines, and applicable laws and regulations; ethics approval was obtained from relevant institutional review boards and ethics committees.
PopPK model development
The PopPK model was developed in three steps, as discussed in the following sections. The model code was previously published. 27
Base structural model
A base model was developed to determine the interindividual variability (IIV), residual unexplained variability (RUV), and structural components of the PopPK model.
Exploratory preliminary analyses were conducted before the formal analysis to inform selection of the model structure and to confirm appropriate CYP2C19 phenotype groupings by genotype. Preliminary modeling was conducted in a subset of patients with obstructive HCM (n = 21) and healthy participants (n = 111) to determine influential covariates to be included in the base structural model.
Standard diagnostic plots were used throughout the PK model development to assess the ability of each model to describe the observed data, including observed concentration versus individual predictions and population predictions (PRED), and conditional weighted residuals (CWRES) versus PRED and time after dose.
One‐, two‐, and three‐compartment models were evaluated, with consideration of linear and dose‐dependent elimination and absorption modeled as a first‐order or a zero‐order to first‐order process. The data used were log‐transformed and were fit to the models. IIV in PK model parameters was described by log‐normally distributed random effects. Interindividual random effects were introduced and retained if their inclusion did not cause model instability and their estimates were not close to zero.
Covariate analysis
Three preselected covariates were included for the base structural model: body weight, CYP2C19 phenotype according to the genotype groupings shown in Table S2, and mavacamten formulation (solution or non‐solution [tablet/capsule]). The following covariate effects were assessed based on the results of preliminary analyses: the body weight effect on apparent clearance (CL/F), apparent intercompartmental clearance (Q/F), apparent central volume of distribution (V2/F), and apparent peripheral volume of distribution (V3/F); CYP2C19 effect on CL/F; and drug formulation effect on bioavailability (F) and the absorption rate constant (KA). The effect of body weight was assumed to be the same for CL/F and Q/F (exponent fixed to 0.75) and for V2/F and V3/F (exponent fixed to 1.0), based on prior experience.
Additional covariates considered for the model were baseline age, sex, race, study population (healthy individuals or patients with HCM), fed versus fasted condition, mavacamten dose, body mass index (BMI), lean body weight, resting (LVOT) gradient, NYHA classification, creatinine clearance, estimated glomerular filtration rate (eGFR), alanine aminotransferase (ALT) levels, aspartate aminotransferase (AST) levels, total bilirubin levels, albumin levels, and concomitant medications (omeprazole, esomeprazole, lansoprazole, or pantoprazole). Covariates were assessed for inclusion in the analysis and were eligible if data were available for at least 80% of participants and if there were at least 15 participants in each category for categorical covariates. If covariates had a correlation of greater than 0.5, only one of the correlated covariates was included in the formal analysis (either the covariate with the strongest influence, as determined by exploratory graphical analysis, or the variable that was most meaningful from a clinical, biological, or practical perspective). Baseline values of covariates were used; if missing, they were replaced using values documented at screening or obtained based on other information (e.g., using birth year and study year data to compute age). For covariates that would change with dosing interval, the value used corresponded to the dose record and following observation records. For individual missing continuous demographic covariates, median values of the study population were imputed.
The potential effect of additional covariates on structural model parameters was assessed using a stepwise covariate model (SCM)‐building approach, which included a stepwise forward‐addition and backward‐elimination process, evaluating one covariate at a time. The likelihood‐ratio test was used to evaluate the significance of incorporating fixed effects into or removing fixed effects from the population model based on predefined significance levels. Forward addition required a significance level of p < 0.01, whereas p < 0.001 was used for backward elimination. The influence of continuous and categorical covariates was tested; the significance of these variables on CL/F, V2/F, F, KA, and absorption lag time (ALAG1) was investigated. Covariates included in the base model were not evaluated for removal. Further details on the mathematical structure of the covariate models are provided in Figure S2.
Final PopPK model
The final model was developed by reassessing the IIV model with simplification of poorly estimated covariate effects. Alternative variance–covariance structures for between‐participant variance of the random effects included were evaluated and deemed suitable if they provided a statistically significant (p < 0.001) improvement in the deviance (−2 log‐likelihood [−2LL]) and improved model stability. The final model was also acceptable if there was successful minimization (for gradient methods), if there were no estimates close to a boundary, if there were no unacceptable trends in goodness‐of‐fit plots, and if it allowed for the objective of the analysis to be met.
Model results included a table of parameter estimates, including between‐participant and residual variabilities with relative standard errors (%RSEs) and parameter shrinkage values. Prediction‐corrected visual predictive checks (pcVPCs) were used to evaluate the predictive ability of the final model.
PopPK model application
The reference participant was defined as one for whom all covariates were at their reference values or other appropriate levels; a series of other participants was defined with one or a few covariates changed relative to the reference participant. The reference participant was a male patient with obstructive HCM who weighed 84 kg, was categorized as having a CYP2C19:NM phenotype (wild‐type genotype *1/*1), had an eGFR of 95 mL/min/1.73 m2, and was receiving mavacamten 5 mg once daily without any concomitant medication. To assess differences in PK between strata, simulations were performed to assess the effect of various covariate combinations for a series of different “typical” participants on summary measures of steady‐state exposure: steady‐state average concentration (C avg–SS), steady‐state trough concentration (C trough–SS), and steady‐state maximum concentration (C max–SS). Simulations were performed to illustrate the effect of key covariates singularly or in combination; 500 simulations were conducted for each participant with variability based on modeled IIV.
Statistical software
The analysis datasets were prepared using SAS software (version 9.4). The PopPK model was implemented in NONMEM® (version 7.4), and Perl‐speaks‐NONMEM (version 4.8.1) was used for the facilitation of NONMEM tasks, such as covariate testing (using the SCM‐building tool). Plasma concentration–time data used to build the PK models were analyzed using a first‐order conditional estimation with interaction. Diagnostic plots were created using R software (version 4.0 or higher).
RESULTS
PopPK model development
Base structural model
The PK of mavacamten was best described by a two‐compartment model structure with first‐order absorption following a time lag. The numbers of participants included from the clinical studies are presented in Table S3.
In evaluations of key prespecified covariates in the base model, there were no significant differences in CL/F between participants with CYP2C19*1/*17 (CYP2C19:rapid metabolizer [RM] phenotype) and participants with CYP2C19*1/*1 (CYP2C19:NM phenotype), nor between participants with CYP2C19*2/*17 (CYP2C19:intermediate metabolizer [IM] phenotype) and those with CYP2C19*1/*2 (CYP2C19:IM phenotype). However, CL/F in participants with CYP2C19*1/*2 (CYP2C19:IM phenotype), CYP2C19*2/*2 (CYP2C19:PM phenotype), and CYP2C19*17/*17 (CYP2C19:ultrarapid metabolizer [UM] phenotype) was significantly different from CL/F in those with CYP2C19*1/*1 (CYP2C19:NM phenotype). KA and F were substantially different when using tablet and capsule formulations versus when using a solution formulation.
Goodness‐of‐fit plots for the base model, including concentration profile plots with locally weighted scatterplot smoothing, demonstrated no marked systemic trends. Parameter estimates for the base structural model were all estimated with good precision (Table S4). The shrinkage in random effects was low for CL/F, moderate for V3/F, and high for V2/F and KA.
Covariate analysis
Baseline values of the continuous and categorical covariates that were tested are summarized in Table 2. A diverse population was assessed; the mean age of participants was 49.4 years (range, 18.0–82.0 years), the mean BMI was 27.8 kg/m2 (range 15.3–51.9 kg/m2), the mean eGFR was 94.5 mL/min/1.73 m2 (range, 29.5–148 mL/min/1.73 m2), and the mean creatinine clearance was 115 mL/min (range, 38.6–385 mL/min). Overall, variables eligible for inclusion in the covariate analysis included six continuous variables (dose, lean body weight, creatinine clearance, eGFR, ALT levels, and total bilirubin levels) and 10 categorical variables (formulation [capsule or tablet], race, sex, patient population status [healthy individuals or patients with HCM], baseline NYHA classification, concomitant omeprazole, esomeprazole, lansoprazole, or pantoprazole administration, and fed status). Albumin level was not included in the analysis because data were available for fewer than 80% of participants for this covariate. Concomitant medications were evaluated without regard to the 15‐participant threshold, because the within‐participant comparison (for time receiving and not receiving concomitant medication) would be expected to be more informative than the between‐participant comparison. Age and AST levels were not tested owing to the high correlation with eGFR and ALT levels, respectively. Age, albumin level, concomitant amiodarone administration, AST levels, BMI, and CYP2C9 status did not meet the criteria for formal covariate analysis; however, following graphical analysis to assess any possible effect on mavacamten PK, no marked relationship was found with these covariates (except for some differences in CYP2C9 status effects versus IIV on CL/F [etaCL] and BMI versus etaCL at high values of BMI).
TABLE 2.
Summary statistics of covariates, by participant type.
| Covariate | Healthy individuals (n = 192) | Patients with nonobstructive HCM (n = 54) | Patients with obstructive HCM (n = 251) | Total (N = 497) |
|---|---|---|---|---|
| Continuous covariates, mean (SD) a | ||||
| Age, years | 35.5 (10.5) | 54.7 (14.6) | 58.9 (12.2) | 49.4 (16.2) |
| Body weight, kg | 72.7 (12.2) | 83.7 (16.6) | 87.0 (17.5) | 81.1 (16.9) |
| BMI, kg/m2 | 24.6 (2.85) | 29.4 (5.05) | 29.8 (5.21) | 27.8 (5.07) |
| Lean body weight, kg | 54.8 (9.26) | 55.8 (11.1) | 58.8 (10.9) | 56.9 (10.4) |
| Creatinine clearance, mL/min | 120 (30.2) | 107 (43.5) | 112 (42.5) | 115 (38.6) |
| eGFR, mL/min/1.73 m2 | 106 (16.4) | 84.0 (22.1) | 87.6 (19.3) | 94.5 (20.8) |
| AST, U/L | 20.3 (6.54) | 23.5 (8.64) | 24.6 (20.3) | 22.8 (15.3) |
| ALT, U/L | 20.8 (10.9) | 24.2 (17.1) | 23.8 (13.9) | 22.7 (13.3) |
| Total bilirubin, μmol/L | 0.605 (0.265) | 0.739 (0.358) | 0.601 (0.646) | 0.618 (0.502) |
| Albumin, g/L | 44.6 (1.85) | 44.9 (2.91) | 45.0 (2.93) | 45.0 (2.89) |
| Minimum dose (within individual), mg | 16.2 (9.85) | 4.86 (0.578) | 3.95 (1.97) | 8.80 (8.62) |
| Maximum dose (within individual), mg | 16.9 (10.1) | 8.24 (3.90) | 8.94 (4.02) | 11.9 (8.04) |
| Categorical covariates, n (%) | ||||
| Male sex | 122 (63.5) | 24 (44.4) | 151 (60.2) | 297 (59.8) |
| Race | ||||
| Caucasian | 114 (59.4) | 47 (87.0) | 234 (93.2) | 395 (79.5) |
| Black/African American | 15 (7.8) | 2 (3.7) | 8 (3.2) | 25 (5.0) |
| Asian | 57 (29.7) | 1 (1.9) | 4 (1.6) | 62 (12.5) |
| Other | 3 (1.6) | 0 (0.0) | 1 (0.4) | 4 (0.8) |
| Missing | 3 (1.6) | 4 (7.4) | 4 (1.6) | 11 (2.2) |
| Food status b | ||||
| Fed | 43 (22.4) | 0 (0.0) | 0 (0.0) | 43 (8.7) |
| Fasted | 149 (77.6) | 0 (0.0) | 0 (0.0) | 149 (30.0) |
| Unknown | 0 (0.0) | 54 (100) | 251 (100) | 305 (61.4) |
| Formulation | ||||
| Solution | 36 (18.8) | 0 (0.0) | 0 (0.0) | 36 (7.2) |
| Tablet | 116 (60.4) | 0 (0.0) | 21 (8.4) | 137 (27.6) |
| Capsule | 40 (20.8) | 54 (100) | 230 (91.6) | 324 (65.2) |
| CYP2C19 phenotype | ||||
| NM (*1/*1) | 86 (44.8) | 18 (33.3) | 94 (37.5) | 198 (39.8) |
| EM (*1/*2) | 32 (16.7) | 8 (14.8) | 49 (19.5) | 89 (17.9) |
| RM (*1/*17) | 24 (12.5) | 14 (25.9) | 57 (22.7) | 95 (19.1) |
| PM (*2/*2) | 12 (6.2) | 0 (0.0) | 5 (2.0) | 17 (3.4) |
| *2/*17 | 4 (2.1) | 4 (7.4) | 15 (6.0) | 23 (4.6) |
| UM (*17/*17) | 8 (4.2) | 0 (0.0) | 8 (3.2) | 16 (3.2) |
| Missing | 26 (13.5) | 10 (18.5) | 23 (9.2) | 59 (11.9) |
| CYP2C9 genotype | ||||
| *1/*1 | 64 (33.3) | 24 (44.4) | 131 (52.2) | 219 (44.1) |
| *1/*2 | 14 (7.3) | 11 (20.4) | 62 (24.7) | 87 (17.5) |
| *1/*3 | 8 (4.2) | 12 (22.2) | 31 (12.4) | 51 (10.3) |
| *2/*2 | 2 (1.0) | 0 (0.0) | 3 (1.2) | 5 (1.0) |
| *2/*3 | 3 (1.6) | 0 (0.0) | 2 (0.8) | 5 (1.0) |
| Missing | 101 (52.6) | 7 (13.0) | 22 (8.8) | 130 (26.2) |
| NYHA classification | ||||
| I | 0 (0.0) | 0 (0.0) | 8 (3.2) | 8 (1.6) |
| II | 0 (0.0) | 42 (77.8) | 173 (68.9) | 215 (43.3) |
| III | 0 (0.0) | 12 (22.2) | 70 (27.9) | 82 (16.5) |
| Unknown | 192 (100) | 0 (0.0) | 0 (0.0) | 192 (38.6) |
| Concomitant medication | ||||
| Omeprazole b | 0 (0.0) | 0 (0.0) | 6 (2.4) | 6 (1.2) |
| Esomeprazole b | 0 (0.0) | 0 (0.0) | 6 (2.4) | 6 (1.2) |
| Lansoprazole b | 0 (0.0) | 5 (9.3) | 11 (4.4) | 16 (3.2) |
| Pantoprazole b | 0 (0.0) | 7 (13.0) | 43 (17.1) | 50 (10.1) |
| Amiodarone b | 0 (0.0) | 2 (3.7) | 12 (4.8) | 14 (2.8) |
Abbreviations: ALT, alanine aminotransferase; AST, aspartate aminotransferase; BMI, body mass index; CYP2C19, cytochrome P450 isozyme 2C19; CYP2C9, cytochrome P450 isozyme 2C9; eGFR, estimated glomerular filtration rate; EM, extensive metabolizer; HCM, hypertrophic cardiomyopathy; NM, normal metabolizer; NYHA, New York Heart Association; PM, poor metabolizer; RM, rapid metabolizer; SD, standard deviation; and UM, ultrarapid metabolizer.
The first available value was used, except for the maximum and minimum dose per participant.
The time‐varying covariate indicated was true at least once; therefore, a participant was considered to be fed or to have taken a concomitant medication if at any time they were fed or administered a concomitant medication.
In SCM building, the following covariate effects were included in the forward‐addition step: ALT levels, eGFR, omeprazole administration, esomeprazole administration, health/disease status, and sex, which had significant effects on CL; mavacamten dose, fed status, sex, and tablet formulation, which had significant effects on F; mavacamten dose and fed status, which had significant effects on KA; and mavacamten dose, which had a significant effect on ALAG1. The backward‐elimination step resulted in the removal of the following covariate effects: ALT level effect on CL/F, and tablet formulation effect on F.
The structural model was parameterized in terms of CL/F, Q/F, V2/F, V3/F, KA, F, and ALAG1. RUV was described by a log‐normal model, and IIV was included on structural model parameters and on the variance of RUV. The following parameter–covariate relations were retained in the final model:
CL/F ~ body weight, CYP2C19 phenotype (PM, IM, RM, and UM versus NM), eGFR, participant type (healthy individual versus patient with HCM), sex (female versus male), and concomitant CYP2C19 inhibitors (omeprazole and esomeprazole)
V2/F ~ body weight
Q/F ~ body weight
V3/F ~ body weight
KA ~ dose amount, formulation (solution versus tablet/capsule), and fed status
F ~ dose amount, formulation (solution versus tablet/capsule), sex, and fed status
ALAG1 ~ dose amount.
Final PopPK model
After completion of the SCM process, further model refinements were conducted to obtain the final model. First, the healthy (fed) participant effect on KA was removed because it was poorly estimated (%RSE = 118) and was not statistically significant at the p < 0.01 level (increase of −5.4 in the deviance). Second, despite the effect of CYP2C19:RM phenotype on CL/F not being included after the SCM process, the effect of CYP2C19:RM phenotype was estimated. Finally, owing to the high residual error associated with study MYK‐461‐014, the errors for the data from this study were estimated separately, leading to a reduction in the deviance of 153.18 points. Furthermore, addition of covariance between the IIVs of CL/F, V2/F, and V3/F reduced the deviance by a further 95.14 points. These reductions in the deviance were highly significant (p < 0.001).
Sensitivity tests were performed on the body weight exponents for CL/F, Q/F, V2/F, and V3/F. A model with predefined fixed allometric exponents on both CL/F and volume parameters (0.75 and 1.0, respectively) did not converge successfully. Subsequently, the allometric coefficients on CL/F and volume parameters were estimated to be 0.434 and 0.712, respectively; however, the large difference from the standard allometric exponent for CL/F (0.75) resulted in rejection of the model with the estimated allometric exponents.
The parameter estimates and covariate effect on model parameters for the final PopPK model are summarized in Table 3 and Figure 1, respectively; the full list of estimates is presented in Table S5. All parameters were estimated with good precision, except for the effect of CYP2C19:RM phenotype on CL/F. However, although the %RSE for the effect of CYP2C19:RM phenotype on CL/F was high, the magnitude of imprecision was small (a decrease of 0.2% in CL/F). Overall, the shrinkage in the random effects of the final model was low (less than 1%) for CL/F and higher for other PK parameters. The log‐normal models for IIV were adequate, as demonstrated by distributions of log‐transformed random effects that were approximately normally distributed. Moreover, the CWRES followed an approximately normal distribution.
TABLE 3.
Estimated structural model parameters (final model, reference participant).
| Parameter | Estimate | %RSE |
|---|---|---|
| CL/F | 0.914 L/h | 3 |
| V2/F | 6.63 L | 14 |
| V3/F | 252 L | 2 |
| Q/F | 16.3 L/h | 4 |
| KA | 0.301 h−1 | 25 |
| ALAG1 | 0.192 h | 5 |
| F | 1 (fixed) | – |
Note: Parameter values were estimated in the log‐domain and exponentiated to present values in the natural scale.
Abbreviations: %RSE, relative standard error; ALAG1, absorption lag time; CL/F, apparent clearance; F, relative bioavailability; KA, absorption rate constant; Q/F, apparent intercompartmental clearance; V2/F, apparent central volume of distribution; and V3/F, apparent peripheral volume of distribution.
FIGURE 1.
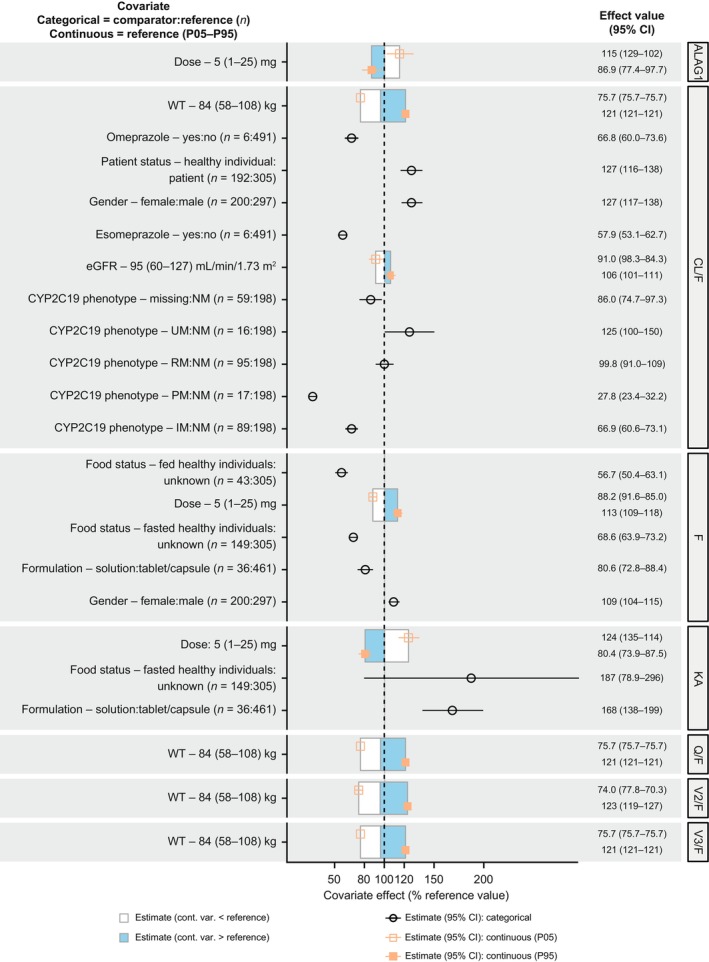
Covariate effects on model parameters. The effect of WT on CL/F and Q/F was fixed to 0.75 (allometric scaling constant). ALAG1, absorption lag time; CI, confidence interval; CL/F, apparent clearance; cont., continuous; CYP2C19, cytochrome P450 isozyme 2C19; eGFR, estimated glomerular filtration rate; F, relative bioavailability; IM, intermediate metabolizer; KA, absorption rate constant; P05, 5th percentile; P95, 95th percentile; PM, poor metabolizer; Q/F, apparent intercompartmental clearance; RM, rapid metabolizer; UM, ultrarapid metabolizer; V2/F, apparent central volume of distribution; V3/F, apparent peripheral volume of distribution; var., variable; and WT, body weight.
Goodness‐of‐fit plots for the final model are shown in Figure S3; no marked systematic trends were seen in the residual diagnostic plots. A pcVPC demonstrated that the PopPK model predicted the observed median, and the 5th and 95th percentiles of observed mavacamten concentrations with good accuracy. Figure S4 presents examples of pcVPC from data from weeks 30 and 38 of EXPLORER‐HCM, and for all participants in the present study versus time after mavacamten dose.
PopPK model application
In PopPK model simulations, several trends were found for the effects of covariate combinations on mavacamten exposure parameters. Forest plots presenting the effects of covariates on C avg–SS, C trough–SS, and C max–SS for “typical” participants versus those for a reference participant, are presented in Figure 2.
FIGURE 2.
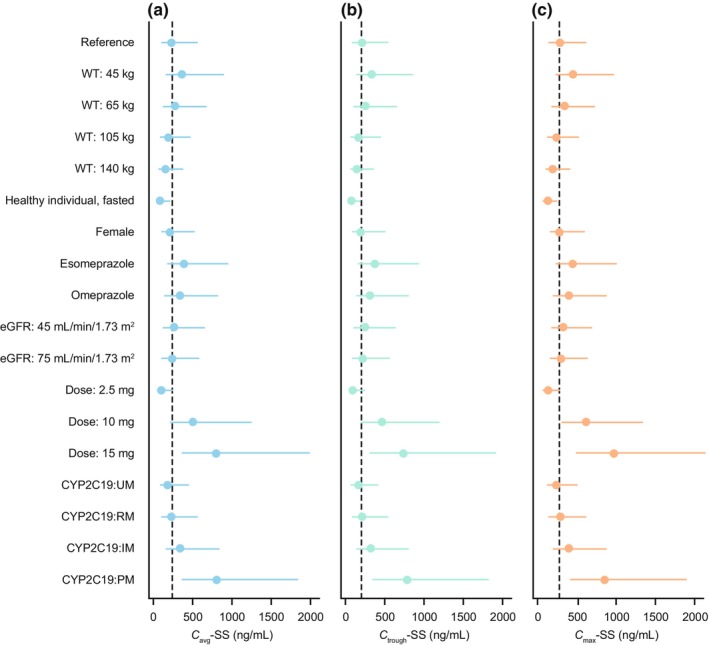
Forest plots for mavacamten (a) C avg–SS, (b) C trough–SS, and (c) C max–SS (5 mg reference dose). For each data point, the dot is the median value, and the line is the interval between 5th and 95th percentiles. The dashed vertical lines show the median value for the reference participant. The reference participant was a male patient with obstructive HCM, weighing 84 kg, with a CYP2C19:NM phenotype (wild‐type *1/*1), with an eGFR of 95 mL/min/1.73 m2, and without any concomitant medication who was receiving mavacamten 5 mg once daily. C avg–SS, steady‐state average concentration; C max–SS, steady‐state maximum concentration; C trough–SS, steady‐state trough concentration; CYP2C19, cytochrome P450 isozyme 2C19; eGFR, estimated glomerular filtration rate; HCM, hypertrophic cardiomyopathy; IM, intermediate metabolizer; NM, normal metabolizer; PM, poor metabolizer; RM, rapid metabolizer; UM, ultrarapid metabolizer; and WT, body weight.
The effects of intrinsic covariates on mavacamten PK parameters were as follows: CL/F was lower in CYP2C19:PMs (by 72%) and IMs (by 33%) than in NMs, and higher in UMs (by 25%) than in NMs. Additionally, CL/F was higher in female participants than in male participants (by approximately 16%), and higher in healthy (fasted) individuals than in patients with obstructive HCM (by approximately 85%). CL/F and V2/F were higher in individuals with higher body weight than in those with lower body weight.
The effects of extrinsic covariates on mavacamten PK parameters were as follows: CL/F was lower in patients taking concomitant omeprazole or esomeprazole than in those not taking them (by approximately 33% and approximately 42%, respectively); F was lower in healthy individuals (under fasted or fed conditions) than in patients with HCM, and lower for solution than for tablet formulation; KA was faster for solution formulation (than for tablet formulation) and under fed conditions (than under fasted conditions); KA decreased with increasing mavacamten dose.
Consistent with the metabolic profile of mavacamten and results from a clinical pharmacology study that showed an approximate 3‐fold increase in exposure and t ½ in CYP2C19:PMs compared with CYP2C19:NMs, 14 at any given dose, CYP2C19 phenotype was the most influential covariate on exposure parameters.
DISCUSSION
The mavacamten PopPK model presented in this study was constructed using data from 12 individual clinical studies involving healthy individuals and patients with HCM. The PK of mavacamten following administration of single oral doses in the range of 1–48 mg or multiple oral dosages in the range of 2–25 mg/day to healthy individuals and patients with HCM was well characterized by a two‐compartment model with first‐order absorption and elimination.
The final PopPK model included the effects of body weight on CL/F, Q/F, V2/F, and V3/F; CYP2C19 phenotype on CL/F; eGFR on CL/F; health status on CL/F; omeprazole administration on CL/F; esomeprazole administration on CL/F; sex on CL/F and F; solution formulation on KA and F; dose level on ALAG1, F, and KA; and fed status (data available only for healthy participants) on KA and F. Notably, the shrinkage on CL/F in this model was low (less than 1%), indicating that it can be used to simulate accurate estimates of CL/F.
In general, all diagnostics indicated that the final PopPK model characterized mavacamten concentration data well, including the associated variability, across studies included in the analysis. Diagnostic plots and model evaluations showed adequate model performance with precise parameter estimates. Therefore, the model was deemed to be appropriate for simulation‐based assessments to investigate the impact of covariates, including alternative dosing regimens, on PK model parameters and exposure. As such, the model could be used alongside an exposure‐response model to explore and inform titration regimens for mavacamten. 28 , 29
Simulations to evaluate the impact of individual and combined covariates on PK showed several interesting trends in median CL/F, V2/F, and V3/F across study populations (healthy individuals versus patients with HCM), body weight, CYP2C19 phenotype, omeprazole administration, and esomeprazole administration. It is perhaps not surprising that CYP2C19 had the most significant impact on mavacamten PK because it has been shown that this isozyme is responsible for approximately 74% of mavacamten metabolism. Indeed, mavacamten exposure and t ½ increased by approximately 3‐fold in CYP2C19:PMs compared with in CYP2C19:NMs in a clinical pharmacology study, correlating well with the 3.6‐fold increase in C avg–SS found using the model. 14 Furthermore, a physiologically‐based PK model was used to assess the effect of CYP2C19 inducers and inhibitors on mavacamten PK in a healthy population. 30 This model demonstrated that moderate reductions in mavacamten exposure were predicted with a strong CYP2C19 inducer in all CYP2C19 phenotypes, thus consistent with the expected effect of CYP2C19 on mavacamten exposure observed in this study. However, steady‐state area under the plasma concentration–time curve and maximum plasma concentrations were found to be weakly (or not) affected by a strong CYP2C19 inhibitor in the physiologically‐based PK model across all CYP2C19 phenotypes except for UMs. 30 Although eGFR was identified as a statistically significant covariate in the model, the effects of this covariate were minimal, accounting for C avg–SS differences of 1.05‐fold and 1.17 fold relative to the reference participant (eGFR, 95 mL/min/1.73 m2) for participants with eGFR of 75 mL/min/1.73 m2 and those with eGFR of 45 mL/min/1.73 m2, respectively. Less than 3% of intact mavacamten excretion is by renal elimination; therefore, the impact of changes to eGFR on mavacamten exposure are not expected to be substantial. CL/F was higher in female participants than in male participants and in healthy individuals than in patients with obstructive HCM. The differences in CL/F found between healthy individuals and patients with obstructive HCM indicate that there may be underlying physiological differences in PK between these populations; however, this finding is not fully understood. There was no significant effect of age or race on mavacamten PK parameters. Of note, there are differences in other covariates, for example, differences in CYP2C19 genotype frequency, which may affect dosing considerations on a population level. However, the individual dose titration regimen based on the clinical response measured by echocardiography all but ensures dose optimization for each patient.
A strength of this study was the incorporation of mavacamten dosing information from various clinical studies, including data from phase 1, 2, and 3 studies. Moreover, a broad population with diverse characteristics was assessed. These results build on the current evidence available from previous investigations of drug–drug interactions and the effects of CYP2C19 genotype on mavacamten PK. 30 There were limitations associated with this analysis. Substantial variability remains regarding the differences found between healthy individuals and patients with obstructive HCM. In this analysis, confounding effects due to the unknown fed/fasted status of participants may have had an impact on absorption. Finally, there were insufficient data to perform a robust analysis of the effects of CYP2C9 and CYP3A4 isozymes, which are understood to have a small role (approximately 8% and 18%, respectively) in mavacamten metabolism.
In conclusion, the PK of mavacamten was well characterized by a linear, two‐compartment model with first‐order absorption following a time lag. The model was deemed to be appropriate for simulation‐based assessments to investigate the impact of covariates on PK model parameters and exposure measures. Simulations demonstrated the effects of intrinsic and extrinsic factors on exposure parameters such as median CL/F, V2/F, and V3/F. CYP2C19 phenotype had the most substantial effect on mavacamten exposure parameters.
AUTHOR CONTRIBUTIONS
All of the authors had full access to all of the data in the study and take responsibility for the integrity of the data and the accuracy of the data analysis. P.C., V.P., D.H.S., S.M., N.T., H.B., J.D.S., D.D.G., A.J.S., M.P., and A.R. wrote the manuscript with support from Medical Writers (funded by Bristol Myers Squibb). P.C., V.P., S.M., N.T., H.B., J.D.S., A.J.S., M.P., and A.R. designed the research. P.C., D.H.S., and D.D.G performed the research. P.C., D.H.S., and D.D.G analyzed the data.
FUNDING INFORMATION
The study was supported by MyoKardia, Inc., a wholly owned subsidiary of Bristol Myers Squibb.
CONFLICT OF INTEREST STATEMENT
P.C. and D.H.S. are employees of Certara, Inc., which received consulting fees from MyoKardia, Inc., a wholly owned subsidiary of Bristol Myers Squibb. S.M., N.T., H.B., and A.J.S. are employees of Bristol Myers Squibb and own stocks in Bristol Myers Squibb. V.P., J.D.S., M.P., and A.R. were employees of Bristol Myers Squibb when the study was conducted. D.D.G. is an employee of Daniel Gretler Consulting, which received consulting fees from MyoKardia, Inc., a wholly owned subsidiary of Bristol Myers Squibb.
Supporting information
Appendix S1.
ACKNOWLEDGMENTS
We would like to acknowledge the patients and their families who made this study possible, and the clinical study teams who participated. All authors contributed to and approved the manuscript; writing and editorial assistance was provided by Tami Stevenson of Lumanity, London, UK, and Kate Ward of Oxford PharmaGenesis, Oxford, UK, and was funded by Bristol Myers Squibb.
Chang P, Perera V, Salinger DH, et al. Characterization of mavacamten pharmacokinetics in patients with hypertrophic cardiomyopathy to inform dose titration. CPT Pharmacometrics Syst Pharmacol. 2024;13:1462‐1475. doi: 10.1002/psp4.13197
Peter Chang and Vidya Perera co‐lead authors and contributed equally to this work.
REFERENCES
- 1. Ommen SR, Semsarian C. Hypertrophic cardiomyopathy: a practical approach to guideline directed management. Lancet. 2021;398:2102‐2108. doi: 10.1016/s0140-6736(21)01205-8 [DOI] [PubMed] [Google Scholar]
- 2. Garfinkel AC, Seidman JG, Seidman CE. Genetic pathogenesis of hypertrophic and dilated cardiomyopathy. Heart Fail Clin. 2018;14:139‐146. doi: 10.1016/j.hfc.2017.12.004 [DOI] [PMC free article] [PubMed] [Google Scholar]
- 3. Lehman SJ, Crocini C, Leinwand LA. Targeting the sarcomere in inherited cardiomyopathies. Nat Rev Cardiol. 2022;19:353‐363. doi: 10.1038/s41569-022-00682-0 [DOI] [PMC free article] [PubMed] [Google Scholar]
- 4. Maron MS, Olivotto I, Zenovich AG, et al. Hypertrophic cardiomyopathy is predominantly a disease of left ventricular outflow tract obstruction. Circulation. 2006;114:2232‐2239. doi: 10.1161/circulationaha.106.644682 [DOI] [PubMed] [Google Scholar]
- 5. Ommen SR, Mital S, Burke MA, et al. 2020 AHA/ACC guideline for the diagnosis and treatment of patients with hypertrophic cardiomyopathy: a report of the American College of Cardiology/American Heart Association joint committee on clinical practice guidelines. Circulation. 2020;142:e558‐e631. doi: 10.1161/cir.0000000000000937 [DOI] [PubMed] [Google Scholar]
- 6. Elliott PM, Gimeno JR, Tomé MT, et al. Left ventricular outflow tract obstruction and sudden death risk in patients with hypertrophic cardiomyopathy. Eur Heart J. 2006;27:1933‐1941. doi: 10.1093/eurheartj/ehl041 [DOI] [PubMed] [Google Scholar]
- 7. Butzner M, Sarocco P, Maron MS, et al. Characteristics of patients with obstructive hypertrophic cardiomyopathy in real‐world community‐based cardiovascular practices. Am J Cardiol. 2022;174:120‐125. doi: 10.1016/j.amjcard.2022.03.023 [DOI] [PubMed] [Google Scholar]
- 8. Jain SS, Li SS, Xie J, et al. Clinical and economic burden of obstructive hypertrophic cardiomyopathy in the United States. J Med Econ. 2021;24:1115‐1123. doi: 10.1080/13696998.2021.1978242 [DOI] [PubMed] [Google Scholar]
- 9. Sorajja P, Nishimura RA, Gersh BJ, et al. Outcome of mildly symptomatic or asymptomatic obstructive hypertrophic cardiomyopathy: a long‐term follow‐up study. J Am Coll Cardiol. 2009;54:234‐241. doi: 10.1016/j.jacc.2009.01.079 [DOI] [PubMed] [Google Scholar]
- 10. Zaiser E, Sehnert AJ, Duenas A, Saberi S, Brookes E, Reaney M. Patient experiences with hypertrophic cardiomyopathy: a conceptual model of symptoms and impacts on quality of life. J Patient Rep Outcomes. 2020;4:102. doi: 10.1186/s41687-020-00269-8 [DOI] [PMC free article] [PubMed] [Google Scholar]
- 11. Maron BJ, Desai MY, Nishimura RA, et al. Management of hypertrophic cardiomyopathy: JACC state‐of‐the‐art review. J Am Coll Cardiol. 2022;79:390‐414. doi: 10.1016/j.jacc.2021.11.021 [DOI] [PubMed] [Google Scholar]
- 12. Olivotto I, Oreziak A, Barriales‐Villa R, et al. Mavacamten for treatment of symptomatic obstructive hypertrophic cardiomyopathy (EXPLORER‐HCM): a randomised, double‐blind, placebo‐controlled, phase 3 trial. Lancet. 2020;396:759‐769. doi: 10.1016/s0140-6736(20)31792-x [DOI] [PubMed] [Google Scholar]
- 13. Ho CY, Mealiffe ME, Bach RG, et al. Evaluation of mavacamten in symptomatic patients with nonobstructive hypertrophic cardiomyopathy. J Am Coll Cardiol. 2020;75:2649‐2660. doi: 10.1016/j.jacc.2020.03.064 [DOI] [PubMed] [Google Scholar]
- 14. MyoKardia, Inc . CAMZYOS™ (mavacamten) full prescribing information. https://www.accessdata.fda.gov/drugsatfda_docs/label/2022/214998s000lbl.pdf Accessed February 8, 2023.
- 15. Grillo MP, Erve JCL, Dick R, et al. In vitro and in vivo pharmacokinetic characterization of mavacamten, a first‐in‐class small molecule allosteric modulator of beta cardiac myosin. Xenobiotica. 2019;49:718‐733. doi: 10.1080/00498254.2018.1495856 [DOI] [PubMed] [Google Scholar]
- 16. Sychterz C, Chang M, Perera V, et al. Population‐based pharmacokinetic‐informed proposed posology of mavacamten: CYP2C19 polymorphism in simulated CYP2C19 & CYP3A4 inhibition [abstract]. Clin Pharmacol Drug Dev. 2022;11:1‐112. doi: 10.1002/cpdd.1151 [DOI] [PubMed] [Google Scholar]
- 17. Perera V, Gretler D, Seroogy JD, et al. Pharmacokinetic drug‐drug interaction study of mavacamten with verapamil in healthy subjects [abstract]. Clin Pharmacol Drug Dev. 2022;11:1‐112. doi: 10.1002/cpdd.1151 [DOI] [PubMed] [Google Scholar]
- 18. Chiang M, Sychterz C, Perera V, et al. Population‐based pharmacokinetic‐informed proposed posology of mavacamten: CYP2C19 polymorphism in simulated CYP2C19 induction [abstract]. Clin Pharmacol in Drug Dev. 2022;11:1‐112. doi: 10.1002/cpdd.1151 [DOI] [Google Scholar]
- 19. MyoKardia, Inc . NCT02356289. Single ascending dose study of MYK‐461 in healthy volunteers. https://clinicaltrials.gov/ct2/show/NCT02356289 Accessed November 7, 2022.
- 20. MyoKardia, Inc . NCT02480296. Safety, tolerability, pharmacokinetics and pharmacodynamics of multiple ascending oral doses of MYK‐461 in healthy volunteers. https://clinicaltrials.gov/ct2/show/NCT02480296 Accessed November 7, 2022.
- 21. MyoKardia, Inc . NCT02842242. A phase 2 open‐label pilot study evaluating MYK‐461 in subjects with symptomatic hypertrophic cardiomyopathy and left ventricular outflow tract obstruction (PIONEER‐HCM). https://clinicaltrials.gov/ct2/show/NCT02842242 Accessed November 7, 2022.
- 22. MyoKardia, Inc . NCT03470545. Clinical study to evaluate mavacamten (MYK‐461) in adults with symptomatic obstructive hypertrophic cardiomyopathy (EXPLORER‐HCM). https://clinicaltrials.gov/ct2/show/NCT03470545 Accessed November 7, 2022.
- 23. MyoKardia, Inc . NCT03442764. A phase 2 study of mavacamten in adults with symptomatic non‐obstructive hypertrophic cardiomyopathy (nHCM) (MAVERICK‐HCM). https://clinicaltrials.gov/ct2/show/NCT03442764 Accessed November 7, 2022.
- 24. Bristol Myers Squibb . NCT03723655. A long‐term safety extension study of mavacamten in adults who have completed MAVERICK‐HCM or EXPLORER‐HCM. https://clinicaltrials.gov/ct2/show/NCT03723655 Accessed November 7, 2022.
- 25. Bristol‐Myers Squibb . NCT03496168. Extension study of mavacamten (MYK‐461) in adults with symptomatic obstructive hypertrophic cardiomyopathy previously enrolled in PIONEER (PIONEER‐OLE). https://clinicaltrials.gov/ct2/show/NCT03496168 Accessed November 7, 2022.
- 26. Heitner SB, Jacoby D, Lester SJ, et al. Mavacamten treatment for obstructive hypertrophic cardiomyopathy: a clinical trial. Ann Intern Med. 2019;170:741‐748. doi: 10.7326/m18-3016 [DOI] [PubMed] [Google Scholar]
- 27. Wang W, Hallow KM, James DA. A tutorial on RxODE: simulating differential equation pharmacometric models in R. CPT Pharmacometrics Syst Pharmacol. 2016;5:3‐10. doi: 10.1002/psp4.12052 [DOI] [PMC free article] [PubMed] [Google Scholar]
- 28. European Medicines Agency . Assessment report. CAMZYOS (mavacamten). 2023. https://www.ema.europa.eu/en/documents/assessment‐report/camzyos‐epar‐public‐assessment‐report_en.pdf Accessed February 27, 2024
- 29. Center for Drug Evaluation and Research . Clinical pharmacology review. Mavacamten. 2022. https://www.accessdata.fda.gov/drugsatfda_docs/nda/2022/214998Orig1s000ClinPharmR.pdf Accessed February 27, 2024
- 30. Chiang M, Sychterz C, Perera V, et al. Physiologically based pharmacokinetic modeling and simulation of mavacamten exposure with drug‐drug interactions from CYP inducers and inhibitors by CYP2C19 phenotype. Clin Pharmacol Ther. 2023;114:922‐932. doi: 10.1002/cpt.3005 [DOI] [PubMed] [Google Scholar]
Associated Data
This section collects any data citations, data availability statements, or supplementary materials included in this article.
Supplementary Materials
Appendix S1.