

Abstract
Cotadutide is a dual glucagon‐like peptide‐1 (GLP‐1)/glucagon receptor agonist. Gastrointestinal adverse effects are known to be associated with GLP‐1 receptor agonism and can be mitigated through tolerance development via a gradual up‐titration. This analysis aimed to characterize the relationship between exposure and nausea incidence and to optimize titration schemes. The model was developed with pooled data from cotadutide‐administrated studies. Three different modeling approaches, proportional odds (PO), discrete‐time Markov, and two‐stage discrete‐time Markov models, were employed to characterize the exposure–nausea relationship. The severity of nausea was modeled as different states (non‐nausea, mild, and moderate/severe). The most appropriate model was selected to perform the covariate analysis, and the final covariate model was used to simulate the nausea event rates for various titration scenarios. The two Markov models demonstrated comparable performance and were better than the PO model. The covariate analysis was conducted with the standard Markov model for operational simplification and identified disease indications (NASH, obesity) and sex as covariates on Markov parameters. The simulations indicated that the biweekly titration with twofold dose escalation is superior to other titration schemes with a relatively low predicted nausea event rate at 600 μg (25%) and a shorter titration interval (8 weeks) to reach the therapeutic dose. The model can be utilized to optimize starting dose and titration schemes for other therapeutics in clinical trials to achieve an optimal risk–benefit balance and reach the therapeutic dose with minimal titration steps.
Study Highlights.
WHAT IS THE CURRENT KNOWLEDGE ON THE TOPIC?
Gastrointestinal adverse effects (nausea and/or vomiting) are known to be associated with GLP‐1 receptor agonism and can be mitigated through tolerance development via a gradual up‐titration.Quantitative relationship between drug exposure and incidence of nausea is incompletely understood.
WHAT QUESTION DID THIS STUDY ADDRESS?
How can the pharmacokinetics/adverse events (PK/AE) modeling support the optimization of titration schemes for therapeutics with potential tolerability issues with the aim of achieving an optimal risk–benefit balance (incidence of AEs/dropout rates vs. titration intervals)?
WHAT DOES THIS STUDY ADD TO OUR KNOWLEDGE?
The relationship between cotadutide exposure and incidence of nausea was quantitatively studied using a standard Markov modeling approach. Several factors were found to affect the probability of nausea (disease indication and sex).
HOW MIGHT THIS CHANGE DRUG DISCOVERY, DEVELOPMENT, AND/OR THERAPEUTICS?
The model can be utilized to optimize starting dose and titration schemes for other therapeutics in clinical trials with the aim of achieving an optimal risk–benefit balance and reaching the therapeutic dose quickly.
INTRODUCTION
Cotadutide is a 30‐amino acid linear single‐chain peptide and a synthetic analog of the human hormone glucagon, which has been modified to have a balanced activity for both glucagon‐like peptide‐1 (GLP‐1) and glucagon (GCG) receptors. GLP‐1 receptor stimulates insulin secretion, delays gastric emptying, inhibits GCG production, and reduces appetite, while glucagon receptor (GCGR) agonists increase blood glycemia, energy expenditure, and hepatic fatty acid oxidation. 1 , 2 , 3
Drug‐related adverse events (AEs) such as nausea and vomiting have been reported in clinical studies due to the impact of GLP‐1 activation on gastrointestinal motility, 4 , 5 which are common gastrointestinal‐related adverse events for most GLP‐1 receptor agonists. 5 , 6 GLP‐1 agonists absorbed more slowly can be initially administered at their therapeutic dose. 7 An approach of gradual dose escalation has been employed with short‐acting (T max < 24 h) GLP‐1 agonists to foster tolerance in patients. 7 Thus, to reduce the gastrointestinal AEs, the target dose of cotadutide has to be reached by a gradual up‐titration to allow for the development of gastrointestinal tolerance. An aggressive titration or large dose escalation during titration may result in severe AEs and then lead to discontinuations for participants in clinical studies, and therefore, slower titration and/or lower dose escalation are adopted to achieve better tolerability in participants. 8 , 9 , 10 , 11
Pharmacokinetic (PK) and pharmacodynamic (PD) analyses, along with AE modeling, are increasingly utilized to establish the relationship between drug exposure, dosage, and PD responses. These analyses are crucial for informed decision‐making on dose selection and dosing regimens. Understanding the gastrointestinal AEs (primarily nausea/vomiting) induced by cotadutide is particularly beneficial for optimizing titration schemes in late‐phase studies. The optimized titration scheme is expected to reduce the prevalence of nausea/vomiting (NV) and shorten the titration interval (reduce the titration burden to participants). To this end, several potential PK/NV model structures can be utilized to fulfill the analysis, including logistic regression, proportional odds (PO) model, and discrete‐time Markov model. Logistic regression has been largely adopted to understand the drug impact on categorical adverse events/outcomes. 12 , 13 Later, the proportional odds (PO) model was thus introduced in an exposure–response analysis for analgesic drug trials to predict pain scores at more than two levels considering the time component and independent variables. 14 To understand the transition between states (mild to moderate) of an adverse event, discrete‐time Markov models provide a robust framework for understanding complex PK/PD relationships and are especially useful when dealing with systems involving sequential and interdependent events. 15 , 16 , 17
This study aimed to develop a PK/NV model to characterize the relationship between cotadutide exposure and the incidence of nausea or vomiting and to identify potential covariates on the NV occurrence with cotadutide clinical data. Initially, exploratory data analysis was performed for nausea and vomiting to evaluate the feasibility of model development. Subsequent modeling analysis was contingent upon the presence of a clear dose–response relationship.
METHODS
Study data included in analysis
The PK/NV analysis for cotadutide was based on the data from four completed clinical studies of cotadutide. The clinical studies were selected for the following reasons: (1) diverse titration schemes, (2) an apparent trend between exposure/dose and the incidence of nausea/vomiting, (3) a large number of participants to inform covariates, and (4) multiple disease indications (including participants with type 2 diabetes mellitus (T2DM), nonalcoholic steatohepatitis (NASH) that is now renamed as metabolic dysfunction‐associated steatohepatitis (MASH), obesity). In cotadutide studies, participants with T2DM treated with a GLP‐1RA within 3 months of screening were excluded since those participants have developed tolerability ahead of enrollment and become more tolerant to cotadutide than other participants. A summary of studies and study characteristics used in this analysis is provided in Table 1. The state of nausea/vomiting was reported daily as mild, moderate, or severe in all the studies.
TABLE 1.
Summary of studies and study characteristics.
| Study Code/NCT Number | Participants | No. of participants | Highest dose (μg) | PK sampling |
|---|---|---|---|---|
|
D5670C00004/ |
T2DM | 588 | 300 | Pre‐dose at 1, 2, 6, 10, 14, 18, 22, 26, and 54 weeks |
|
D5671C00002/ |
NAFLD/NASH | 50 | 600 | Pre‐dose on days 8, 22, 36, 50, 64, 78, 106; 6 h post‐dose on days 1, 22, 36; Pre‐dose, 2, 4, 6, 8, and 24 h post‐dose on day 133 |
|
D5671C00003/ |
T2DM (Japanese) | 12 | 600 | Pre‐dose on days 2, 7, 8, 15, 22; Pre‐dose, 1, 2, 4, 6, 8, 12, and 24 h post‐dose on days 28, 35, 42, 49 |
|
D5672C00001/ |
Obesity | 36 | 600 | Pre‐dose, 1, 2, 4, 6, 8, 12, and 24 h post‐dose on days 1, 7, 14, 21, 28, 35, 42, 49 |
Note: All studies are multiple dose administration unless otherwise stated. Inclusion criteria of the participants: T2DM: HbA1c range of 6.5%–10.5% at screening; CKD: eGFR ≥15 and <60 mL/min/1.73 m2 at screening; Obesity: body mass index ≥35 kg/m2 at screening; NAFLD/NASH: definitive NAFLD/NASH with NAS ≥4 with ≥1 in each component (i.e., steatosis, lobular inflammation and ballooning), as diagnosed by liver biopsy within 6 months of screening with liver fibrosis stage F1, F2, or F3.
In cotadutide studies, participants reported the start and end dates of nausea and vomiting to the sites for documentation during their presence. The severity of nausea/vomiting was primarily assessed through the investigator's medical assessment of the reported symptoms, considering factors such as the impact of nausea on food intake and the frequency of vomiting episodes throughout the day. A daily dataset was derived from the original data to facilitate the implementation of a Markov modeling approach. In cases where multiple events occurred within a single day, only the most severe event was kept for modeling. For participants experiencing nausea/vomiting over consecutive days, the daily status was imputed in the dataset to ensure the continuity of analysis.
PK/NV model
PK model
A previously developed PK model of cotadutide was used to establish the PK/NV model. The cotadutide PK was described by a one‐compartment model with first‐order absorption and elimination. 18 , 19 The mean values for cotadutide apparent clearance (CL/F), apparent volume of distribution (V/F), absorption rate constant (Ka), and half‐life were 1.05 L/h, 20.0 L, 0.38 h−1, and 13.3 h, respectively. The statistically significant covariates include bodyweight, anti‐drug antibody (ADA) titer values, participant indication, and alanine transaminase on CL/F, bodyweight and albumin on V/F, formulation strength and injection device on relative bioavailability; formulation strength on absorption rate. In the analysis, the individual PK estimates were used as input to the PK/NV model to characterize the exposure–response relationship in nausea/vomiting. In the analysis, different PK metrics, including doses, concentration area under the curve (AUC), and concentration at trough (C min), were evaluated to find the best PK metric to describe the cotadutide impact on the incidence of nausea/vomiting. The selected PK component was then used to perform the covariates evaluation.
Candidate base models
Proportional odds model
Compared with the logistic regression approach, the PO model has a time component to account for the change in the logit probability of variables over time. The logit for the probability of nausea, for instance, at different states for a participant was modeled as a function of the cotadutide exposure as follows:
| (1) |
where Y i,j denotes the severity score of nausea for the ith participant at the jth timepoint; m is the nausea grade (0 = none, 1 = mild, 2 = moderate/severe); P i,j is the probability of nausea for the ith individual at jth timepoint. BL is the baseline of the logit probability for nausea ≥m; α represents the cotadutide exposure (PK) impact on the probability of nausea (PK matrices of dose, AUC, or C min); β represents the time impact on the probability of nausea; denotes the time since the last dose escalation () where is the time after the first dose and is the time of the last dose escalation. Nonlinear relationships were evaluated on either exposure impact or time impact or both by replacing the slope with an E max function with EC50. ɳ k describes the between‐subject random effect for the ith individual for either exposure (k = 1), time (k = 2), or baseline (k = 3), which are independent, identically distributed random variables that are assumed to normally distributed with mean zero and variance ω 2.
The probability for nausea ≥m can be back‐calculated as Equation 2:
| (2) |
Discrete‐time Markov model
The discrete‐time Markov (DTM) model approach was used to model nausea severity transition for cotadutide, as the model schematic presented in Figure 1. The onset and duration of an event were governed by transitions between different states and the period the system remained in that state. Similarly, the time component was used to model the development of tolerance for participants, as expressed below:
| (3) |
where m|k denotes the grade transition from k to m.
FIGURE 1.
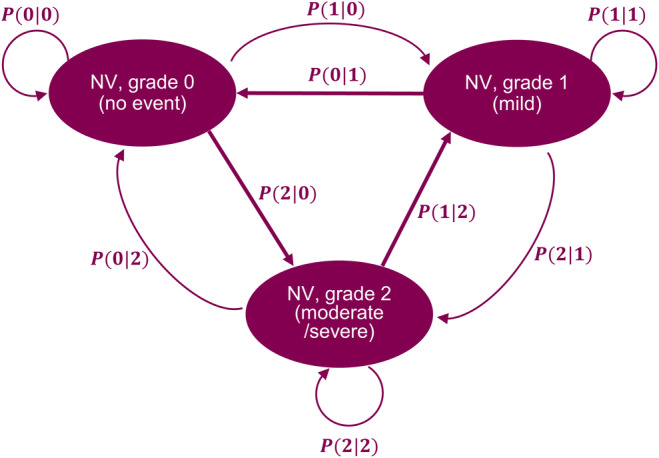
Markov model structure to estimate the probability of the severity transitions of nausea/vomiting for cotadutide. P(0|0), P(1|1), P(2|2): the probability of NV stay at the same state; P(1|0) and P(2|0) are the probability for NV transition from 0 to 1 and 2, respectively; P(0|1) and P(2|1) are the probability for NV transition from 0 to 2 and 1, respectively; P(0|2) and P(1|2) are the probability for NV transition from 2 to 0 and 1, respectively.
The probability of achieving a specific grade (0, 1, or 2) can be calculated as follows:
| (4) |
| (5) |
| (6) |
Similar expressions apply to other severity transitions.
Two‐stage discrete‐time Markov model
A two‐stage DTM model was developed to account for the time course of the probability of AEs and found improved model performance relative to the basic DTM model. 17 To perform the two‐stage Markov model, two separate datasets (incidence and conditional severity) were created from the main data file. The incidence dataset has only one record for each participant with the nausea status of either negative or positive (0 or 1), and the intent‐to‐treat dose was used to link the PK impact to nausea due to no repeated measurement within a participant. Additionally, the second dataset of conditional severity includes the participants with nausea only, and the DTM model was introduced to model the nausea score transition with the conditional severity.
The incidence of nausea was modeled using a logistic regression model given by the expression:
| (7) |
The second part of the conditional severity was modeled the same as the DTM model (Equation 3).
Covariate evaluation
Potential covariates of demographic characteristics (body weight, race, sex, age, participant indication), dose, and starting dose (0 = 50 μg, 1 = 100 μg) were considered more clinically relevant and were evaluated in the analysis. The covariate analysis was conducted through a stepwise covariate modeling (SCM) procedure, which involved stepwise testing of linear and nonlinear relationships in a forward inclusion (ΔOFV of 6.63 p < 0.01 for 1 degree of freedom (DF)) and backward exclusion (ΔOFV of 10.83, p < 0.001 for 1 DF) procedure. The selected covariates were tested on the parameters of BL, α, and β at each nausea grade.
Model evaluation and simulations
Different NV model approaches (PO model, discrete‐time Markov, and two‐stage discrete‐time Markov) were evaluated to determine the base model. Both linear and nonlinear (Emax model) functions on the cotadutide exposure and/or the time factor to describe the PK/NV relationship were assessed. The decision to refine the between‐subject variability (BSV) model was based on improvements in objective function value (OFV), and the model performance was assessed by visual predictive checks (VPC)/posterior predictive checks (PPC). BSV parameters were removed if they were estimated with high uncertainty (>80% relative standard error) or if they resulted in large condition numbers (e.g., >1000), or if they were estimated to a low value (e.g., <1% coefficient of variation).
The stability of the final covariate model was evaluated via the bootstrap analysis, where bootstrap replicates were generated by sampling randomly from the original dataset with replacement. Five hundred replicate datasets were obtained using the “bootstrap” option in the software package PsN. Parameter estimates for each re‐sampled dataset were obtained by fitting the final model using NONMEM. Nonparametric confidence intervals of the parameter estimates were derived.
The final model including covariates was used to perform the simulations for different dose titration scenarios for cotadutide in participants with NASH as of interest, including weekly, biweekly, and monthly titration at doses of 50, 100, 200, 300, 400, 500, 600 μg, biweekly/monthly titration with twofold dose increment at escalation (50, 100, 200, 400, and 600 μg), and biweekly titration with two‐fold dose increment and 2 weeks of skipped/missed dose after reaching the top dose of 600 μg.
Hardware and software
The software package NONMEM, version 7.5.0 (ICON Development Solutions, Ellicott City, MD, USA, 2009) was used in this PK‐AE modeling analysis. Nonmem2R version 0.2.1 (CRAN.R‐project.org/package=nonmem2R), PsN, version 4.4.8. (psn.sourceforge.net) and R, version 4.1.1 (R‐project, www.r‐project.org) was used for the exploratory analysis, executing NONMEM runs and post‐processing of NONMEM output to assess goodness‐of‐fit GOF. Mrgsolve version 1.0.6 (CRAN.Rproject. org/package=mrgsolve) was used to illustrate the effect of covariates using stochastic simulations.
RESULTS
Exploratory data analysis of cotadutide clinical data was performed and provided in the Appendix S1. Notably, it was observed that the overall proportion of participants experiencing vomiting remained below 10% in T2DM and NASH studies and below 20% in the obesity study throughout the treatment duration (Figure S4). The prevalence of vomiting appeared sporadically across various dose levels and titration regimens during treatment, indicating an unclear dose/exposure‐vomiting relationship across different disease indications (T2DM, obesity, and NASH). Consequently, we opted against modeling vomiting data within our analysis and focused only on nausea (PK/nausea).
Clinical data
The dataset consisted of 675 participants in four clinical studies with cotadutide doses ranging from 50 to 600 μg. The baseline demographic and participants' characteristics are tabulated in Table 2. Overall, the participants covered a wide range of demographic characteristics, aged 19–82 with an average of 57, and body weight from 56 to 207 kg with an average of 98 kg. The proportion of males and females was approximately even (males vs. females: 45.6% vs. 54.4%). Most participants were Caucasian (N = 624, 92.4%), with fewer participants in other categories (16 Black (2.4%), 29 Asian (4.3%), and six others (0.9%)). Out of the total number of participants, 592 (87.7%) were with T2DM, and other participants fell into obesity (34 (5.0%)) and NASH (49 (7.3%)). Two injection devices were used for drug administration: 580 participants (85.9%) used PFS (prefilled syringe), and 95 participants used V&S (vials&syringe) (14.1%). The incidence of mild nausea ranged from 22% (T2DM) to 44.9% (NASH), while moderate/severe nausea ranged from 7.6% (T2DM) to 47.1% (obesity). Regarding vomiting, the incidence ranged from 5.7% (T2DM) to 38.2% (obesity), with moderate/severe vomiting ranging from 2.9% (obesity) to 6.1% (NASH).
TABLE 2.
Demographics and baseline characteristics by disease indications.
| Variable | T2DM | Obesity | NASH | Overall |
|---|---|---|---|---|
| n | 592 | 34 | 49 | 675 |
| Caucasian | 564 (95.3) | 13 (38.2) | 47 (95.9) | 624 (92.4) |
| Black/African American | 16 (2.7) | 0 (0.0) | 0 (0.0) | 16 (2.4) |
| Asian | 7 (1.2) | 20 (58.8) | 2 (4.1) | 29 (4.3) |
| Other | 5 (0.8) | 1 (2.9) | 0 (0.0) | 6 (0.9) |
| Sex: Female (%) | 320 (54.1) | 20 (58.8) | 27 (55.1) | 367 (54.4) |
| Vial/Syringe (%) | 12 (2.0) | 34 (100.0) | 49 (100.0) | 95 (14.1) |
| Prefilled syringe (%) | 580 (98) | 0 (0) | 0 (0) | 580 (85.9) |
| Age (y) | 58.00 [19, 82] | 40.50 [19, 64] | 58 [26, 79] | 57 [19, 82] |
| Body weight (kg) | 96 [56, 158] | 120 [96, 207] | 98 [74, 150] | 98 [56, 207] |
| BMI (median [range]) | 35.0 [24.8, 50.7] | 41.0 [36.1, 63.7] | 36.0 [30.0, 56.4] | 35.4 [24.8, 63.7] |
| Nausea | ||||
| Mild (%) | 130 (22%) | 8 (23.5%) | 22 (44.9%) | 160 (23.7%) |
| Moderate/severe (%) | 45 (7.6%) | 16 (47.1%) | 6 (12.2%) | 67 (9.9%) |
| Vomiting | ||||
| Mild (%) | 34 (5.7%) | 13 (38.2%) | 9 (18.4%) | 56 (8.3%) |
| Moderate/severe (%) | 33 (5.6%) | 1 (2.9%) | 3 (6.1%) | 37 (5.5%) |
Abbreviation: BMI, body mass index.
Base model structure
The base model structures were evaluated through PO, DTM, and two‐stage DTM models with applied AUC as the PK metric and a linear function to describe the exposure–response relationship. A posterior predictive check (PPC) was implemented to assess the performance of each model structure by simulating cohort 3 in study S04 with the top dose at 300 μg daily dosing and weekly titration, as shown in Figure 2. The results showed that both the DTM and two‐stage DTM are capable of reproducing the number of transitions from 0 to 1, 0 to 2, 1 to 0, and 2 to 1 observed clinically, where the observed counts of transitions fall into the lower end of the DTM model, while the PO model fails to reproduce the transitions. Although the two‐stage DTM model showed slightly better performance than the base DTM model, the DTM model was selected as the base model structure for operational simplification. Furthermore, a nonlinear function describing the exposure/time–nausea relationship was assessed within the DTM model to compare with the linear function. However, the nonlinear model did not yield an improved description of the data but led to a less stable model and therefore was not retained. On the other hand, the impact of different PK metrics (dose, AUC, C min) on the nausea response was evaluated within the DTM model. As a result, the C min‐driven PK/nausea model indicated the lowest OFV compared with AUC‐ or dose‐driven models (OFVCmin:6148 vs. OFVAUC:6525 vs. OFVDose:6539). Their model performances were further assessed through VPC plots (Figure S7). Despite the lowest OFV estimated from the C min‐driven model, the AUC‐driven model illustrated an overall better performance than the other two models, as the predictions could describe the observed data adequately. Thus, the standard DTM model with linear exposure–nausea relationship was selected to conduct the covariates evaluation.
FIGURE 2.
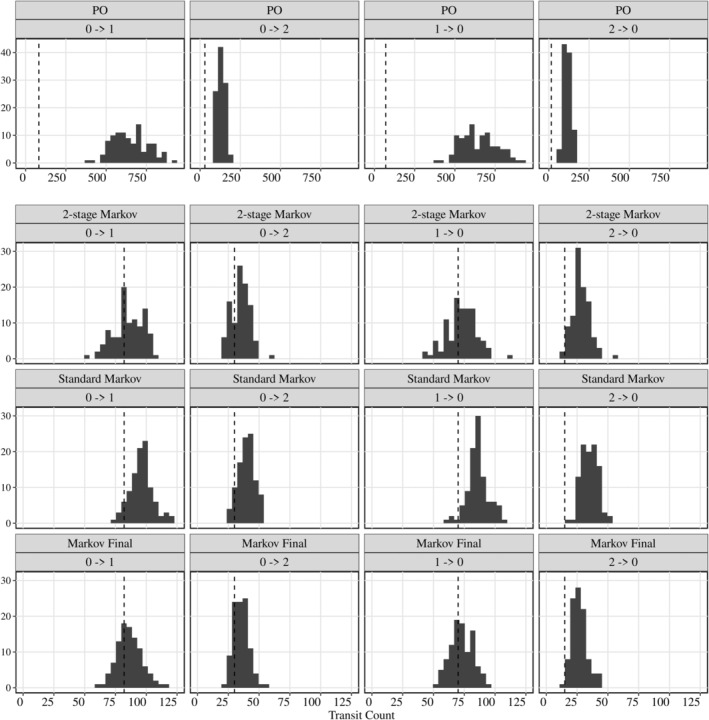
Posterior predictive check (PPC) for different models. PPC for a total number of transitions between varying levels of nausea for 100 simulated datasets. The vertical gray line indicates the observed number of transitions in the clinical data.
Final model
Parameter estimates of the final model are shown in Table 3. The bootstrap analysis showed comparable parameter estimates, and the VPC plot indicated an adequate model performance (Figure S6). The PPC plot of the final model (bottom row in Figure 2) demonstrated that the predicted total number of transitions within states is in good agreement with the observed data. The SCM analysis identified participant indications (obesity, NASH) as statistically significant covariates on all baseline logit probability (BL1,2|0, BL0,2|1, and BL0,1|2); sex as a significant covariate on BL1,2|0.
TABLE 3.
Estimation of parameters for the final model.
| Parameter | Estimate (RSE) | Bootstrap estimate (90% CI) |
|---|---|---|
| BL0|‐1 | 2.66 (0.059) | 2.64 (2.42: 2.97) |
| BL1|‐1 | 1.22 (0.29) | 1.23 (0.66: 1.93) |
| BL1|0 | −3.79 (0.052) | −3.79 (−4.11: −3.45) |
| BL2|0 | −0.80 (0.15) | −0.80 (−1.05: −0.58) |
| BL0|1 | −2.53 (0.094) | −2.51 (−3.0: −2.02) |
| BL2|1 | −4.23 (0.14) | −4.24 (−5.38: −3.54) |
| BL0|2 | −2.47 (0.14) | −2.44 (−3.15: −1.82) |
| BL1|2 | −3.56 (0.20) | −3.58 (−20.6: −2.71) |
| α 1,2|0 | 0.00091 (0.49) | 0.00096 (0.00017: 0.0017) |
| α 0,2|1 | −0.00091 (0.76) | −0.00098 (−0.0027: 0.0006) |
| α 0,1|2 | −0.0031 (0.38) | −0.003 (−0.0054: −0.0011) |
| β 1,2|0 | −0.34 (0.14) | −0.35 (−0.42: −0.29) |
| β 0,2|1 | −0.0089 (0.49) | −0.0085 (−0.017: 0.00028) |
| β 0,1|2 | −0.014 (0.60) | −0.015 (−0.032: 0.0003) |
| Effect of NASH on β1,2|0 | −0.58 (0.25) | −0.58 (−0.77: −0.16) |
| Effect of Obesity on β1,2|0 | −0.75 (0.17) | −0.72 (−0.91: −0.219) |
| Effect of sex on BL1,2|0 | −0.39 (0.46) | −0.4 (−0.71: −0.083) |
| Effect of Obesity on BL0,2|1 | 1.99 (0.26) | 2.04 (0.96: 2.97) |
| Effect of NASH on BL0,1|2 | 1.44 (0.45) | 1.47 (0.91: 2.08) |
| Effect of Obesity on BL0,1|2 | 1.53 (0.33) | 1.48 (0.75: 2.67) |
| BSV β 1,2|0 (cv%) | 193 (0.156) | 194 (157: 246) |
| BSV BL1,2|0 (cv%) | 176 (0.26) | 175 (119: 252) |
| BSV BL0,2|1 (cv%) | 312 (0.20) | 308 (181: 570) |
| BSV BL0,1|2 (cv%) | 138 (0.54) | 121 (1: 296) |
Note: Coefficient of variation (%CV) of between‐subject variability (BSV) was calculated as 100 × (exp(variance)‐1)^1/2. Bootstrap estimate and confidence interval (CI) based on 500 samples. All estimates are rounded to 3 significant digits. Subscript 0|−1: probability of nausea transition from pre‐treatment to 0; subscript 1|−1: probability of nausea transition from pre‐treatment to 1; subscript 1,2|0: probability of nausea transition from either 0 to 1 or 0 to 2; subscript 0,2|1: probability of nausea transition from either 1 to 0 or 1 to 2; subscript 0,1|2: probability of nausea transition from either 2 to 0 or 2 to 1.
Abbreviations: ADA, anti‐drug antibody; BWT, bodyweight; NASH, nonalcoholic steatohepatitis.
A forest plot was created to illustrate the impact of covariates on the logit probability of nausea in comparison with the reference population with T2DM and female gender, as shown in Figure 3. Male participants were estimated to have a 24% lower nausea rate across all levels of nausea. Participants with obesity were evaluated to have a 50% decrease in the incidence of mild nausea, while individuals with NASH appeared to increase the incidence of mild nausea (13%) but decrease the likelihood of moderate/severe nausea (23%).
FIGURE 3.

Forest plot of covariates on nausea incidence compared to the reference (T2DM female). The nausea event rate was focused at 600 μg. Effects of the identified statistically significant covariates on the total nausea, mild nausea, and moderate/severe nausea.
To optimize the titration schemes, different titration scenarios were simulated in the target NASH population and included weekly, biweekly, and monthly titration with 100 μg dose escalations after reaching 100 μg (50, 100, 200, 300, 400, 500, and 600 μg), and biweekly/monthly titration with twofold dose escalation until reaching 400 μg (50, 100, 200, 400, 600 μg), as presented in Figure 4. Across all scenarios, dose‐dependent increases in the incidence of nausea and time‐dependent tolerance development can be predicted. The incidence of nausea increased at each dose escalation and decreased progressively within the titration interval at the same dose level. Of the titration scenarios, the weekly titration with a 100 μg dose escalation showed the highest proportion of participants with nausea (30%) at 600 μg. In the monthly titration with 100 μg dose escalation, participants took the longest time to reach the therapeutic dose, but the proportion of individuals with nausea reduced to 22.4%. A similar result could still be maintained with a dose escalation by twofold every 4 weeks (21.2%). The percentage of nausea of the biweekly titration with a twofold dose escalation indicated comparable results to monthly titration with a twofold dose escalation but a shortened titration interval. Additionally, the simulation of biweekly titration with skipped/missed dose after reaching 600 μg was simulated and showed a significant drop in the event rate (10%) during the off‐drug period. However, the proportion of participants with nausea is expected to return (21%) when the dose is given again.
FIGURE 4.
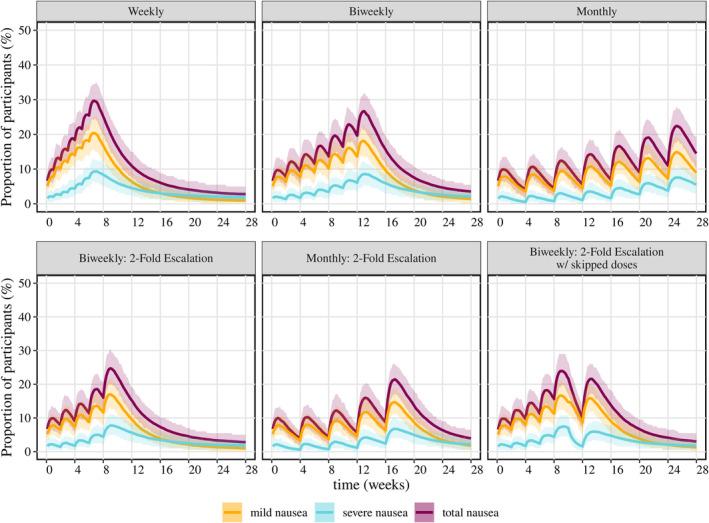
Simulation of the proportion of participants with nausea in different titration scenarios in a population with NASH. Titration doses: (1) weekly, biweekly, and monthly: 50, 100, 200, 300, 400, 500, 600 μg; (2) biweekly/monthly with twofold dose increment: 50, 100, 200, 400, 600 μg. The solid line represents the mean incidence of nausea in 200 simulated studies with 200 participants in each study; the shaded area indicates the 90% percentile.
DISCUSSION
A PK/nausea modeling analysis was performed to characterize the relationship between cotadutide exposure and the incidence of nausea using clinical data from four cotadutide studies. The modeling analysis primarily focused on the incidence of nausea as the overall data didn't show a clear trend of a dose‐dependent relationship in vomiting. The final covariate DTM model adequately described the observed proportion of subjects with nausea and the number of transitions within severity states throughout the treatment period.
Three modeling structures that were evaluated for predicting the probability of nausea have their own strengths and weaknesses. The PO model is conceptually the simplest and the easiest to implement. 20 , 21 , 22 , 23 However, it overpredicted the number of transitions between severity states due to its lack of Markov elements. 12 In contrast, both the standard and two‐stage DTM models were effective in predicting the number of transitions between severity states, with the two‐stage DTM showing slightly superior performance. The two independent components for incidence and severity of the two‐stage model increase the operational complexity, requiring a more complex covariate analysis and simulation setup relative to the standard DTM. For the present work, the small advantages in the descriptive performance of the model did not justify the added complexity. However, we expect the relative advantages of the two‐stage model to increase with a decreasing incidence of the events under investigation. The standard DTM model provided the best compromise of operational simplicity and the ability to describe the observed data in this work.
Population indications (T2DM, obesity, and NASH) were identified as covariates on the probability of nausea. In the population with obesity, participants with higher body weight may be less prone to experiencing mild nausea partially due to a lower exposure relative to NASH/T2DM, whereas there was an estimated higher incidence of mild nausea but a lower incidence of severe nausea in the NASH population. It should be noted that these findings are provisional owing to limited sample sizes and the inclusion of only a single study for each medical condition. Out of the unselected studies completed in T2DM, the overall percentile of individuals with nausea was below 20% across the dose range over treatments (Figure S5). It is implied that the incidence of nausea in T2DM was lower than that in the population with obesity or NASH. One plausible reason could result from the standard of care allowed in patients with T2DM also triggering nausea (e.g., metformin, DPP‐4i, and meglitinide). Note that participants on stable GLP‐1 receptor agonists were not included in cotadutide studies. As a result, those participants may have developed tolerability ahead of enrollment and become more tolerant to cotadutide than other participants. 5 , 24 However, the co‐medication data were not included in the dataset, necessitating further investigation.
Identification of sex as a covariate on the logit probability of nausea, where females tend to have a higher incidence than males, is consistent with the observations that drug‐induced nausea is less likely to occur in men than women. 25 Though lower average body weight led to higher treatment exposure in females compared with males, GI AEs were more frequent in females than males under similar exposure in a semaglutide study. 26 The underlying factors explaining this discrepancy remain to be determined. This observation in the GLP‐1RAs studies could indicate that exposure is not the sole primary determinant in the differing incidence of nausea between the sexes.
The influence of ADA on the tolerance was not investigated in this analysis. Although ADA has been found to significantly impact cotadutide drug exposure (ADA‐bound total concentration) by altering the clearance resulting in prolonged exposure, its specific effect on the safety and efficacy of cotadutide remains unclear. The study of bound cotadutide PK characteristics demonstrated the impact of ADA by examining time‐course clearance data, revealing changes in clearance in response to varying ADA titer values. 19 The current analysis did not further explore the impact of ADA on cotadutide tolerance due to uncertainties regarding ADA occurrence and variability in its strength among participants and over the treatment duration. Additionally, considering the covariate effect of ADA on the logit probability, using a binary categorical factor for ADA status (positive/negative) or time‐course ADA titer values may lead to an over‐ or underestimation of ADA's impact on tolerance, particularly during periods of ADA negativity. The exploratory analysis indicated a significant increase in the proportion of participants with nausea at the time of each dose escalation, followed by a gradual decrease over time due to the development of tolerability, contrary to the progression of ADA in participants with ADA positivity (ADA incidence and titer value accumulate with time). This suggests that the pharmacological effect on tolerance may be primarily driven by the free drug concentration rather than the ADA‐bound concentrations in circulation. Consequently, the impact of ADA on the incidence of nausea was omitted from the analysis to ensure clarity and accuracy, preventing potential confusion or misinterpretation of the findings.
The starting dose and titration interval are considered crucial in clinical studies to optimize the titration strategy of having a short titration duration reaching the therapeutic dose and an acceptable tolerance in GI‐related AEs. 27 In the analysis, the starting dose (either at 50 or 100 μg) was evaluated as a binary factor on the logit probability but was not identified as a covariate possibly due to the small sample size. Moreover, the impact of the titration interval on the logit probability was not evaluated as it was combined with inconsistent dose escalations across the studies, for example, three titration schemes, weekly, biweekly, and monthly were tested in study S201 but with different dose escalations across the three cohorts (detailed information was provided in the Appendix S1). So, the direct impact of the titration interval on the logit nausea probability was not studied due to data insufficiency. Further analyses may be conducted to investigate the impact of starting dose and titration interval on the incidence of NV when more qualified data are available.
Various titration scenarios were simulated to optimize titration schemes for late‐phase studies of cotadutide, specifically focusing on the population with NASH. A monthly titration scheme with a 100 μg dose escalation was relatively conservative; it led to lower monthly incidences of nausea but required 24 weeks to reach the therapeutic dose, thereby increasing the burden of titration on participants. In contrast, the weekly titration scheme appeared more aggressive, showing a rapid week‐to‐week increase in the percentage of participants experiencing nausea, which could potentially lead to higher dropout rates in clinical studies. The weekly titration scheme is also adopted for liraglutide (GLP‐1 receptor agonist administrated once‐daily subcutaneously) to reach the therapeutic dose either at 1.8 mg in T2DM or at 3.0 mg in obesity with the starting dose at 0.6 mg, 28 , 29 where the total incidence of nausea in T2DM patients was 31.4% at 1.8 mg and 32.7% at 3.0 mg reported in a 56‐week study. 28
Biweekly and monthly titrations with a twofold dose escalation emerged as superior options. For both schemes, the proportion of participants with nausea remained below 10% during the first month and gradually increased to approximately 25% by Week 9 and 21.2% by Week, 17, respectively (Figure 4). The biweekly titration with a twofold dose escalation achieved an acceptable incidence of nausea while significantly reducing the duration of the titration phase, thereby lessening the burden on participants. It is worth noting that considering the effect of the disease indication on the nausea response, optimal titration schemes may need to be tailored for other disease indications, such as obesity or T2DM. The monthly titration scheme with a twofold dose escalation has widely been utilized in weekly dosing GLP‐1 receptor agonists (e.g., dulaglutide, semaglutide, and tirzepatide), where dulaglutide indicated overall percentile patients with nausea below 20% across several clinical studies, 30 , 31 , 32 , 33 tirzepatide demonstrated a 33.3% proportion at 10 mg dose and 31% at 15 mg dose in participants with obesity, 34 and semaglutide showed a 45% percentile in obesity/NASH studies. 35 , 36
It is worth noting that participants may miss or skip doses during clinical studies, often based on the belief that doing so could alleviate GI AEs. Simulations involving biweekly titration with two‐week gaps in dosing indicated a significant drop in event rates during the skipped period. However, a rebound in nausea incidence was predicted upon resumption of the medication, aligning with clinical observations. A further limitation is the subjective nature of nausea reports in clinical studies.
The developed PK/nausea model can be applied to study the incidence of other AEs over time in response to drug administration, accounting for the interdependence between different AE states. 16 , 37 , 38 , 39 The model can be used with limited data from early phase studies, and the prediction can be improved with more data available over drug development. It is not only limited to predicting AEs but can also be employed to describe the pharmacodynamic effects of drugs, particularly when multiple discrete response levels or states depend on drug exposure and time. 37 , 40
CONCLUSIONS
The population PK/nausea model employing a Markov approach effectively characterized the exposure‐response relationship between cotadutide concentrations and the incidence of nausea. Significant covariates influencing the likelihood of nausea were identified, including disease indication and sex. Among various titration schemes evaluated, biweekly titration with a twofold dose escalation emerged as the most advantageous. This approach not only resulted in a lower proportion of participants experiencing nausea but also offered a shorter titration period, thereby optimizing both efficacy and participant comfort. This modeling approach is mechanism agnostic and lends itself to be applied to different molecules and mechanisms resulting in nausea. Ultimately, this approach can help optimize benefit:risk profiles for patient therapies.
AUTHOR CONTRIBUTIONS
H.Y., S.U., and L.Z. wrote the manuscript and performed the research. H.Y., S.U., B.H., and A.A.K. designed the research. All authors analyzed the data.
FUNDING INFORMATION
This study was supported by AstraZeneca.
CONFLICT OF INTEREST STATEMENT
H.Y., S.U., J.C., D.R., L.H., A.F., V.P., B.H., and A.A.K. are employees of AstraZeneca and own AstraZeneca stocks or stock options. L.Z. declared no competing interests for this work.
Supporting information
Appendix S1
Yu H, Ueckert S, Zhou L, et al. Exposure–response modeling for nausea incidence for cotadutide using a Markov modeling approach. CPT Pharmacometrics Syst Pharmacol. 2024;13:1582‐1594. doi: 10.1002/psp4.13194
DATA AVAILABILITY STATEMENT
Data underlying the findings described in this paper may be obtained in accordance with AstraZeneca's data sharing policy described at: https://astrazenecagrouptrials.pharmacm.com/ST/Submission/Disclosure.
REFERENCES
- 1. Klein G, Petrone M, Yang Y, et al. Pharmacokinetics and safety of cotadutide, a GLP‐1 and glucagon receptor dual agonist, in individuals with renal impairment: a single‐dose, phase I, bridging study. Clin Pharmacokinet. 2023;62:881‐890. [DOI] [PMC free article] [PubMed] [Google Scholar]
- 2. Parker VE, Hoang T, Schlichthaar H, et al. Efficacy and safety of cotadutide, a dual glucagon‐like peptide‐1 and glucagon receptor agonist, in a randomized phase 2a study of patients with type 2 diabetes and chronic kidney disease. Diabetes Obes Metab. 2022;24(7):1360‐1369. [DOI] [PMC free article] [PubMed] [Google Scholar]
- 3. Kleinert M, Sachs S, Habegger KM, Hofmann SM, Müller TD. Glucagon regulation of energy expenditure. Int J Mol Sci. 2019;20(21):5407. [DOI] [PMC free article] [PubMed] [Google Scholar]
- 4. Drucker DJ, Nauck MA. The incretin system: glucagon‐like peptide‐1 receptor agonists and dipeptidyl peptidase‐4 inhibitors in type 2 diabetes. Lancet. 2006;368(9548):1696‐1705. [DOI] [PubMed] [Google Scholar]
- 5. Bettge K, Kahle M, Abd El Aziz MS, Meier JJ, Nauck MA. Occurrence of nausea, vomiting and diarrhoea reported as adverse events in clinical trials studying glucagon‐like peptide‐1 receptor agonists: a systematic analysis of published clinical trials. Diabetes Obes Metab. 2017;19(3):336‐347. [DOI] [PubMed] [Google Scholar]
- 6. Filippatos TD, Panagiotopoulou TV, Elisaf MS. Adverse effects of GLP‐1 receptor agonists. RDS. 2014;11(3):202‐230. [DOI] [PMC free article] [PubMed] [Google Scholar]
- 7. Nauck MA, Quast DR, Wefers J, Meier JJ. GLP‐1 receptor agonists in the treatment of type 2 diabetes – state‐of‐the‐art. Mol Metab. 2021;1(46):101102. [DOI] [PMC free article] [PubMed] [Google Scholar]
- 8. Garber AJ. Long‐acting glucagon‐like peptide 1 receptor agonists: a review of their efficacy and tolerability. Diabetes Care. 2011;34(Suppl 2):S279‐S284. [DOI] [PMC free article] [PubMed] [Google Scholar]
- 9. Prasad‐Reddy L, Isaacs D. A clinical review of GLP‐1 receptor agonists: efficacy and safety in diabetes and beyond. Drugs Context. 2015;4:4‐19. [DOI] [PMC free article] [PubMed] [Google Scholar]
- 10. Fujioka K. Safety and tolerability of medications approved for chronic weight management. Obesity. 2015;1(23):S7. [DOI] [PubMed] [Google Scholar]
- 11. Sorli C, Harashima SI, Tsoukas GM, et al. Efficacy and safety of once‐weekly semaglutide monotherapy versus placebo in patients with type 2 diabetes (SUSTAIN 1): a double‐blind, randomised, placebo‐controlled, parallel‐group, multinational, multicentre phase 3a trial. Lancet Diabetes Endocrinol. 2017;5(4):251‐260. [DOI] [PubMed] [Google Scholar]
- 12. Lu T, Yang Y, Jin JY, Kågedal M. Analysis of longitudinal‐ordered categorical data for muscle spasm adverse event of Vismodegib: comparison between different pharmacometric models. CPT Pharmacometrics Syst Pharmacol. 2020;9(2):96‐105. [DOI] [PMC free article] [PubMed] [Google Scholar]
- 13. Mould DR, Walz AC, Lave T, Gibbs JP, Frame B. Developing exposure/response models for anticancer drug treatment: special considerations. CPT Pharmacometrics Syst Pharmacol. 2015;4(1):12‐27. [DOI] [PMC free article] [PubMed] [Google Scholar]
- 14. Sheiner LB. A new approach to the analysis of analgesic drug trials, illustrated with bromfenac data. Clin Pharmacol Ther. 1994;56(3):309‐322. [DOI] [PubMed] [Google Scholar]
- 15. Sonnenberg FA, Beck JR. Markov models in medical decision making: a practical guide. Med Decis Making. 1993;13(4):322‐338. [DOI] [PubMed] [Google Scholar]
- 16. Pilla Reddy V, Petersson KJ, Suleiman AA, Vermeulen A, Proost JH, Friberg LE. Pharmacokinetic–pharmacodynamic modeling of severity levels of extrapyramidal side effects with Markov elements. CPT Pharmacometrics Syst Pharmacol. 2012;1(9):1‐9. [DOI] [PMC free article] [PubMed] [Google Scholar]
- 17. Eghbali‐Zarch M, Tavakkoli‐Moghaddam R, Esfahanian F, Azaron A, Sepehri MM. A Markov decision process for modeling adverse drug reactions in medication treatment of type 2 diabetes. Proc Inst Mech Eng H. 2019;233(8):793‐811. [DOI] [PubMed] [Google Scholar]
- 18. Guan Y, Ly N, Li J, Arends RH. Population pharmacokinetics of cotadutide in subjects with type 2 diabetes. Clin Pharmacokinet. 2022;61(6):833‐845. [DOI] [PubMed] [Google Scholar]
- 19. Yu H, Åstrand M, Cheng J, Nitin K, Hamrén B, Khan AA. Population pharmacokinetic modeling of cotadutide: a dual agonist peptide of glucagon like peptide (GLP‐1) and glucagon (GCG) receptors administered to participants with type II diabetes mellitus, chronic kidney disease (CKD), obesity and non‐alcoholic steatohepatitis (NASH). J Clin Pharm Ther. 2023;63:255‐267. [DOI] [PubMed] [Google Scholar]
- 20. Kowalski KG, McFadyen L, Hutmacher MM, Frame B, Miller R. A two‐part mixture model for longitudinal adverse event severity data. J Pharmacokinet Pharmacodyn. 2003;30:315‐336. [DOI] [PubMed] [Google Scholar]
- 21. Ito K, Hutmacher MM, Liu J, Qiu R, Frame B, Miller R. Exposure‐response analysis for spontaneously reported dizziness in pregabalin‐treated patient with generalized anxiety disorder. Clin Pharmacol Ther. 2008;84(1):127‐135. [DOI] [PubMed] [Google Scholar]
- 22. Drubay D, Collette L, Paoletti X. Proportional odds assumption for modeling longitudinal ordinal multiple toxicity outcomes in dose finding studies of targeted agents: a pooled analysis of 54 studies. Contemp Clin Trials Commun. 2020;1(17):100529. [DOI] [PMC free article] [PubMed] [Google Scholar]
- 23. Mathew AC, Siby E, Tom A. Applications of proportional odds ordinal logistic regression models and continuation ratio models in examining the association of physical inactivity with erectile dysfunction among type 2 diabetic patients. Phys Act Nutr. 2021;25(1):30‐34. [DOI] [PMC free article] [PubMed] [Google Scholar]
- 24. Gilbert MP, Pratley RE. GLP‐1 analogs and DPP‐4 inhibitors in type 2 diabetes therapy: review of head‐to‐head clinical trials. Front Endocrinol. 2020;3(11):178. [DOI] [PMC free article] [PubMed] [Google Scholar]
- 25. Rentzeperi E, Pegiou S, Koufakis T, Grammatiki M, Kotsa K. Sex differences in response to treatment with glucagon‐like peptide 1 receptor agonists: opportunities for a tailored approach to diabetes and obesity care. J Pers Med. 2022;12(3):454. [DOI] [PMC free article] [PubMed] [Google Scholar]
- 26. Petri KC, Ingwersen SH, Flint A, Zacho J, Overgaard RV. Exposure‐response analysis for evaluation of semaglutide dose levels in type 2 diabetes. Diabetes Obes Metab. 2018;20(9):2238‐2245. [DOI] [PMC free article] [PubMed] [Google Scholar]
- 27. Fineman MS, Shen LZ, Taylor K, Kim DD, Baron AD. Effectiveness of progressive dose‐escalation of exenatide (exendin‐4) in reducing dose‐limiting side effects in subjects with type 2 diabetes. Diabetes/Metab Res Rev. 2004;20(5):411‐417. [DOI] [PubMed] [Google Scholar]
- 28. Astrup A, Rössner S, Van Gaal L, et al. Effects of liraglutide in the treatment of obesity: a randomised, double‐blind, placebo‐controlled study. Lancet. 2009;374(9701):1606‐1616. [DOI] [PubMed] [Google Scholar]
- 29. Davies MJ, Bergenstal R, Bode B, et al. Efficacy of liraglutide for weight loss among patients with type 2 diabetes: the SCALE diabetes randomized clinical trial. JAMA. 2015;314(7):687‐699. [DOI] [PubMed] [Google Scholar]
- 30. Van J, Frias JP, Bonora E, et al. Gastrointestinal tolerability of once‐weekly dulaglutide 3.0 mg and 4.5 mg: a post hoc analysis of the incidence and prevalence of nausea, vomiting, and diarrhea in AWARD‐11. Diabetes Ther. 2021;12:2783‐2794. [DOI] [PMC free article] [PubMed] [Google Scholar]
- 31. Arslanian SA, Hannon T, Zeitler P, et al. Once‐weekly dulaglutide for the treatment of youths with type 2 diabetes. N Engl J Med. 2022;387(5):433‐443. [DOI] [PubMed] [Google Scholar]
- 32. Bonora E, Frias JP, Tinahones FJ, et al. Effect of dulaglutide 3.0 and 4.5 mg on weight in patients with type 2 diabetes: exploratory analyses of AWARD‐11. Diabetes Obes Metab. 2021;23(10):2242‐2250. [DOI] [PMC free article] [PubMed] [Google Scholar]
- 33. Frias JP, Bonora E, Nevarez Ruiz L, et al. Efficacy and safety of dulaglutide 3.0 mg and 4.5 mg versus dulaglutide 1.5 mg in metformin‐treated patients with type 2 diabetes in a randomized controlled trial (AWARD‐11). Diabetes Care. 2021;44(3):765‐773. [DOI] [PMC free article] [PubMed] [Google Scholar]
- 34. Jastreboff AM, Aronne LJ, Ahmad NN, et al. Tirzepatide once weekly for the treatment of obesity. N Engl J Med. 2022;387(3):205‐216. [DOI] [PubMed] [Google Scholar]
- 35. Loomba R, Abdelmalek MF, Armstrong MJ, et al. Semaglutide 2.4 mg once weekly in patients with non‐alcoholic steatohepatitis‐related cirrhosis: a randomised, placebo‐controlled phase 2 trial. Lancet Gastroenterol Hepatol. 2023;8(6):511‐522. [DOI] [PMC free article] [PubMed] [Google Scholar]
- 36. Newsome PN, Buchholtz K, Cusi K, et al. A placebo‐controlled trial of subcutaneous semaglutide in nonalcoholic steatohepatitis. N Engl J Med. 2021;384(12):1113‐1124. [DOI] [PubMed] [Google Scholar]
- 37. Lacroix BD, Lovern MR, Stockis A, Sargentini‐Maier ML, Karlsson MO, Friberg LE. A pharmacodynamic Markov mixed‐effects model for determining the effect of exposure to certolizumab pegol on the ACR20 score in patients with rheumatoid arthritis. Clin Pharmacol Ther. 2009;86(4):387‐395. [DOI] [PubMed] [Google Scholar]
- 38. Karlsson MO, Schoemaker RC, Kemp B, et al. A pharmacodynamic Markov mixed‐effect model for the effect of temazepam on sleep. Clin Pharmacol Ther. 2000;68(2):175‐188. [DOI] [PubMed] [Google Scholar]
- 39. Zingmark PH, Kågedal M, Karlsson MO. Modelling a spontaneously reported side effect by use of a Markov mixed‐effects model. J Pharmacokinet Pharmacodyn. 2005;32:261‐281. [DOI] [PubMed] [Google Scholar]
- 40. de Haan‐Rietdijk S, Kuppens P, Bergeman CS, Sheeber LB, Allen NB, Hamaker EL. On the use of mixed Markov models for intensive longitudinal data. Multivariate Behav Res. 2017;52(6):747‐767. [DOI] [PMC free article] [PubMed] [Google Scholar]
Associated Data
This section collects any data citations, data availability statements, or supplementary materials included in this article.
Supplementary Materials
Appendix S1
Data Availability Statement
Data underlying the findings described in this paper may be obtained in accordance with AstraZeneca's data sharing policy described at: https://astrazenecagrouptrials.pharmacm.com/ST/Submission/Disclosure.