Abstract
Surface Enhanced Raman Spectroscopy (SERS) is a highly sensitive analytical technique used for fingerprint recognition of molecular samples. The SERS effect, which enhances Raman scattering signals, has been the subject of extensive research over the past few decades. More recently, the commercialization of portable Raman spectrometers has brought SERS closer to real-world applications. The aim of the study was to enhance their performance, properties, and biocompatibility for potential use as SERS substrates. The synthesis and characterization of MoS2 and SnS2 nanoparticles are described, along with the functionalization process using l-cysteine. The detection and identification of Escherichia coli (E. coli) bacteria using MoS2 and SnS2 as SERS substrates are also investigated. The results demonstrate the successful functionalization and characterization of the nanostructures, indicating their potential as SERS substrates. The abstract highlights the importance of developing cost-effective and environmentally friendly disposable analysis chips with high accuracy and specificity for practical SERS applications.
This study enhances MoS2/SnS2 nanoparticles for SERS, functionalizing them with l-cysteine. Successful detection of E. coli demonstrates their potential as cost-effective SERS substrates for real-world applications.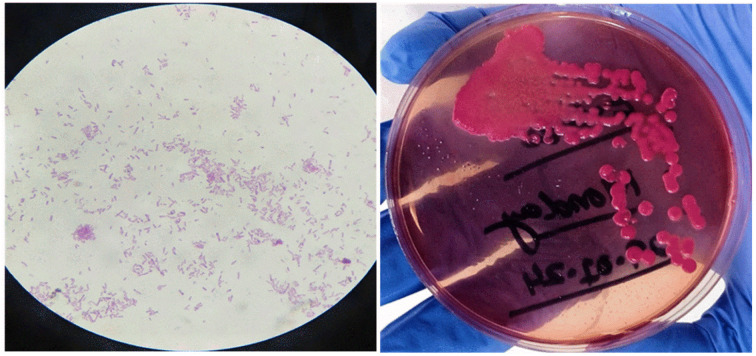
Introduction
In recent times, Surface-Enhanced Raman Scattering (SERS) has gained significant recognition as an influential analytical method. SERS boasts an exceptional level of sensitivity, coupled with its ability to identify unique molecular fingerprints, thus facilitating the detection of analytes at extremely low concentrations.1 The phenomenon of surface enhancement is primarily elucidated by two main mechanisms: the localized surface plasmon resonance (LSPR) and the chemical or charge-transfer processes. These mechanisms provide a comprehensive understanding of the enhancement effect observed in SERS.2 Extensive research spanning several decades has focused on investigating the SERS effect.3 Notably, recent advancements in technology have brought about the commercialization of portable Raman spectrometers, thereby bringing SERS closer to practical applications in various fields. These applications include but are not limited to food safety and quality control, medical diagnostics, environmental monitoring and homeland security.4,5
In order to expand the practical utilization of SERS in real-life scenarios, it is imperative to develop cost-effective, environmentally friendly disposable analysis chips that offer both high accuracy and specificity.6,7 Additionally, it is crucial to mitigate the risks associated with cross-contamination and false positives. These factors play a crucial role in ensuring the reliability and effectiveness of SERS in various applications. Numerous techniques have been documented in the literature for fabricating structured SERS-active substrates, including dip coating, spin-coating, electrochemical synthesis, chemical vapor deposition, soft lithography, etching and electron beam lithography.8–10 However, it is important to note that these methods possess certain limitations with regards to either throughput volume or cost implications.11,12 In addition, achieving consistent signal intensity across different regions poses a significant challenge when it comes to the mass production of SERS-active nanostructures.13,14
The remarkable physical and chemical properties exhibited by 2D materials have sparked growing interest among researchers and scientists. 2D nanomaterials offer distinctive advantages, including facile synthesis, significant specific surface areas, remarkable mechanical properties, excellent optical properties, and favorable biocompatibility.15,16 These advantages contribute to their practical application in enhancing SERS and provide a viable solution to overcome challenges associated with metal substrates, such as high costs, catalytic effects, strong metal–adsorbate interactions, and photobleaching.17,18 As a result, numerous 2D materials have been extensively explored as potential SERS substrates.
Molybdenum disulfide (MoS2) has garnered significant attention in the field of materials science over the past decade due to its layered structure, resembling graphite, and exhibiting distinct anisotropic electrochemical, electronic, and optical properties. These properties make it highly relevant in various applications such as biology, physicochemistry, optics, imaging, sensing, therapy, and intercalation agents.19–21 Surface functionalization of MoS2 involves modifying its properties through the covalent bonding of particles to the single-layer nanosheets. Scanning tunneling microscopy (STM) serves as direct evidence for the covalent functionalization of transition metal dichalcogenides (TMDs), including MoS2.22,23 The functionalized MoS2 with a large surface area can increase its surface area and improve its effectiveness in interacting with other materials by adding functional groups or nanostructures to its surface. Its exceptional hydrophilicity provides a number of advantages, making it a promising material in a variety of biomedical applications.24 Overall, functionalized MoS2 nanostructures are important for SERS detection because they increase sensitivity, provide a large surface area for molecule adsorption, maintain chemical stability, have tunable plasmonic properties, are biocompatible, and can be easily integrated into sensing platforms.25,26
SnS2 is a layered, n-type semiconducting material with a hexagonal structure and an indirect bandgap of 2.23 eV. Similar to other TMDs, SnS2 consists of tin atoms sandwiched between two sulfur layers with covalent bonding, while each monolayer is held together by van der Waals forces.27 The structural properties of SnS2, including interlayer distances, binding energies, and in-plane lattice parameters, exhibit minimal variation across layers. The layer-dependent Raman spectra of SnS2 exhibit a slight increase in the frequencies of the Raman-active modes as the number of layers increases, while their intensities display a significant enhancement. The investigation of electronic, excitonic, and vibrational properties of SnS2 materials opens up new avenues for understanding the key characteristics of 2D materials.28 Due to its impressive performance, SnS2 finds applications in environmental remediation. Biofunctionalized SnS2 nanoparticles possess a large surface area and exceptional hydrophilicity. These attributes improve the loading efficiency and capacity of antibodies in the bio-detection stage and ensure the functionality of immobilized protein biomolecules. The functionalization of SnS2 is characterized using scanning electron microscopy, electrochemical impedance spectroscopy, static water contact angle measurements, and cyclic voltammetry.29 Because of their distinct surface properties, MoS2 and SnS2 make ideal SERS substrates. When functionalized with the MoS2 and SnS2 nanoparticles, they can greatly boost the Raman signals of molecules adsorbed on their surfaces. Charge transfer between the analytes molecule and the substrate as well as the localized surface plasmon resonance (LSPR) phenomenon are the sources of this increase. MoS2 and SnS2 nanostructures are chemically stable, which is critical for ensuring the accuracy and reliability of SERS observations throughout time. Functionalization can improve their stability and avoid degradation, resulting in more consistent and precise detection. For the sensitive and targeted identification of biomolecules, pathogens, and other analytes in complicated biological samples, functionalized MoS2 and SnS2 nanostructures can be employed.30
Functionalized 2D MoS2/SnS2 nanostructures for SERS have been the subject of ongoing research, particularly in nanotechnology and materials science. The functionalization of MoS2 economical SERS substrate for label-free bilirubin detection in clinical diagnosis. A one-pot hydrothermal synthesis of Fe-doped MoS2 was created as SERS substrate. Fe-MoS2 NFs were employed to detect bilirubin in serum. The Fe-MoS2 NF SERS substrate has a linear detection range of 10−3–10−9 M and a low limit of detection (LOD) of 10−8 M.31 The improvement the SERS sensitivity was also investigated of the π-conjugated fluorinated 7,7,8,8-tetracyanoquinodimethane derivatives by using the charge-localization effect caused by 2D MoS2 flakes. A significant Raman signal amplification in SERS was achieved using a 2D hetero structure made of FnTCNQ nanostructures grown on a 2D MoS2 flake. The SERS enhancement factor of MB molecules on the ideal F4TCNQ/MoS2 nanocomposite substrate can reach up to 2.531 × 10⁶, with a limit of detection (LOD) of 10−10 M. The SERS results for MB, Rhodamine 6G (R6G), and 4-aminothiophenol (4-ATP) molecules suggest that the FnTCNQ/MoS2 SERS platform is promising for the detection of trace molecules.32 The photo-assisted decorating of silver nanoparticles (Ag-NPs) by hydrothermally produced hexagonal-like tin disulfide (SnS2-NHs) for ultrasensitive detection of synthetic dyes. The Ag-NPs/SnS2 NHs nanostructure exhibits both a local electromagnetic effect from the Ag-NPs and an effective charge-transfer effect from the SnS2 NHs. Methylene Blue (MB) and tartrazine (TZ) were used to test the SERS performance of Ag-NPs/SnS2 NHs. The produced nanostructure has a large linear range (MB (10−3–10−10 M) and TZ (10−2–10−9 M), low limit of detection (MB (4.12 × 10⁻¹⁰ M) and TZ (3.01 × 10⁻⁹ M), and excellent enhancement factor (108 and 107 for MB and TZ, respectively).33 The simple SERS active gold functionalized SnS2 quantum dots (Au/SnS2 QDs) that can detect and photodegrade Hg2+ ions under visible light irradiation. Crystal violet (CV) dye is employed as the indirect Raman probe for SERS detection at an excitation laser of 532 nm. The Au hybrids had higher SERS activity than pristine-SnS2 due to a combination of electromagnetic and chemical enhancements. The detection limit of Au/SnS2 toward Hg2+ was determined to be 1.05 ng ml−1.34,35
In this study, we focused on investigating the surface functionalization of 2D molybdenum/tin chalcogenide nanostructures through covalent bonding. The aim was to enhance their performance, properties, and bio-compatibility. Furthermore, we explored the potential of these nanostructures as SERS substrates for the detection and identification of various analytes, including microorganisms like Escherichia coli (E. coli) Methylene Blue (MB).
Experimental section
Materials
The source materials used for synthesizing molybdenum disulfide/tin disulfide and for surface functionalization via covalent bonding in SERS applications include molybdenum trioxide (99.6%), thiourea (98.7%), hydrochloric acid (99%), tin-chlorate pentahydrate (99.2%), sodium dodecyl sulfate (99%), l-cysteine (99%), isopropyl alcohol (99%), ethanol (99.8%), and deionized water were used, as purchased from Sigma Aldrich.
Synthesis of MoS2 nanoparticles
The synthesis of MoS2 nanoparticles was carried out using the hydrothermal method, following the procedure in the reported literature.36 MoO3 (0.15 g) and thiourea (2.0 g) were mixed by stirring for 15 minutes at 50 °C using a magnetic hot plate stirrer. Subsequently, an HCl solution (0.6 mole per l) was added to the mixture, which was then transferred to a Teflon-lined stainless steel hydrothermal autoclave. The autoclave was heated at 280 °C for 12 hours. After completion, the resulting powder was filtered, washed several times with deionized water, and dried at 100 °C. The obtained product was then annealed at 200–400 °C for 1 hour and characterized using Raman spectroscopy, X-ray diffraction (XRD), and scanning electron microscopy (SEM).
Synthesis of SnS2 nanoparticles
The synthesis of SnS2 nanoparticles was conducted using a hydrothermal process.37 To begin, 1.5 g of dodecyl sulfate sodium salt was added to deionized water and stirred for 20 minutes. Subsequently, 1.7 g of SnCl4·5H2O and 1.2 g of thiourea were mixed into the aqueous solution of SDS, and the mixture was stirred for 30 minutes at mild heating. The resulting mixture was then transferred to a hydrothermal autoclave and heated at 180 °C for 12 hours. After completion, the product was filtered, washed, and dried at 100 °C, followed by annealing at 300–400 °C for 1 hour. The SnS2 nanoparticles were characterized using XRD, Raman spectroscopy, and SEM.
Functionalization of MoS2 and SnS2 NPs with l-cysteine
For the functionalization of MoS2 and SnS2 with l-cysteine, the following process was conducted.38 Initially, we exfoliated the bulk MoS2 and SnS2 nanoparticles and took different concentrations of MoS2 (0.2 g/5 ml IPA, 0.8 g/5 ml IPA, 1.4 g/5 ml IPA) and SnS2 (0.3 g/5 ml IPA, 0.48 g/5 ml IPA, 0.58 g/5 ml IPA). These samples were sonicated under ice-cooling for one hour. Subsequently, centrifugation was performed at 4000 rpm for 1 hour, and the supernatant was discarded to remove impurities. The samples were sonicated and centrifuged again for one hour at 1500 rpm. The sediment was discarded, and the supernatant was collected for further functionalization. l-Cysteine/IPA solution was added to the centrifuged supernatants of MoS2 and SnS2 solutions, followed by sonication. The resulting dispersion was centrifuged at 9000 rpm for one hour. Equal ratios of IPA/H2O were added to both the MoS2 and SnS2 sediments, which were then centrifuged at 9000 rpm for 2 hours to remove free and unbound molecules from the sediment. The resulting product was filtered and dried at 100 °C. The functionalization of MoS2 and SnS2 with l-cysteine was characterized using various techniques, including Raman, XRD, SEM, and SERS.
Preparation of MB solution
To prepare a 0.1 mM concentration of Methylene Blue, put 0.003 g of MB to a 250 ml beaker containing 100 ml DI water and stir for 10–15 minutes. Other concentrations are made using the same procedure, adding 0.32 g, 3.199 g, and 9.597 g to 100 ml DI water for 1 mM, 0.1 M, and 0.3 M, respectively.
Preparation of E. coli bacteria solution
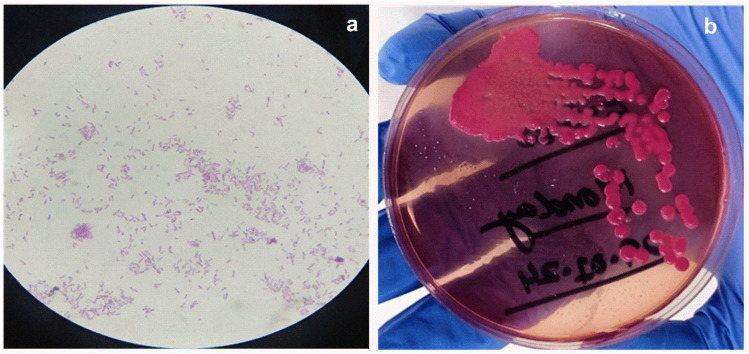
Single bacteria colony of E. coli from the stock is dissolved in the 1 ml DI water. Then 0.1 ml of this solution is dissolved in 0.9 ml DI water and this processed carried for multiple time to reach the dissolution factor of 106. Then 0.1 ml from each diluted solution is cultured on the Petri dish having MacConkey media and left for 24 hours. After the culturing process the dish having 61 countable colonies is carried for the calculation of CFU ml−1. Fig. 1(a) and b shows the optical images and real image of E coli bacteria colony.CFU ml−1 = no. of colonies × dilution factor/volume of cultured platedCFU ml−1 = 61 × 105/0.1 mlCFU ml−1 = 6.1 × 10⁷ ml−1
Fig. 1. (a and b) Optical images of E. coli colonies.
This selected diluted bacteria solution is then carried for the measurements of SERS using MoS2-l-Cys and SnS2-l-Cys.
Preparation of E. coli bacteria solution
E. coli bacteria are cultured in saline water and cultivated on MacConkey media using the steaking process. Grown colonies are collected with an inoculation loop and placed in a sterilized glass test tube containing 0.5 ml DI water. They are then shaken thoroughly to dissolve all of the bacteria in water. To make a media-free solution, it is centrifuged at least three times at 4000 rpm for 10 minutes. Gram staining is used to ensure the presence of a high concentration of bacteria in water, and optical images are acquired with an optical microscope at 100× magnification (Fig. 1(a)).
Detection of E. coli bacteria by MoS2 and SnS2 as a SERS substrate
To begin with, a 100 ml solution of l-Cys-MoS2/l-Cys-SnS2 was prepared in DI water, and then 100 μl of this solution was added to 500 μl of PBS. Subsequently, 50 μl of the bacterial solution was mixed with the PBS solution. The mixture was incubated for 1 hour at 25 °C with agitation at 500 rpm, followed by centrifugation for 10 minutes at 2000 rpm. Next, the bacterial solution was subjected to three washes with PBS to eliminate any unbound particles. Finally, 2 μl of the bacterial solution was utilized for SERS observation.39 Comparative Raman spectrum of SERs enhancement of beard particles of MoS2 and SnS2 and functionalized particles of MoS2 and SnS2–l-Cys by using MB annealed at 400 °C, shown in Fig. S1–S3.†
Results and discussion
The amplification of Raman signals is essential for identifying particular target compounds, including biomolecules, environmental pollutants and food chemicals.40 The advancement of SERS applications has largely been driven by the increasing accessibility of suitable nanostructure-based SERS substrates.41 In recent years, the progress in nanotechnology, electronics, lasers, and optics has led to the development of substrates with various shapes, compositions, and sizes. These substrates offer the capability to generate diverse enhancement factors (EFs) and find extensive applications in trace-level analysis. The amplification of Raman signals is influenced by both the substrate–sample interactions and the functionalization of substrates to achieve SERS-active substrates.42 When applying SERS in the biomolecules industry, it becomes crucial to choose appropriate functionalized substrates based on the nature and physicochemical properties of bacterial samples, considering their multi-component nature.43 Reproducibility, portability, sensitivity, and selectivity are among the key factors that influence SERS performance. Enhancements in these factors have played a crucial role in driving rapid progress in the development of SERS substrates. In this study we have prepared the two materials MoS2 and SnS2 which used as substrates and functionalized the substrates.
Functionalization of MoS2
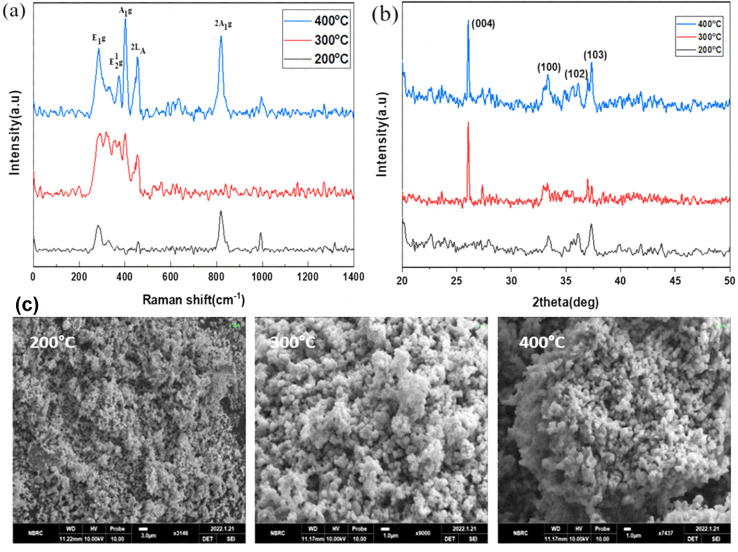
Fig. 2(a) to (c) depict the Raman, XRD, and SEM images of the MoS2 NPs annealed at different temperatures: 200, 300, and 400 °C, respectively. In Fig. 2(a), the Raman spectroscopy analysis explores the vibrational modes of all MoS2 samples and records the spectra from 200 to 1000 cm−1.39 The first peak, E1g, appears around 285 cm−1 and is Raman active in bulk 2H-MoS2 due to its location in the hexagonal Brillouin zone. However, since this mode is forbidden in backscattering experiments on the surface perpendicular to the c-axis, its presence indicates that the MoS2 layers are randomly oriented and not perpendicular to the laser, with no polarization. The second peak, E12g, is observed between 373–385 cm−1, demonstrating a redshift phenomenon. The third peak, A1g, is observed at 401 cm−1, indicating a distinct blueshift and the presence of S-vacancies. Additionally, within the S–Mo–S layer, four active modes (E1g, E12g, A1g) are observed as vibrational results of Raman mode shifts, and a 2LA Raman mode is also detected at 450–453 cm−1. We have also observed the MoO3 vibrational modes due to post-annealing. Because the oxygen captured ability of the molybdenum is much higher than the sulfur atoms.
Fig. 2. (a) Raman spectroscopy, (b) XRD, and (c) SEM analysis of annealed MoS2 nanoparticles at various temperatures ranging from 200 to 400 °C.
In Fig. 2(b), the XRD pattern of MoS2 exhibits four diffraction peaks located at 2θ angles of 26.3°, 33.3°, 35.5°, and 38.9°, corresponding to the (004), (001), (103), and (102) planes, respectively. All of these peaks are in agreement with the JCPDS card no. 1010993. The observed broadening of the peaks confirms the pure phase and hexagonal structure of MoS2.
In Fig. 2(c), the SEM images of the MoS2 nanoparticles reveal their spherical morphology and high porosity. The agglomerations of the MoS2 nanoparticles were shown in the SEM images. The grain size of the nanoparticles was increased due to increase the post-annealing temperature.
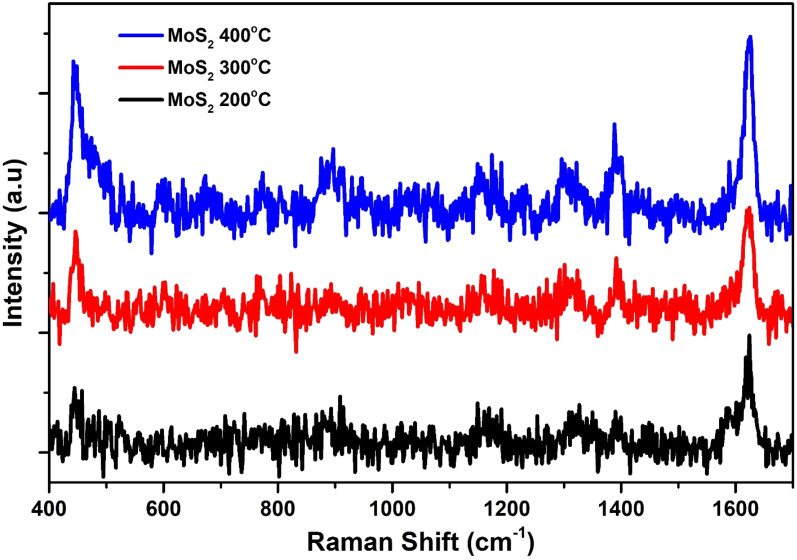
For the testing of synthesized nano materials SERS substrate, we have used 0.1 M of MB on the prepared sample of MoS2 in Fig. 3. The sample of MoS2 has shown high signal to noise ratio with the lower signal intensity. To overcome this issue, we functionalized our prepared samples of MoS2 with l-Cys.
Fig. 3. SERS spectrum of MoS2 annealed at temperatures ranging from 200 to 400 °C.
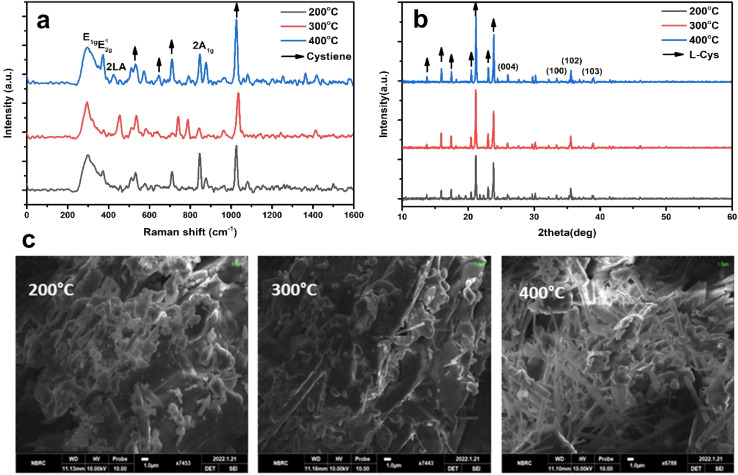
Fig. 4(a) to (c) display the Raman, XRD, and SEM images of the MoS2-l-Cys NPs after functionalization, annealed at different temperatures: 200, 300, and 400 °C, respectively. In Fig. 4(a), the MoS2-l-Cys structure exhibits five prominent vibrational modes.38 Functionalization leads to an increased intensity of the E1g vibrational plane, with a slight shift in position. The second vibrational mode, E12g, remains unaffected by functionalization. Before functionalization, the results showed an intensity increase in the 2LA mode with increasing thickness. However, for MoS2-l-Cys NPs, the relative intensity of 2LA decreases with increasing thickness. The interaction between 2H-MoS2 and l-cysteine induces changes in defect density or electronic properties on the MoS2 surface, resulting in different band behaviors. Notably, compared to bulk 2H-MoS2, the MoS2-l-Cys structure exhibits a significant increase in the intensity of E1g.
Fig. 4. (a)–(c) Raman spectroscopy data, XRD patterns, and SEM images of the MoS2-l-Cys NPs annealed at temperatures ranging from 200 to 400 °C. (a) Raman spectrum (b) XRD pattern (c) SEM images.
In Fig. 4(b), the structural analysis of MoS2-l-Cys is observed using XRD. Four prominent Bragg's peaks are observed at (004), (100), (102), and (103) in addition to the peaks corresponding to l-cysteine at different angles. Upon functionalization with l-cysteine, the intensity of the MoS2 peaks increases; however, the sharpness of the peaks decreases.
In Fig. 4(c), the SEM analysis of MoS2-l-Cys NPs reveals a uniform distribution of particle sizes without any signs of aggregation.
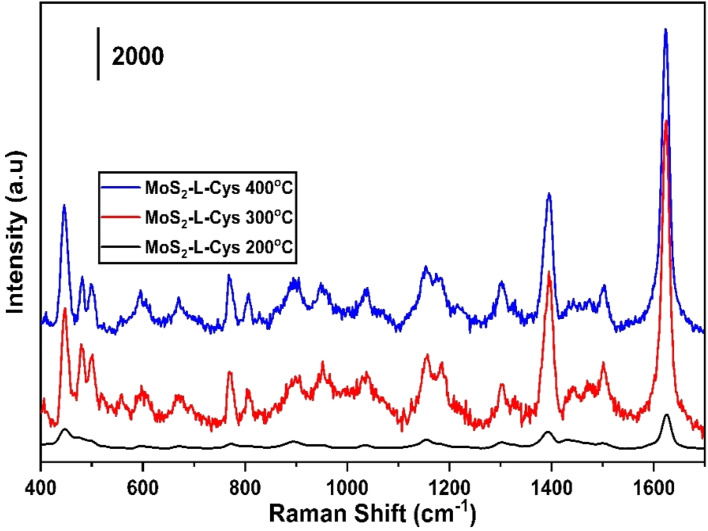
Fig. 5 shows the SERS spectrum of 0.1 M of Methylene Blue for the testing of synthesized MoS2-l-Cys functionalized as a SERS substrate, which was annealed at temperatures of 200 °C, 300 °C and 400 °C. The samples annealed at 300 °C and 400 °C have shown significant enhancement in the SERS spectrum as compared to the sample annealed at 200 °C. Table 1 shows the detailed analysis of the Raman spectrum with corresponding bonds of MoS2.
Fig. 5. The Raman spectra of MB using MoS2-l-Cys as SERS substrate annealed at temperatures 200 °C, 300 °C and 400 °C.
SERS spectra of MB using MoS2-l-Cys as the substrate for surface-enhanced Raman spectroscopy.
| Raman spectra of MB (cm−1)this work | Raman spectra of MB (cm−1)39,43–45 | Corresponding bonds |
|---|---|---|
| 445–479 | 449 | C–N–C |
| 500 | 502 | C–N–C |
| 671 | 670 | C–H |
| 769–953 | 768 | C–H |
| 1035 | 1030 | C–H |
| 1185 | 1184 | C–N |
| 1304 | 1301 | C–H |
| 1395 | 1396 | C–H |
| 1440 | 1442 | C–N |
| 1502 | 1513 | C–C |
| 1622 | 1618 | C–C |
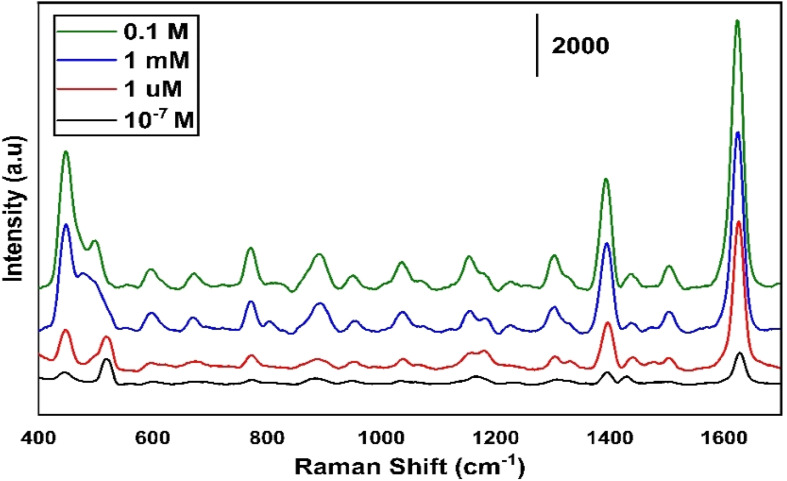
Fig. 6 shows the different concentrations of MB ranging from 0.1–10−7 M for the least concentration of any organic molecule to be used for the SERS. Up to 1 μm concentration of MB we have observed a detectable high intensity.
Fig. 6. Different concentration of MB ranging from 0.1–10−7 M measured on MoS2 sample annealed at 300 °C.
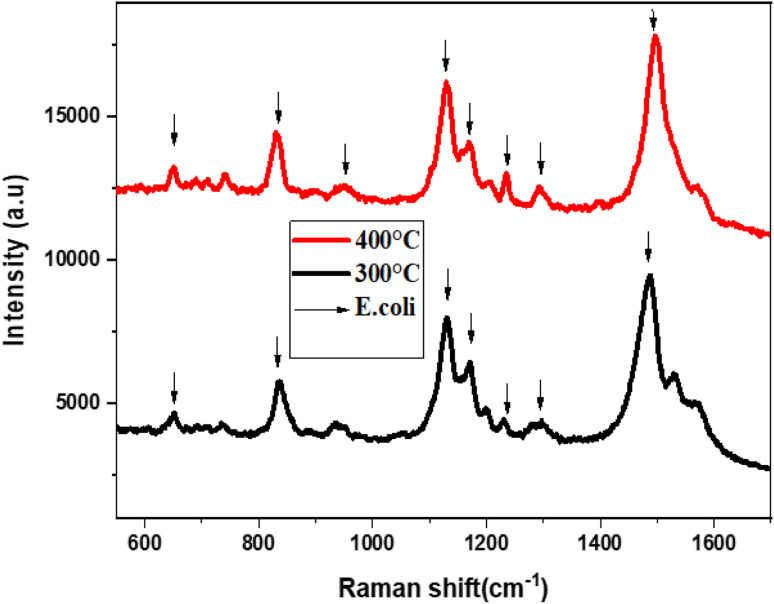
Fig. 7 presents the Raman spectra of E. coli, which was annealed at temperatures 300 °C and 400 °C. The Raman spectra were obtained using an excitation laser of 633 nm, and eight active Raman modes were measured at wavenumbers of 652, 828, 958, 1129, 1169, 1240, 1300, 1499, and 1580 cm−1.
Fig. 7. The Raman spectra of E. coli using MoS2-l-Cys as SERS substrate annealed at temperatures 300 °C and 400 °C.
Table 2 shows the detailed analysis of the Raman spectra of E. coli using MoS2-l-Cys. The E. coli SERS peaks were examined for the substrates annealed at 300 °C and 400 °C. Strong peaks were observed at 828 cm−1 (O–P–O stretching), 1129 cm−1 (C S), and 1499 cm−1 (carbohydrates modes). Other peaks were observed at 652 cm−1 (C–H), 958 cm−1 (CH bonding), 1169 cm−1 (C–C), 1240 cm−1 (C–N), 1300 cm−1 (lipids), and 1580 cm−1 (lipids). These results demonstrate the potential of the SERS substrate for the detection of E. coli bacteria even at low concentrations. However, the substrate annealed at 300 °C did not show E. coli signals due to a high signal-to-noise ratio. The functionalization resulted in an increase in peak intensity, indicating a change in defect density and electronic properties on the surface, as well as a slight shift in the Raman spectra. The MoS2-l-Cys nanoparticles were utilized as SERS substrates for the detection of E. coli bacterial cells, even at low concentrations. Raman analysis revealed that these substrates have the potential to detect various pathogens.
SERS spectra of E. coli using MoS2-l-Cys as the substrate for surface-enhanced Raman spectroscopy.
| Raman spectra of E. coli (cm−1)this work | Raman spectra of E. coli (cm−1)11,23,39 | Corresponding bonds |
|---|---|---|
| 652 | 658 | C–H |
| 828 | 830 | O–P–O stretch |
| 958 | 960 | CH bending mode |
| 1129 | 1130 | C S |
| 1169 | 1161 | C–C |
| 1240 | 1245 | C–N |
| 1300 | 1330 | CH2 |
| 1499 | 1513 | Carbohydrates |
| 1580 | 1587 | Lipids |
Functionalization of SnS2
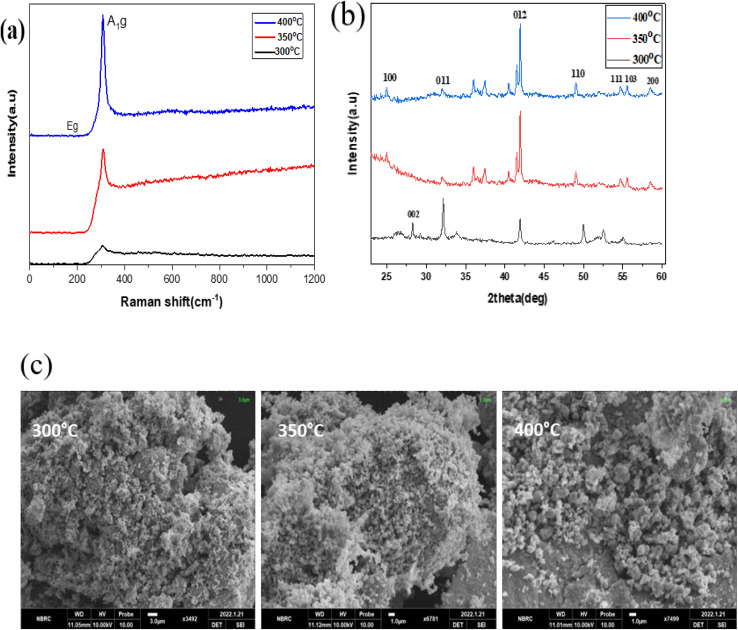
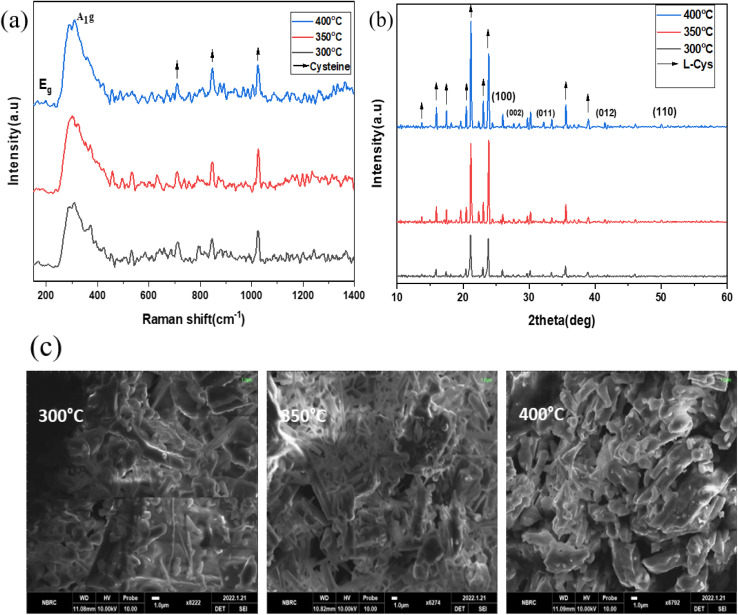
Fig. 8(a) to (c) depict the Raman, XRD, and SEM images of the SnS2 NPs annealed at different temperatures: 300, 350, and 400 °C, respectively. In Fig. 8(a), the Raman analysis focuses on the first peak at 202 cm−1, which corresponds to SnS, and the main peak at 312 cm−1 for SnS2.44 The Raman spectra of SnS2 exhibit a pronounced peak at 312 cm−1 in the A1g mode, indicating the stretching of sulfur atoms out of the plane. The in-plane stretched mode at 204 cm−1 (Eg) appears weak due to the reduced number of in-plane scattering events caused by the nano size effect. The Raman spectra of SnS2 display multiple peaks, but the absence of a peak at 633 cm−1 indicates that SnS2 has not been oxidized to SnO2. Furthermore, two peaks corresponding to A1u and A1g-LA were observed, suggesting the presence of thick layers of SnS2 in the samples.
Fig. 8. (a)–(c) XRD, Raman spectroscopy data, and SEM images of the SnS2 NPs annealed at different temperatures ranging from 300 to 400 °C.
In Fig. 8(b), the purity and phase of the SnS2 samples are determined through the XRD pattern. The XRD pattern of SnS2 at different temperature ranges reveals distinct diffraction peaks. At 300 °C, the peak is consistently indexed as a hexagonal SnS2 phase. As the temperature decreases, the formation of both SnS and SnS2 is observed. The XRD analysis of SnS2 shows seven reflection peaks corresponding to (100), (002), (011), (012), (110), (111), (103), and (200) planes.
In Fig. 8(c), the morphology of the prepared SnS2 samples was examined using SEM analysis. The SEM investigation revealed that SnS2 exhibits nanoflakes with a hexagonal stacking structure.
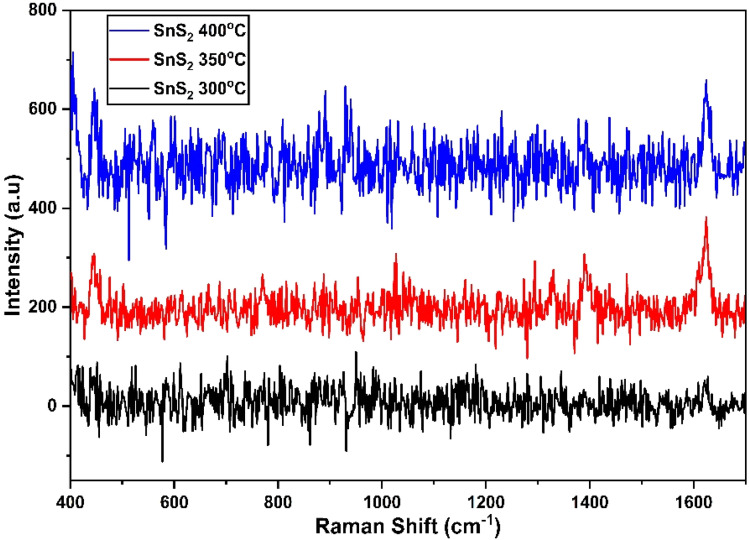
We have used 0.1 M of MB on the prepared sample of MoS2 in Fig. 9 for the testing of synthesized nano materials SERS substrate. Fig. 9 shows that the sample of SnS2 has shown a higher signal-to-noise ratio with a lower signal intensity. To overcome this issue we functionalized our prepared samples of SnS2 with l-Cys.
Fig. 9. SERS spectrum of SnS2 annealed at temperatures ranging from 300 to 400 °C.
Fig. 10(a) to (c) depict the Raman, XRD, and SEM images of the SnS2-l-Cys NPs annealed at different temperatures ranging from 300 to 400 °C. In Fig. 10(a), the Raman spectra of SnS2 exhibit a slight shift in their peaks. The interaction between SnS2 and l-cysteine is evident from the presence of the Eg peak at 204 cm−1, which is still weak due to the nano size effect. The Raman spectra at 312 cm−1 indicate the presence of the stretched out-plane peak mode, but a shift in position is observed after functionalization. l-Cysteine peaks at 720 cm−1, 843 cm−1, and 1020 cm−1 were observed at different temperatures, respectively. SnS2 with l-cysteine displayed Raman spectra that were not significantly different from the SnS2 spectra, but the interaction with l-cysteine affected the peak positions.
Fig. 10. (a)–(c) XRD, Raman spectroscopy data, and SEM images of the SnS2-l-Cys NPs annealed at different temperatures ranging from 300 to 400 °C.
In Fig. 10(b), after functionalization of SnS2 with l-cysteine, five diffraction peaks corresponding to (100), (002), (011), (012), and (110) were observed, along with l-cysteine peaks at different angles and with varying intensities. The X-ray diffraction (XRD) pattern was used to determine the purity and phase of SnS2-l-cysteine. The intensity of the peaks increased after functionalization.
The SEM micro-images in Fig. 10(c) display the SnS2-l-Cys NPs annealed at different temperatures ranging from 300 to 400 °C. Following functionalization, the original morphology of both SnS2 and l-Cys elements is no longer apparent, and instead, a uniform distribution of particle sizes is observed.
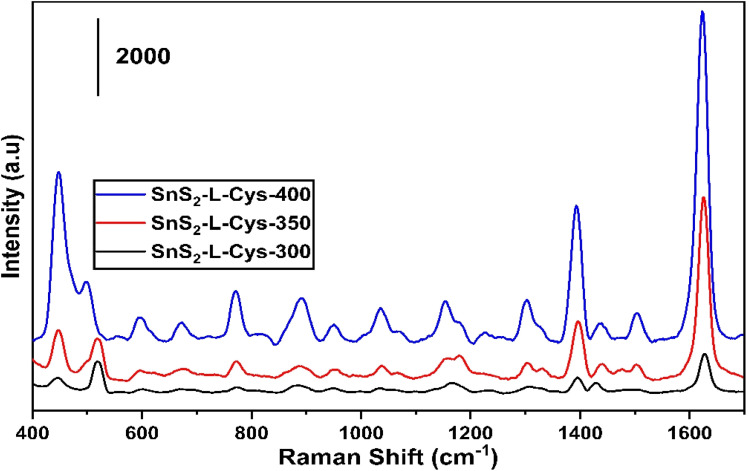
Fig. 11 illustrates the SERS spectrum of 0.1 M of Methylene Blue for the testing of synthesized SnS2-l-Cys functionalized as a SERS substrate, which was annealed at the temperatures of 300 °C, 350 °C and 400 °C. The samples annealed at 350 °C and 400 °C have shown significant enhancement in the SERS spectrum as compared to the sample annealed at 300 °C. Table 3 shows the Raman analysis of MB using SnS2-l-Cys.
Fig. 11. SERS spectrum of SnS2-l-Cys annealed at different temperatures ranging from 300 to 400 °C.
SERS spectra of MB using SnS2-l-Cys as the substrate for surface-enhanced Raman spectroscopy.
| Raman spectra of MB (cm−1)this work | Raman spectra of MB (cm−1)39,43–45 | Corresponding bonds |
|---|---|---|
| 448 | 449 | C–N–C |
| 500 | 502 | C–N–C |
| 675 | 670 | C–H |
| 773–949 | 768 | C–H |
| 1036 | 1030 | C–H |
| 1185 | 1184 | C–N |
| 1302 | 1301 | C–H |
| 1392 | 1396 | C–H |
| 1440 | 1442 | C–N |
| 1505 | 1513 | C–C |
| 1626 | 1618 | C–C |
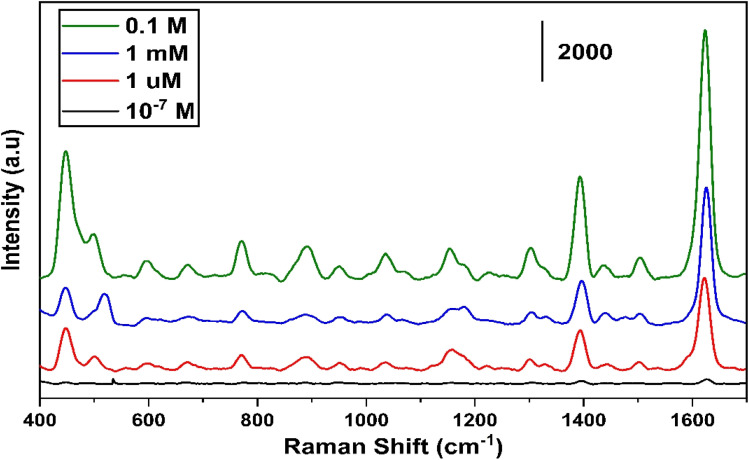
Fig. 12 illustrates the tested results for different concentrations of MB ranging from 0.1–10−7 M for the least concentration of any organic molecule to be used for the SERS. The maximum 1 μm concentration of MB we have observed a detectable enhancement in the intensity of Raman signal.
Fig. 12. Different concentrations of MB ranging from 0.1–10−7 M measured on SnS2 sample annealed at 400 °C.
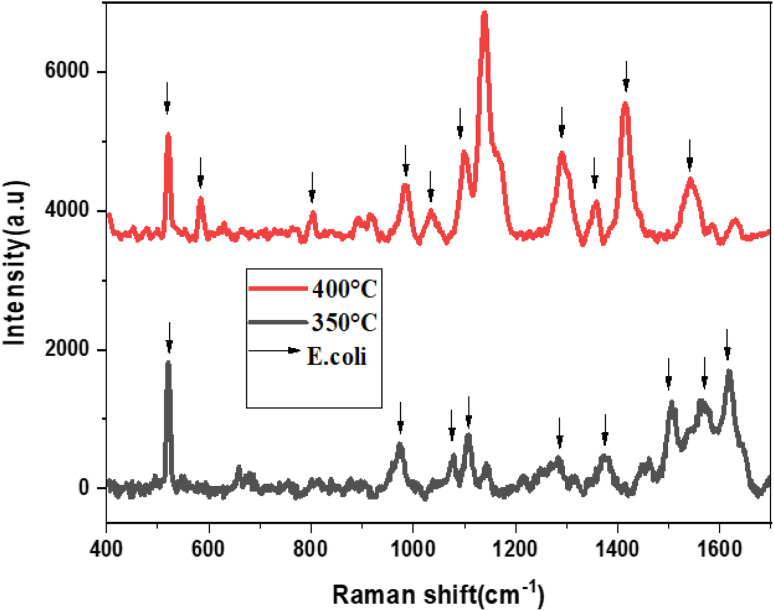
In Fig. 13, the Raman spectra of E. coli using SnS2–l-Cys as a SERS substrate annealed at high temperatures, specifically 350 °C and 400 °C, are presented. Eleven active Raman modes were identified by utilizing a 633 nm excitation laser. These modes correspond to vibrations at 520, 582, 803, 983, 1034, 1098, 1137, 1290, 1340, 1400, and 1540 cm−1, which are associated with C–N–C, S–S, tyrosine, C–O–O, C–H, C S, CH2, NH2, and ring stretching of adenine, respectively. The results demonstrate that this substrate can be used for the detection of E. coli bacteria at low concentrations.
Fig. 13. The Raman spectra of E. coli using SnS2-l-Cys as SERS substrate annealed at different temperatures ranging from 300 to 400 °C.
The functionalization increased in peak intensity, indicating a change in defect density and electronic properties on the surface, as well as a slight shift in the Raman spectra. The annealing temperature has a considerable impact on the characteristics of functionalized SnS2-l-cysteine SERS substrates. Higher annealing temperatures can improve the homogeneity and reproducibility of SERS signals and enhancement factors can also be affected by its annealing temperature which are critical for detecting low-concentration analytes in SERS applications. The adsorption and binding of molecules, such as the l-cysteine–SnS2 substrate surface are influenced by the annealing temperature. The higher temperatures of 400 °C can enable greater adsorption or binding interactions, improving the functionalized substrate stability, and increasing the intensity of the SERS signal.
The SnS2-l-Cys nanoparticles were utilized as SERS substrates for the detection of E. coli bacterial cells, even at low concentrations. Raman analysis revealed that these substrates have the potential to detect various pathogens. Table 4 shows the detailed analysis of Raman spectra of E. coli using SnS2–l-Cys as an SERS substrate.
SERS spectra of E. coli using SnS2–l-Cys as SERS substrate.
| Raman spectra of E. coli (cm−1)this work | Raman spectra of E. coli (cm−1)39,43,44 | Corresponding bonds |
|---|---|---|
| 520 | 525 | C–N–C |
| 582 | 580 | S–S |
| 803 | 796–809 | Tyrosine |
| 983 | 960–996 | C–O–O |
| 1034 | 1030 | C–H |
| 1098 | 1100 | Aromatic C S |
| 1137 | 1126–1144 | C S |
| 1290 | 1300 | CH2 |
| 1340 | 1336–1342 | γ(NH2) |
| 1400 | 1396 | C–H |
| 1540 | 1551–1569 | Ring stretching (adenine) |
Conclusion
In conclusion, this study successfully functionalized 2D MoS2 and SnS2 nanostructures with l-cysteine, enhancing their performance, bio-compatibility, and structural properties. Characterization using Raman, XRD, SEM, and SERS confirmed effective covalent bonding and improved morphology. The functionalized nanostructures proved to be effective SERS substrates for detecting Escherichia coli, demonstrating their potential for applications in food safety, medical diagnostics, and environmental monitoring. Future research could optimize the functionalization process for improved sensitivity and explore their use with other analytes, further expanding their practical applications.
Data availability
All data is available on the request.
Author contributions
Zainab Ishfaq: writing original draft, Layla A. Almutairi: formal analysis, funding, M. Yasir Ali: conceptualization, Salhah Hamed Alrefaee: formal analysis, Mohamed Abdelsabour Fahmy: resources, Abdul Mateen: experiment section, Elsammani Ali Shokralla: data collection, Lamiaa G. Alharbe: review and editing, Adnan Ali: supervisor, conceptualization, Arslan Ashfaq: review & editing, conceptualization, A. R. Abd-Elwahed: frmal analysis.
Conflicts of interest
There are no conflicts of interest.
Supplementary Material
Acknowledgments
Princess Nourah bint Abdulrahman University Researchers Supporting Project number (PNURSP2024R457), Princess Nourah bint Abdulrahman University, Riyadh, Saudi Arabia.
Electronic supplementary information (ESI) available. See DOI: https://doi.org/10.1039/d4ra05315j
References
- Pilot R. SERS detection of food contaminants by means of portable Raman instruments. J. Raman Spectrosc. 2018;49:954–981. [Google Scholar]
- Álvarez-Puebla R. n. A. Effects of the Excitation Wavelength on the SERS Spectrum. J. Phys. Chem. Lett. 2012;3:857–866. doi: 10.1021/jz201625j. [DOI] [PubMed] [Google Scholar]
- Rosqvist E. Böcker U. Gulin-Sarfraz T. Afseth N. K. Tolvanen S. Peltonen J. Sarfraz J. Low-cost, mass-producible nanostructured surface on flexible substrate with ultra-thin gold or silver film for SERS applications. Nano-Struct. Nano-Objects. 2023;34:100956. [Google Scholar]
- Zheng J. He L. Surface-enhanced Raman spectroscopy for the chemical analysis of food. Compr. Rev. Food Sci. Food Saf. 2014;13:317–328. doi: 10.1111/1541-4337.12062. [DOI] [PubMed] [Google Scholar]
- Liu K. Jiang Z. Lalancette R. A. Tang X. Jäkle F. Near-infrared-absorbing B–N lewis pair-functionalized anthracenes: electronic structure tuning, conformational isomerism, and applications in photothermal cancer therapy. J. Am. Chem. Soc. 2022;144:18908–18917. doi: 10.1021/jacs.2c06538. [DOI] [PubMed] [Google Scholar]
- Han X. Zhao C. Wang S. Pan Z. Jiang Z. Tang X. Multifunctional TiO2/C nanosheets derived from 3D metal–organic frameworks for mild-temperature-photothermal-sonodynamic-chemodynamic therapy under photoacoustic image guidance. J. Colloid Interface Sci. 2022;621:360–373. doi: 10.1016/j.jcis.2022.04.077. [DOI] [PubMed] [Google Scholar]
- Jiang Z. Han X. Zhao C. Wang S. Tang X. Recent advance in biological responsive nanomaterials for biosensing and molecular imaging application. Int. J. Mol. Sci. 2022;23:1923. doi: 10.3390/ijms23031923. [DOI] [PMC free article] [PubMed] [Google Scholar]
- Zhang C. Awasthi A. P. Geubelle P. H. Grady M. E. Sottos N. R. Effects of interface roughness on cohesive strength of self-assembled monolayers. Appl. Surf. Sci. 2017;397:192–198. [Google Scholar]
- Liu B. Peng Y. Hao Y. Zhu Y. Chang S. Zhuang S. Ultra-wideband terahertz fingerprint enhancement sensing and inversion model supported by single-pixel reconfigurable graphene metasurface. Photonics. 2024;5:10. [Google Scholar]
- Chen D. Li Y. Li X. Hong X. Fan X. Savidge T. Key difference between transition state stabilization and ground state destabilization: increasing atomic charge densities before or during enzyme–substrate binding. Chem. Sci. 2022;13:8193–8202. doi: 10.1039/d2sc01994a. [DOI] [PMC free article] [PubMed] [Google Scholar]
- Chen J. Shen B. Qin G. Hu X. Qian L. Wang Z. Li S. Ren Y. Zuo L. Fabrication of large-area, high-enhancement SERS substrates with tunable interparticle spacing and application in identifying microorganisms at the single cell level. J. Phys. Chem. C. 2012;116:3320–3328. [Google Scholar]
- Hu B. Das P. Lv X. Shi M. Aa J. Wang K. Duan L. Gilbert J. A. Nie Y. Wu X.-L. Effects of ‘healthy’fecal microbiota transplantation against the deterioration of depression in fawn-hooded rats. Msystems. 2022;7:e00218–e00222. doi: 10.1128/msystems.00218-22. [DOI] [PMC free article] [PubMed] [Google Scholar]
- Liu Y. Zhang Y. Tardivel M. Lequeux M. Chen X. Liu W. Huang J. Tian H. Liu Q. Huang G. Evaluation of the reliability of six commercial SERS substrates. Plasmonics. 2020;15:743–752. [Google Scholar]
- Qiu J. Xu C. Xu X. Zhao Y. Zhao Y. Zhao Y. Wang J. Porous Covalent Organic Framework Based Hydrogen-Bond Nanotrap for the Precise Recognition and Separation of Gold. Angew. Chem. 2023;135:e202300459. doi: 10.1002/anie.202300459. [DOI] [PubMed] [Google Scholar]
- Yan Y. Zhang K. Qin G. Gao B. Zhang T. Huang X. Zhou Y. Phase Engineering on MoS2 to Realize Dielectric Gene Engineering for Enhancing Microwave Absorbing Performance. Adv. Funct. Mater. 2024:2316338. [Google Scholar]
- Li M. Lv S. Yang R. Chu X. Wang X. Wang Z. Peng L. Yang J. Development of lycopene-based whole-cell biosensors for the visual detection of trace explosives and heavy metals. Anal. Chim. Acta. 2023;1283:341934. doi: 10.1016/j.aca.2023.341934. [DOI] [PubMed] [Google Scholar]
- Hu H. Zavabeti A. Quan H. Zhu W. Wei H. Chen D. Ou J. Z. Recent advances in two-dimensional transition metal dichalcogenides for biological sensing. Biosens. Bioelectron. 2019;142:111573. doi: 10.1016/j.bios.2019.111573. [DOI] [PubMed] [Google Scholar]
- Liu K. Jiang Z. Zhao F. Wang W. Jäkle F. Wang N. Tang X. Yin X. Chen P. Triarylboron-Doped Acenethiophenes as Organic Sonosensitizers for Highly Efficient Sonodynamic Therapy with Low Phototoxicity. Adv. Mater. 2022;34:2206594. doi: 10.1002/adma.202206594. [DOI] [PubMed] [Google Scholar]
- He X. Jiang Z. Akakuru O. U. Li J. Wu A. Nanoscale covalent organic frameworks: from controlled synthesis to cancer therapy. Chem. Commun. 2021;57:12417–12435. doi: 10.1039/d1cc04846e. [DOI] [PubMed] [Google Scholar]
- Huang B. Gui M. An H. Shen J. Ye F. Ni Z. Zhan H. Che L. Lai Z. Zeng J. Babao Dan alleviates gut immune and microbiota disorders while impacting the TLR4/MyD88/NF-κB pathway to attenuate 5-Fluorouracil-induced intestinal injury. Biomed. Pharmacother. 2023;166:115387. doi: 10.1016/j.biopha.2023.115387. [DOI] [PubMed] [Google Scholar]
- Zhang C. Awasthi A. P. Sung J. Geubelle P. H. Sottos N. R. Multi-scale model of effects of roughness on the cohesive strength of self-assembled monolayers. Int. J. Fract. 2017;208:131–143. [Google Scholar]
- Presolski S. Pumera M. Covalent functionalization of MoS2. Mater. Today. 2016;19:140–145. [Google Scholar]
- Yadav V. Roy S. Singh P. Khan Z. Jaiswal A. 2D MoS2-based nanomaterials for therapeutic, bioimaging, and biosensing applications. Small. 2019;15:1803706. doi: 10.1002/smll.201803706. [DOI] [PubMed] [Google Scholar]
- Zhang H. Wang Z. Wang G. Song X. Qian Y. Liao Z. Sui L. Ai L. Xia Y. Understanding the connection between gut homeostasis and psychological stress. J. Nutr. 2023;153:924–939. doi: 10.1016/j.tjnut.2023.01.026. [DOI] [PubMed] [Google Scholar]
- Xu T. Yan X. Kang A. Yang L. Li X. Tian Y. Yang R. Qin S. Guo Y. Development of membrane-targeting fluorescent 2-phenyl-1 h-phenanthro [9, 10-d] imidazole-antimicrobial peptide mimic conjugates against methicillin-resistant Staphylococcus aureus. J. Med. Chem. 2024;67:9302–9317. doi: 10.1021/acs.jmedchem.4c00436. [DOI] [PubMed] [Google Scholar]
- Hu W. Ma Y. Zhan Z. Hussain D. Hu C. Robotic intracellular electrochemical sensing for adherent cells. Cyborg Bionic Syst. 2022:9763420. doi: 10.34133/2022/9763420. [DOI] [PMC free article] [PubMed] [Google Scholar]
- Lee S. Shin S. Ham G. Lee J. Choi H. Park H. Jeon H. Characteristics of layered tin disulfide deposited by atomic layer deposition with H2S annealing. AIP Adv. 2017;7:045307. [Google Scholar]
- Gonzalez J. M. Oleynik I. I. Layer-dependent properties of SnS 2 and SnSe 2 two-dimensional materials. Phys. Rev. B. 2016;94:125443. [Google Scholar]
- Lynk T. P. Sit C. S. Brosseau C. L. Electrochemical surface-enhanced Raman spectroscopy as a platform for bacterial detection and identification. Anal. Chem. 2018;90:12639–12646. doi: 10.1021/acs.analchem.8b02806. [DOI] [PubMed] [Google Scholar]
- Niu M.-M. Guo H.-X. Shang J.-C. Meng X.-C. Structural characterization and immunomodulatory activity of a mannose-rich polysaccharide isolated from bifidobacterium breve H4–2. J. Agric. Food Chem. 2023;71:19791–19803. doi: 10.1021/acs.jafc.3c04916. [DOI] [PubMed] [Google Scholar]
- Li J. Yang T. Lang J. Liu H. Gao M. Functionalized MoS2: circular economy SERS substrate for label-free detection of bilirubin in clinical diagnosis. Microchim. Acta. 2023;190:83. doi: 10.1007/s00604-023-05668-4. [DOI] [PubMed] [Google Scholar]
- Liu M. Liu W. Zhang W. Duan P. Shafi M. Zhang C. Hu X. Wang G. Zhang W. π-Conjugated small organic molecule-modified 2D MoS2 with a charge-localization effect enabling direct and sensitive SERS detection. ACS Appl. Mater. Interfaces. 2022;14:56975–56985. doi: 10.1021/acsami.2c17277. [DOI] [PubMed] [Google Scholar]
- Barveen N. R. Xu J.-L. Cheng Y.-W. Photoassisted decoration of Ag-NPs onto the SnS2 nanohexagons for the ultrasensitive SERS detection and degradation of synthetic dyes. J. Environ. Chem. Eng. 2024:112200. [Google Scholar]
- Mohanty A. Kamali K. Au/SnS2 Hybrid Quantum Dots for Surface-Enhanced Raman Scattering-Based Monitoring and Photoreduction of Hg (II) Ions. ACS Appl. Nano Mater. 2024;7(3):3326–3338. [Google Scholar]
- Peng Y. Lin C. Li Y. Gao Y. Wang J. He J. Huang Z. Liu J. Luo X. Yang Y. Identifying infectiousness of SARS-CoV-2 by ultra-sensitive SnS2 SERS biosensors with capillary effect. Matter. 2022;5:694–709. doi: 10.1016/j.matt.2021.11.028. [DOI] [PMC free article] [PubMed] [Google Scholar]
- Li W.-J. Shi E.-W. Ko J.-M. Chen Z.-z. Ogino H. Fukuda T. Hydrothermal synthesis of MoS2 nanowires. J. Cryst. Growth. 2003;250:418–422. [Google Scholar]
- Gajendiran J. Rajendran V. Synthesis of SnS2 nanoparticles by a surfactant-mediated hydrothermal method and their characterization. Adv. Nat. Sci.: Nanosci. Nanotechnol. 2011;2:015001. [Google Scholar]
- Chen X. Berner N. C. Backes C. Duesberg G. S. McDonald A. R. Functionalization of two-dimensional MoS2: on the reaction between MoS2 and organic thiols. Angew. Chem. 2016;128:5897–5902. doi: 10.1002/anie.201510219. [DOI] [PubMed] [Google Scholar]
- Kang T. W. Han J. Lee S. Hwang I.-J. Jeon S.-J. Ju J.-M. Kim M.-J. Yang J.-K. Jun B. Lee C. H. 2D transition metal dichalcogenides with glucan multivalency for antibody-free pathogen recognition. Nat. Commun. 2018;9:2549. doi: 10.1038/s41467-018-04997-w. [DOI] [PMC free article] [PubMed] [Google Scholar]
- Pang Y. Wang C. Wang J. Sun Z. Xiao R. Wang S. Fe3O4@ Ag magnetic nanoparticles for microRNA capture and duplex-specific nuclease signal amplification based SERS detection in cancer cells. Biosens. Bioelectron. 2016;79:574–580. doi: 10.1016/j.bios.2015.12.052. [DOI] [PubMed] [Google Scholar]
- Pu H. Kamruzzaman M. Sun D.-W. Selection of feature wavelengths for developing multispectral imaging systems for quality, safety and authenticity of muscle foods-a review. Trends Food Sci. Technol. 2015;45:86–104. [Google Scholar]
- Willets K. A. Van Duyne R. P. Localized surface plasmon resonance spectroscopy and sensing. Annu. Rev. Phys. Chem. 2007;58:267–297. doi: 10.1146/annurev.physchem.58.032806.104607. [DOI] [PubMed] [Google Scholar]
- Craig A. P. Franca A. S. Irudayaraj J. Surface-enhanced Raman spectroscopy applied to food safety. Annu. Rev. Food Sci. Technol. 2013;4:369–380. doi: 10.1146/annurev-food-022811-101227. [DOI] [PubMed] [Google Scholar]
- Song H. Wu H. Gao Y. Wang K. Su X. Yan S. Shi Y. Production of SnS2 Nanostructure as Improved Light-Assisted Electrochemical Water Splitting. Nanomaterials. 2019;9:1244. doi: 10.3390/nano9091244. [DOI] [PMC free article] [PubMed] [Google Scholar]
- Naujok R. R. Duevel R. V. Corn R. M. Fluorescence and Fourier transform surface-enhanced Raman scattering measurements of methylene blue adsorbed onto a sulfur-modified gold electrode. Langmuir. 1993;9:1771–1774. [Google Scholar]
Associated Data
This section collects any data citations, data availability statements, or supplementary materials included in this article.
Supplementary Materials
Data Availability Statement
All data is available on the request.


