Abstract
Background/Aim
Although the impact of body composition on cancer treatment outcomes of patients with cancer has been increasingly reported, it is still unclear whether the radiodensity of subcutaneous adipose tissue (SAT) on computed tomography (CT) images has a prognostic impact on patients with gastric cancer. We measured muscle and SAT profiles on CT and performed an integrated analysis with clinicopathologic factors.
Patients and Methods
We retrospectively analyzed 230 patients with gastric cancer who underwent gastrectomy between June 2016 and December 2020. SAT radiodensity (SAT-R), and skeletal muscle index (SMI) were measured in preoperative CT images. These were compared with clinicopathologic factors, overall survival (OS), and recurrence-free survival (RFS).
Results
High SAT-R was significantly associated with older age (p=0.003) and lower BMI, lymphocyte, hemoglobin, γ-GTP, cholinesterase, albumin, and triglyceride values (p<0.001, <0.001, 0.027, 0.032, <0.001, 0.001, and <0.001, respectively). In the univariate analysis, high SAT-R, and low SMI were significantly associated with poor OS (p=0.003 and <0.001) and poor RFS (p=0.014 and 0.011). In the multivariate analysis by Cox proportional hazard model, high SAT-R and low SMI were identified as independent prognostic factors for poor OS (p=0.037 and 0.007).
Conclusion
High SAT-R on preoperative CT was associated with poor OS in patients with gastric cancer after gastrectomy. SAT-R has a potential to be a novel prognostic marker for surgically treated patients with gastric cancer.
Keywords: Adipose tissue radiodensity, gastric cancer, skeletal muscle index, survival
Gastric cancer (GC) remains one of the most critical cancers worldwide, with more than 1 million new cases and an estimated 769,000 deaths in 2020, ranking fifth in incidence and fourth in mortality worldwide (1). Despite advances in surgical precision, preoperative chemotherapy, immunotherapy, and nutritional management, postoperative survival rates are unsatisfactory due to increasing patient comorbidities and advanced age (2,3).
In recent years, predicting prognosis of patients with GC based on body composition, including skeletal muscle and adipose tissue identified by preoperative computed tomography (CT), has received much attention, in addition to clinical classifications and blood samples (4). Skeletal mass index (SMI) is a renowned parameter for prognosis of GC (5). The amount of adipose tissue (AT), such as subcutaneous AT (SAT) and visceral AT (VAT), and VAT/SAT ratio are also associated with the prognosis of GC (6,7).
The quantity and quality of skeletal muscle (SM) radiodensity (which reflect lipid deposition within the muscle) have been reported to be associated with mortality (8). Similarly, AT radiodensity (AT-R) has been reported to have a prognostic value in several types of cancer (9-15). However, in GC only a few articles refer to the relationship between prognosis and AT-R (16,17). Therefore, this study focused on AT-R, especially SAT radiodensity (SAT-R), and analyzed its relationship with clinicopathologic factors and prognosis.
Patients and Methods
Patients. We retrospectively collected data from 269 consecutive patients who underwent gastrectomy for primary GC at Chiba University Hospital between June 2016 and December 2020. All the patients were treated according to the Japanese Gastric Cancer Treatment Guidelines (18). Thirty-nine patients were excluded from the study for the following reasons: preoperative chemotherapy administration (25 patients), pathological stage IV (4 patients), and insufficient data for analysis (10 patients). For the remaining 230 patients, clinical and pathological data were obtained from the medical records for retrospective analysis.
The following characteristics were documented for all subjects: age, sex, body mass index (BMI), tumor-node-metastasis stage, computed tomography (CT) image body composition parameters (mentioned later), and laboratory parameters. Postoperative complications were graded according to the Clavien–Dindo classification (19). Cancer staging was based on the 15th edition of the Japanese Classification of Gastric Carcinoma to define pT and pN status (20).
Image analysis. Preoperative portal venous phase contrast-enhanced CT images were analyzed using Image J software (National Institutes of Health, Bethesda, MD, USA) as previously described (21). The skeletal muscle, SAT, and VAT were assessed on a single midlevel slice of the third lumbar vertebra, identified and quantified within tissue specific Hounsfield Unit (HU) ranges of –29 to 150 HU, –190 to –30 HU, and –150 to –50 HU, respectively (21). Each of the area was divided by the square of height in meters to obtain skeletal muscle index (SMI), SAT index (SATI), and VAT index (VATI) following previously published methods (4). Mean CT radiodensity of the area was measured to obtain SM radiodensity, SAT-R, and VAT radiodensity (VAT-R).
The patients were divided into two subgroups based on SMI, SM radiodensity, SATI, SAT-R, VATI, and VAT-R. The cutoff values for SMI were 40.8 cm2/m2 for male and 34.9 cm2/m2 for female, and for radiodensity were 38.5 HU for male and 28.6 HU for female, according to a previous meta-analysis and large cohort study in Asia (5,8). The cutoff values for VATI and SATI were separately estimated for male and female based on the median of each group. For SAT-R and VAT-R, as optimal cutoff values have not been established, we applied the receiver operating characteristic (ROC) curve analysis to predict survival at three years. The Youden Index method was used to set the best cutoffs (22).
Postoperative complications. Postoperative complications occurring within 30 days after gastrectomy and assigned a Clavien–Dindo classification of Grade III or higher were reviewed retrospectively (19). If multiple complications occurred in a single patient, the highest-grade complication was used for analysis.
Follow-up and definition of recurrence. Physical examination and blood testing, including for tumor markers, were performed every three months. Patients underwent CT scans at 6-month intervals during the first two years after surgery and at 1-year intervals until five years after surgery (18). Recurrence was diagnosed based on radiological and/or cytological findings. Even if tumor markers exceeded the normal limits, no diagnosis of recurrence was made before the radiologic and/or cytologic findings were reviewed. The follow-up period was extended to January 2024.
Statistical analysis. Baseline data are presented as medians with interquartile ranges for continuous variables and numbers with percentages for categorical variables. The Mann–Whitney U-test was used to compare continuous variables, whereas Fisher’s exact test was used to compare categorical variables. OS was defined as the interval between the date of gastrectomy and the date of death from any cause. RFS was defined as the interval from the date of gastrectomy to the date of GC recurrence or death from any cause. The survival duration of patients was defined according to the date at which they were last known to be alive. Survival is displayed on Kaplan–Meier curves and compared using the log-rank test. Hazard ratios (HRs) and 95% confidence intervals (CIs) were estimated using a Cox proportional hazard model. p<0.05 was considered to indicate statistical significance. Statistical analysis was conducted using JMP Pro version 17.0 (SAS Institute, Cary, NC, USA).
Results
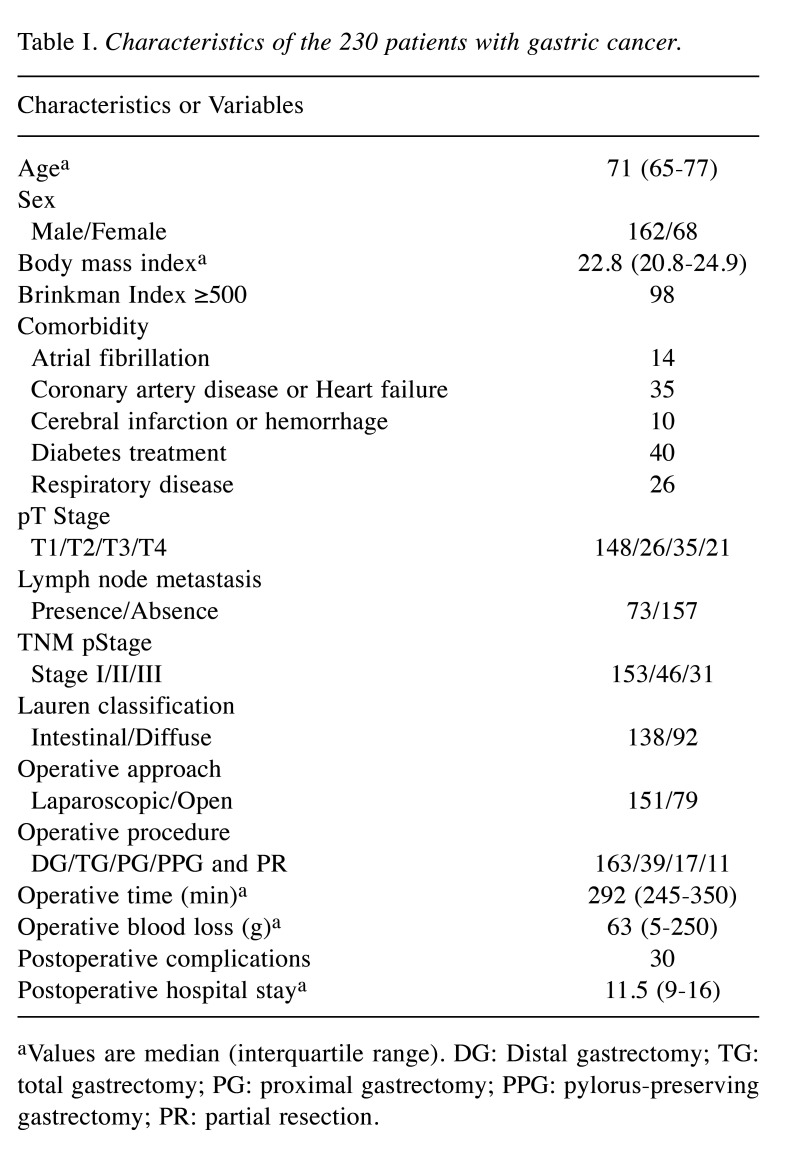
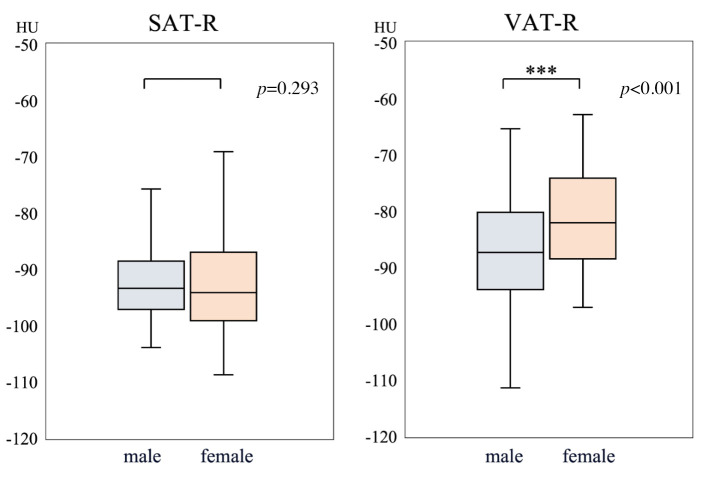
Patient characteristics and correlations with clinical features. The study enrolled 230 patients, including 162 male and 68 female. Clinical and pathological details are summarized in Table I. SMI and SM radiodensity showed a significant positive correlation (p<0.001, r=0.300). In contrast, SATI and SAT-R showed a significant negative correlation (p<0.001, r=–0.713). The same correlation was observed for VATI and VAT-R (p<0.001, r=–0.839). As for sex differences, SMI, SM radiodensity, and VATI were significantly higher in male (p<0.001, <0.001 and <0.001, respectively). Similarly, SATI and VAT-R were significantly higher in female (p=0.007 and <0.001). In contrast, there was no significant difference in SAT-R according to sex (Figure 1).
Table I. Characteristics of the 230 patients with gastric cancer.
aValues are median (interquartile range). DG: Distal gastrectomy; TG: total gastrectomy; PG: proximal gastrectomy; PPG: pylorus-preserving gastrectomy; PR: partial resection.
Figure 1.
Adipose tissue radiodensity difference according to sex. There was no significant difference according to sex in subcutaneous adipose tissue radiodensity (SAT-R). Visceral adipose tissue radiodensity (VAT-R) was significantly higher in females.
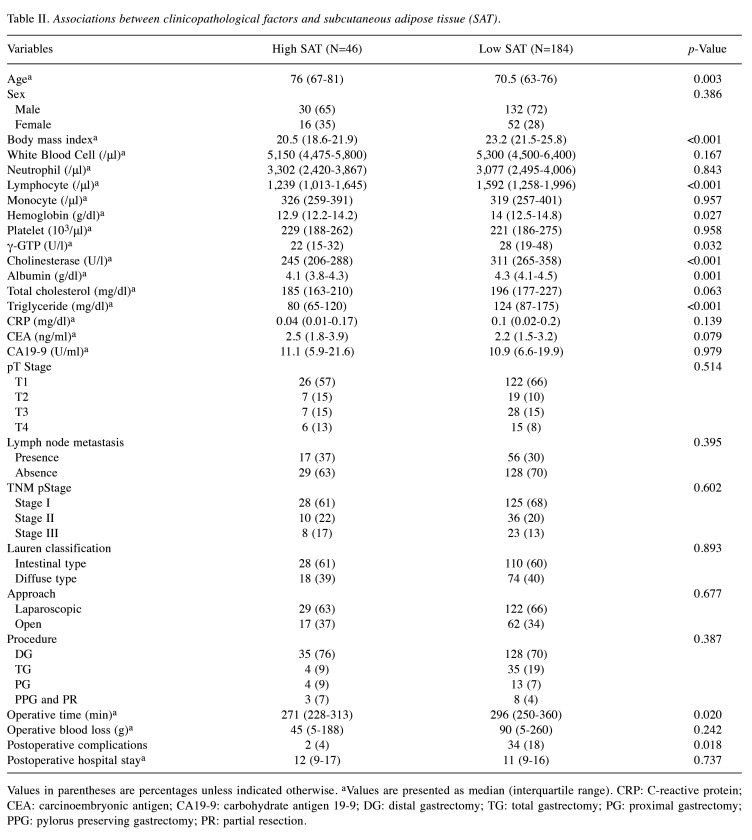
Associations between clinicopathological factors and preoperative SAT-R are shown in Table II. All patients were divided into two groups based on SAT-R: high SAT-R (N=46) and low SAT-R (N=184). Similarly, they were divided into high SMI (N=180) and low SMI (N=50) groups using the cutoff values explained in the methods section. High SAT-R was significantly associated with older age (p=0.003) and lower BMI, lymphocyte, hemoglobin, γ-GTP, cholinesterase, albumin, and triglyceride values (p<0.001, <0.001, 0.027, 0.032, <0.001, 0.001, and <0.001, respectively). Surgical outcomes were also compared with preoperative SAT-R. High SAT-R was associated with a significantly shorter operative time (p=0.020) and fewer postoperative complications (p=0.018).
Table II. Associations between clinicopathological factors and subcutaneous adipose tissue (SAT).
Values in parentheses are percentages unless indicated otherwise. aValues are presented as median (interquartile range). CRP: C-reactive protein; CEA: carcinoembryonic antigen; CA19-9: carbohydrate antigen 19-9; DG: distal gastrectomy; TG: total gastrectomy; PG: proximal gastrectomy; PPG: pylorus preserving gastrectomy; PR: partial resection.
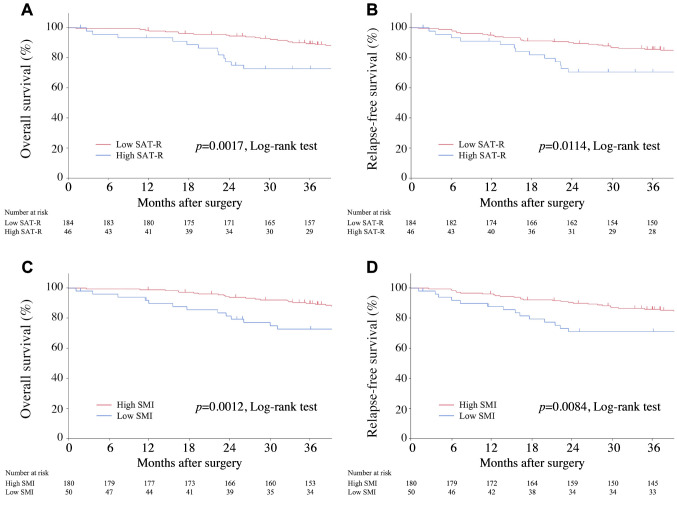
Survival outcomes and prognostic analyses. The median observation period was 4.6 years (interquartile range=3.3-5.0 years). The three-year OS and RFS rates for all patients in this cohort were 86.2% and 82.7%, respectively. Kaplan–Meier analyses demonstrated that high SAT-R was associated with poor OS (p=0.002) and poor RFS (p=0.011), with three-year OS rates of 72.8%, and three-year RFS rates of 70.6% (Figure 2). Similarly, low SMI was significantly associated with poor OS and RFS.
Figure 2.
Kaplan–Meier overall survival (OS) and recurrence-free survival (RFS) curves according to subcutaneous adipose tissue radiodensity (SAT-R) radiodensity and skeletal muscle index (SMI). Kaplan–Meier OS curves according to SAT-R (A) and SMI (C). Kaplan–Meier RFS curves according to SAT-R (B) and SMI (D). OS and RFS were significantly worse in the high SAT-R and low SMI groups than in the other groups.
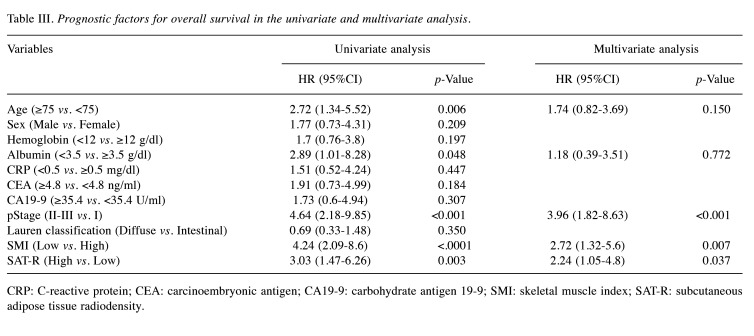
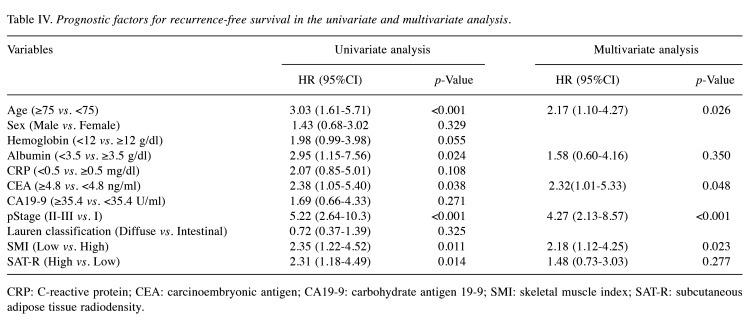
Given that SAT-R was significantly associated with nutritional and inflammatory markers, it is possible that the relationship between body composition markers and OS was confounded by these factors. Therefore, we performed univariate and multivariate analyses, including body composition markers and clinicopathological factors, including albumin and C-reactive protein (CRP) levels, to further test the prognostic relevance of body composition markers. Among a number of body composition markers, we focused on SMI, the most well-known marker, and SAT-R, which shows minimal variation among sexes.
In the univariate survival analysis (Table III and Table IV), age ≥75 years, albumin <3.5 g/dl, pStage ≥II, low SMI, and high SAT-R were significantly associated with poor OS (p=0.006, 0.048, <0.001, <0.001, and 0.003, respectively). Age ≥75 years, albumin <3.5 g/dl, CEA ≥4.8 ng/ml, pStage ≥II, low SMI, and high SAT-R were related to poor RFS (p<0.001, 0.024, 0.038, <0.001, 0.011, and 0.014, respectively). Variables that showed statistical significance (p<0.05) in the univariate analysis were selected for the multivariate analysis.
Table III. Prognostic factors for overall survival in the univariate and multivariate analysis.
CRP: C-reactive protein; CEA: carcinoembryonic antigen; CA19-9: carbohydrate antigen 19-9; SMI: skeletal muscle index; SAT-R: subcutaneous adipose tissue radiodensity.
Table IV. Prognostic factors for recurrence-free survival in the univariate and multivariate analysis.
CRP: C-reactive protein; CEA: carcinoembryonic antigen; CA19-9: carbohydrate antigen 19-9; SMI: skeletal muscle index; SAT-R: subcutaneous adipose tissue radiodensity.
In the multivariate analysis, pStage ≥II, low SMI, and high SAT-R remained independent predictors for poor OS (p<0.001, 0.007, and 0.037, respectively), and age ≥75 years, CEA ≥4.8 ng/ml, pStage ≥II, and low SMI were independent predictors for poor RFS (p=0.026, 0.048, <0.001, and 0.023, respectively).
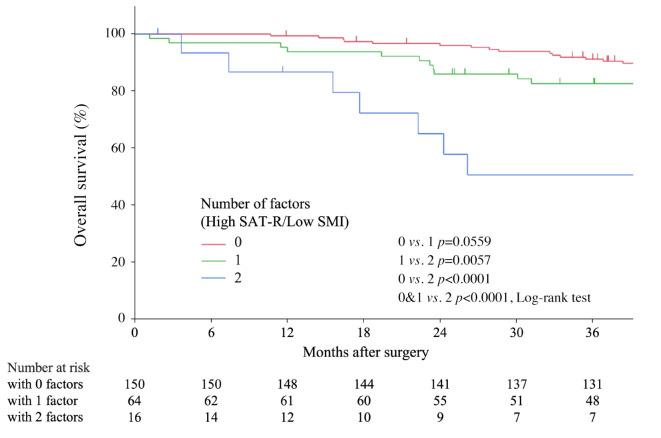
Combination of SMI and SAT radiodensity for more sensitive prognostic prediction in patients with gastric cancer. Given the independent correlations of SAT-R and SMI with OS, we considered that combining SMI and AT-R would enable a more sensitive prediction. Patients were divided into three groups depending on the presence of factors (Figure 3): patients with neither high SAT-R nor low SMI (0 factors), patients with either high SAT-R or low SMI (1 factor), and patients with both high SAT-R and low SMI (2 factors). Regarding the combination of SAT-R and SMI, patients with these two factors had the worst OS (0 and 1 vs. 2, p<0.001).
Figure 3.
Kaplan–Meier overall survival (OS) curves according to the combination of subcutaneous adipose tissue radiodensity and skeletal muscle index. OS was significantly worse in patients with two factors compared with others.
Discussion
In our cohort of patients with GC, preoperative low SMI and high SAT-R were associated with a higher risk of death. This study suggests that SAT-R contributes to prognosis after gastrectomy independent of pathologic stage and serum markers. Furthermore, we found the combination of SAT-R and SMI enabled more sensitive prognostic prediction. To the best of our knowledge, this is the first study to investigate the importance of high SAT-R in long-term survival of patients after gastrectomy.
Previous studies have mentioned the association between high SAT-R and mortality may reflect reduced lipid storage capacity of SAT (10,13), and high VAT-R might represent a microenvironment of VAT in which cancer cells could easily recur and progress (16). Although the distribution of AT clearly differs by sex, the difference in AT-R between male and female is still disputable. A study in lung cancer shows less sex difference in SAT-R than VAT-R (13), while no difference was found in both SAT-R and VAT-R in kidney cancer (14). Even though it is not clear whether SAT-R or VAT-R is more important for predicting prognosis in GC, we focused on SAT-R, which shows less difference according to sex, for predicting prognosis of patients with GC.
AT-R is associated with many factors, including body weight and nutritional status, inflammation, blood flow, and adipose tissue microenvironment and transformation, which may influence poor prognosis in patients with GC. Firstly, AT-R has been reported to mainly reflect the lipid content, size of adipocytes (23,24). In our study, AT-R was significantly associated with nutritional markers, such as BMI, albumin, and cholesterol, suggesting that preoperative low body weight and poor nutrition may have influenced poor prognosis. Regarding inflammation, previous studies consider the increased radiodensity may be a sign of inflammation (9,10), but serum inflammatory markers have limited value for predicting alterations of adipose tissue (15).
Although we did not conduct microscopic studies, there are many reports on adipose tissue microenvironment and transformation. Adipose tissue has been reported to have comprehensive endocrine functions in the regulation of various metabolic and inflammatory states (25). Upon exposure to cancer cells, adipocytes lose their intracellular lipid content, secrete inflammatory cytokines, and exhibit a fibroblast-like morphology (26). These modified adipocytes promote tumor progression and metastasis (27). In addition, adipose tissue browning, which causes wasting thermal energy and weight loss in cancer cachexia (28), might be detected by AT-R (13). Thus, AT-R reflects many factors, and further study in more patients to elucidate the mechanism are needed to improve the prognosis of patients with GC.
Study limitations. First, the study was conducted using retrospective data from a single Japanese institution, so validation studies with another cohort are needed. Second, adjuvant chemotherapy was not evaluated, so it may have influenced the outcome. Finally, the use of contrast-enhanced CT may have influenced the results of this study through patient’s cardiac function. However, the impact of using contrast-enhanced CT is limited according to previously report (23,24).
Conclusion
High SAT-R on preoperative CT was identified as an independent prognostic factor for survival in patients with GC after gastrectomy. The combination of SAT-R and SMI might enable more sensitive prognostic prediction for surgically treated patients with GC.
Conflicts of Interest
All Authors declare no conflicts of interest in relation to this study.
Authors’ Contributions
All Authors contributed to the study conception and design. Y.M, K.H, K.M, T.T, Y.K, R.O, Y.T contribute to patient care and data collection. Image data was analysed by S.I with advice from K.H, Y.K, Y.T. The first draft of the manuscript was written by S.I under the supervision of Y.M, H.M. All Authors critically reviewed and revised the manuscript draft and approved the final version for submission.
Acknowledgements
The Authors would like to thank Editage (www.editage.com) for English language editing.
Funding
This study was supported by the Japan Society for the Promotion of Science (JSPS) KAKENHI grant (JP22K08747).
References
- 1.Sung H, Ferlay J, Siegel RL, Laversanne M, Soerjomataram I, Jemal A, Bray F. Global Cancer Statistics 2020: GLOBOCAN estimates of incidence and mortality worldwide for 36 cancers in 185 countries. CA Cancer J Clin. 2021;71(3):209–249. doi: 10.3322/caac.21660. [DOI] [PubMed] [Google Scholar]
- 2.Ito Y, Miwa T, Kanda M, Ito S, Mochizuki Y, Teramoto H, Ishigure K, Murai T, Asada T, Ishiyama A, Matsushita H, Tanaka C, Kobayashi D, Fujiwara M, Murotani K, Kodera Y. Risk score for predicting death from other causes after curative gastrectomy for gastric cancer. Gastric Cancer. 2023;26(2):317–323. doi: 10.1007/s10120-022-01354-1. [DOI] [PubMed] [Google Scholar]
- 3.Nunobe S, Oda I, Ishikawa T, Akazawa K, Katai H, Isobe Y, Miyashiro I, Tsujitani S, Ono H, Tanabe S, Fukagawa T, Suzuki S, Kakeji Y, Registration Committee of the Japanese Gastric Cancer Surgical outcomes of elderly patients with Stage I gastric cancer from the nationwide registry of the Japanese Gastric Cancer Association. Gastric Cancer. 2020;23:328–338. doi: 10.1007/s10120-019-01000-3. [DOI] [PubMed] [Google Scholar]
- 4.Yoon SB, Choi MH, Song M, Lee JH, Lee IS, Lee MA, Hong TH, Jung ES, Choi MG. Impact of preoperative body compositions on survival following resection of biliary tract cancer. J Cachexia Sarcopenia Muscle. 2019;10(4):794–802. doi: 10.1002/jcsm.12431. [DOI] [PMC free article] [PubMed] [Google Scholar]
- 5.Rinninella E, Cintoni M, Raoul P, Pozzo C, Strippoli A, Bria E, Tortora G, Gasbarrini A, Mele MC. Muscle mass, assessed at diagnosis by L3-CT scan as a prognostic marker of clinical outcomes in patients with gastric cancer: Asystematic review and meta-analysis. Clinical Nutrition. 2020;39(7):2045–2054. doi: 10.1016/j.clnu.2019.10.021. [DOI] [PubMed] [Google Scholar]
- 6.Dong QT, Cai HY, Zhang Z, Zou HB, Dong WX, Wang W Bin, Song HN, Luo X, Chen XL, Huang DD. Influence of body composition, muscle strength, and physical performance on the postoperative complications and survival after radical gastrectomy for gastric cancer: A comprehensive analysis from a large-scale prospective study. Clin Nutr. 2021;40(5):3360–3369. doi: 10.1016/j.clnu.2020.11.007. [DOI] [PubMed] [Google Scholar]
- 7.Hashimoto I, Komori K, Onuma S, Watanabe H, Suematsu H, Nagasawa S, Kano K, Kawabe T, Aoyama T, Hayashi T, Yamada T, Sato T, Ogata T, Cho H, Yoshikawa T, Rino Y, Saito A, Oshima T. Preoperative visceral-to-subcutaneous fat ratio by sex as a predictor of postoperative survival in patients with gastric cancer. Anticancer Res. 2024;44(8):3515–3524. doi: 10.21873/anticanres.17172. [DOI] [PubMed] [Google Scholar]
- 8.Zhuang CL, Shen X, Huang YY, Zhang FM, Chen XY, Ma LL, Chen XL, Yu Z, Wang SL. Myosteatosis predicts prognosis after radical gastrectomy for gastric cancer: A propensity score–matched analysis from a large-scale cohort. Surgery (United States) 2019;166(3):297–304. doi: 10.1016/j.surg.2019.03.020. [DOI] [PubMed] [Google Scholar]
- 9.Feliciano EMC, Winkels RM, Meyerhardt JA, Prado CM, Afman LA, Caan BJ. Abdominal adipose tissue radiodensity is associated with survival after colorectal cancer. Am J Clin Nutr. 2021;114(6):1917–1924. doi: 10.1093/ajcn/nqab285. [DOI] [PMC free article] [PubMed] [Google Scholar]
- 10.Cheng E, Caan BJ, Chen WY, Irwin ML, Prado CM, Cespedes Feliciano EM. Adipose tissue radiodensity and mortality among patients with nonmetastatic breast cancer. Clin Nutr. 2022;41(12):2607–2613. doi: 10.1016/j.clnu.2022.09.016. [DOI] [PMC free article] [PubMed] [Google Scholar]
- 11.Veld J, Vossen JA, De Amorim Bernstein K, Halpern EF, Torriani M, Bredella MA. Adipose tissue and muscle attenuation as novel biomarkers predicting mortality in patients with extremity sarcomas. Eur Radiol. 2016;26(12):4649–4655. doi: 10.1007/s00330-016-4306-6. [DOI] [PubMed] [Google Scholar]
- 12.Ebadi M, Moctezuma-Velazquez C, Meza-Junco J, Baracos VE, DunichandHoedl AR, Ghosh S, Sarlieve P, Owen RJ, Kneteman N, Montano-Loza AJ. Visceral adipose tissue radiodensity is linked to prognosis in hepatocellular carcinoma patients treated with selective internal radiation therapy. Cancers (Basel) 2020;12(2):356. doi: 10.3390/cancers12020356. [DOI] [PMC free article] [PubMed] [Google Scholar]
- 13.Sun Y, Deng M, Gevaert O, Aberle M, Olde Damink SW, Van Dijk D, Rensen SS. Tumor metabolic activity is associated with subcutaneous adipose tissue radiodensity and survival in non-small cell lung cancer. Clin Nutr. 2024;43(7):1809–1815. doi: 10.1016/j.clnu.2024.05.040. [DOI] [PubMed] [Google Scholar]
- 14.Furberg H, Bradshaw PT, Knezevic A, Olsson L, Petruzella S, Stein E, Paris M, Scott J, Akin O, Hakimi AA, Russo P, Sanchez A, Caan B, Mourtzakis M. Skeletal muscle and visceral adipose radiodensities are pre-surgical, non-invasive markers of aggressive kidney cancer. J Cachexia Sarcopenia Muscle. 2024;15(2):726–734. doi: 10.1002/jcsm.13429. [DOI] [PMC free article] [PubMed] [Google Scholar]
- 15.Lee JW, Lee SM, Chung YA. Prognostic value of CT attenuation and FDG uptake of adipose tissue in patients with pancreatic adenocarcinoma. Clin Radiol. 2018;73(12):1056.e1–1056.e10. doi: 10.1016/j.crad.2018.07.094. [DOI] [PubMed] [Google Scholar]
- 16.Lee JW, Son MW, Chung IK, Cho YS, Lee MS, Lee SM. Significance of CT attenuation and F-18 fluorodeoxyglucose uptake of visceral adipose tissue for predicting survival in gastric cancer patients after curative surgical resection. Gastric Cancer. 2020;23(2):273–284. doi: 10.1007/s10120-019-01001-2. [DOI] [PMC free article] [PubMed] [Google Scholar]
- 17.Bian L, Wu D, Chen Y, Ni J, Qu H, Li Z, Chen X. Associations of radiological features of adipose tissues with postoperative complications and overall survival of gastric cancer patients. Eur Radiol. 2022;32(12):8569–8578. doi: 10.1007/s00330-022-08918-w. [DOI] [PubMed] [Google Scholar]
- 18.Japanese Gastric Cancer Association Japanese Gastric Cancer Treatment Guidelines 2021 (6th edition) Gastric Cancer. 2023;26(1):1–25. doi: 10.1007/s10120-022-01331-8. [DOI] [PMC free article] [PubMed] [Google Scholar]
- 19.Dindo D, Demartines N, Clavien PA. Classification of surgical complications: a new proposal with evaluation in a cohort of 6336 patients and results of a survey. Ann Surg. 2004;240(2):205–213. doi: 10.1097/01.sla.0000133083.54934.ae. [DOI] [PMC free article] [PubMed] [Google Scholar]
- 20.Sano T, Aiko T. New Japanese classifications and treatment guidelines for gastric cancer: revision concepts and major revised points. Gastric Cancer. 2011;14(2):97–100. doi: 10.1007/s10120-011-0040-6. [DOI] [PubMed] [Google Scholar]
- 21.Gomez-Perez S, McKeever L, Sheean P. Tutorial: A step-by-step guide (version 2.0) for measuring abdominal circumference and skeletal muscle from a single cross-sectional computed-tomography image using the National Institutes of Health ImageJ. JPEN J Parenter Enteral Nutr. 2020;44(3):419–424. doi: 10.1002/jpen.1721. [DOI] [PubMed] [Google Scholar]
- 22.Youden WJ. Index for rating diagnostic tests. Cancer. 1950;3(1):32–35. doi: 10.1002/1097-0142(1950)3:1<32::aid-cncr2820030106>3.0.co;2-3. [DOI] [PubMed] [Google Scholar]
- 23.Quail DF, Dannenberg AJ. The obese adipose tissue microenvironment in cancer development and progression. Nat Rev Endocrinol. 2019;15(3):139–154. doi: 10.1038/s41574-018-0126-x. [DOI] [PMC free article] [PubMed] [Google Scholar]
- 24.Côté JA, Nazare JA, Nadeau M, Leboeuf M, Blackburn L, Després JP, Tchernof A. Computed tomography-measured adipose tissue attenuation and area both predict adipocyte size and cardiometabolic risk in women. Adipocyte. 2015;5(1):35–42. doi: 10.1080/21623945.2015.1106057. [DOI] [PMC free article] [PubMed] [Google Scholar]
- 25.Ibrahim MM. Subcutaneous and visceral adipose tissue: structural and functional differences. Obes Rev. 2010;11(1):11–18. doi: 10.1111/j.1467-789X.2009.00623.x. [DOI] [PubMed] [Google Scholar]
- 26.Dirat B, Bochet L, Dabek M, Daviaud D, Dauvillier S, Majed B, Wang YY, Meulle A, Salles B, Le Gonidec S, Garrido I, Escourrou G, Valet P, Muller C. Cancer-associated adipocytes exhibit an activated phenotype and contribute to breast cancer invasion. Cancer Res. 2011;71(7):2455–2465. doi: 10.1158/0008-5472.CAN-10-3323. [DOI] [PubMed] [Google Scholar]
- 27.Bochet L, Lehuédé C, Dauvillier S, Wang YY, Dirat B, Laurent V, Dray C, Guiet R, Maridonneau-Parini I, Le Gonidec S, Couderc B, Escourrou G, Valet P, Muller C. Adipocyte-derived fibroblasts promote tumor progression and contribute to the desmoplastic reaction in breast cancer. Cancer Res. 2013;73(18):5657–5668. doi: 10.1158/0008-5472.CAN-13-0530. [DOI] [PubMed] [Google Scholar]
- 28.Henriques F, Batista Júnior ML. Adipose tissue remodeling during cancer-associated cachexia: translational features from adipose tissue dysfunction. Immunometabolism. 2020;2(4):e200032. doi: 10.20900/immunometab20200032. [DOI] [Google Scholar]


