Abstract
Evaluating complicated stress across the elbow under joint motion remains difficult. Here, we aimed to evaluate the distribution of the subchondral bone density in the normal elbow bones and further characterize their spatial relationships during elbow motion to estimate the loading stress across the articular surface using three-dimensional computed tomography bone models. The normal elbow joint exhibited a consistent distribution pattern of subchondral bone density. High-density regions were distributed in the capitellum and posterior humeral trochlea, sagittal ridge of the ulnar trochlear notch and ulnar-volar side of the radial head. Motion analyses revealed that the high-density regions proximate with elbow flexion with forearm pronation in the radiocapitellar joint and in the fully extended position in the ulnohumeral joint. This reasonably reflects the stress acting on the joint surface under actual loading conditions. These findings suggest that daily activities involving lifting or carrying objects in these positions are stress-prone activities.
Keywords: Bone density, Computed tomography (CT), Elbow joint, Motion analysis, Stress distribution, Subchondral bone
Subject terms: Musculoskeletal system, Computational models
Introduction
The elbow joint connects the arm and forearm, controlling the reach length and hand orientation. It serves as a link in the lever arm system that positions the hand as a fulcrum of the forearm lever and is described as a load-carrying joint1. The elbow has a wide range of flexion–extension and rotation motions, and stresses on the elbow joint are generated from the axial load and shearing, compression, and collision forces, unlike the lower extremities that are continuously exposed to reaction forces from the ground. Thus, evaluating stress across the elbow under joint motion is difficult.
The distribution of subchondral bone density reflects the stress acting on the joint surface under actual loading conditions2–5. Physical forces and skeletal biology closely interact according to the laws by which the mechanical environment regulates bone remodelling2. Varying loads result in a self-optimizing structural adaptation to the long-term distribution of stress acting on the articular surfaces under natural, physiological conditions2. However, the pressure on the articular surfaces is conveyed directly to the subchondral bone; therefore, according to the theory of causal histogenesis, the distribution patterns of subchondral bone density represent a materialized field of stress with these specific mechanical conditions long-term5,6. In this study, we hypothesized that the normal elbow joint would exhibit a consistent distribution pattern of subchondral bone density, with regions of high-density proximated near each other at particular positions during elbow movements. We previously identified characteristic patterns of contact areas by measuring the proximity distances between entire articular surfaces using surface models across various positions7,8. However, evaluating the load-related high-density patterns during elbow motion offers additional insights into the complex mechanical environment across the joints beyond what was revealed in previous studies that focused solely on congruity based on contact areas.
Detailed knowledge of the in vivo loading conditions around the elbow joint would provide important insights into the pathophysiology and prevention of elbow disorders, surgical and nonsurgical management strategies, and development and design of anatomical implants or orthoses. The distribution of stress and degeneration of subchondral bone are closely related to the development of osteoarthritis (OA)9–15. Gaining a better understanding of the mechanical environment of the elbow joint, which has been inadequately characterized, could enhance our comprehension of OA pathogenesis and provide valuable information for developing treatment strategies, such as avoiding specific overload positions. Additionally, replicating physiological movements and restoring normal kinematics in the elbow joint are crucial for implant development16–19. The findings from this study, when integrated with existing knowledge on implant design, are expected to contribute to improved postoperative outcomes20,21. Therefore, we aimed to address these gaps by (1) evaluating the distribution of the subchondral bone density of the elbow and (2) characterizing their spatial relationships during elbow motion to estimate the loading stress across the articular surface. To achieve this, we measured subchondral bone density in the distal humerus, proximal ulna, and radial head using a three-dimensional (3-D) computed tomography (CT) bone model. Second, we characterized their mutual relationships during elbow flexion–extension and forearm rotation motions using proximity mapping.
Materials and methods
Study setting
The Institutional Review Board of Osaka University Hospital approved this study (approval number: 19247; date of approval: 11 November 2019). All procedures were conducted in accordance with the ethical standards of the responsible committees on human experimentation (institutional and national) and with the Helsinki Declaration of 1975, as revised in 2013. All participants provided written informed consent.
A total of 24 healthy elbows were included in this study. We obtained the CT images of 6 healthy volunteers and 18 healthy elbows that were scanned as contralateral controls for surgery. Patients were eligible if they had no history of elbow pain or radiographic evidence of arthritic changes.
Patient characteristics
Nineteen men and five women were included, and their mean age was 31.9 ± 10.7 years (range 14–51). Twelve elbows on the dominant side and 12 on the nondominant side were analysed. The mean ranges of elbow extension and flexion were 4.1° ± 6.9° (range − 10° to 20°) and 139.1° ± 3.6° (range 130°–145°), respectively. None of the participants engaged in heavy labour.
CT scanning
The full length of the upper limb was scanned with the elbow in full extension, and the forearm was maintained in full supination according to a standard, low-dose radiation scanning protocol22. We used a helical-type CT scanner (LightSpeed Ultra 16; GE Healthcare, Waukesha, Wisconsin, USA) with a low radiation-dose technique (slice thickness, 1.25 mm; pixel size, 0.75–0.85 mm; scan time, 0.5 s; scan pitch, 0.562:1; tube current, 20–150 mA; and tube voltage, 120 kV). The original CT Digital Imaging and Communications in Medicine (DICOM) files were obtained through the institutional picture archiving and communication system database.
Bone model reconstruction and motion axis determination
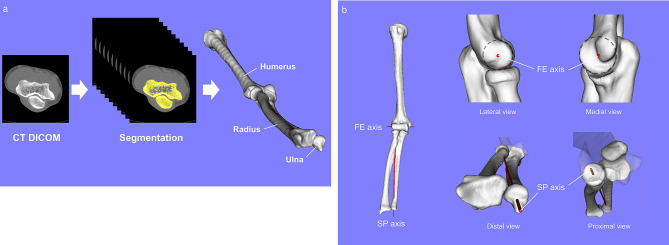
Digital data were imported into the image processing software MvIndev/BoneSimulator (Teijin Nakashima Medical Co., Ltd.), and 3-D bone models of the humerus, ulna, and radius were created by semiautomatic segmentation using a global threshold algorithm23 (Fig. 1A).
Fig. 1.
Illustrations depicting (A) the process of creating the model and (B) motion axis determination. Axes for flexion–extension of the elbow and supination–pronation of the forearm. Dashed circles are approximated to the lateral verge of the capitellum and medial verge of the humeral trochlea, and the axis passing through the centres of the circles is determined as the FE axis of the elbow. The SP axis of the forearm is determined as the axis passing through the radial head centre and ulnar fovea.
Anatomical axes for flexion–extension and supination–pronation motions were determined for the subsequent motion analysis. The axis for flexion–extension of the elbow (FE axis) was defined as the line passing through the centres of the circles approximated to the lateral verge of the capitellum and medial verge of the humeral trochlea24. The axis for supination–pronation of the forearm (SP axis) was defined as the line passing through the radial head centre and ulnar fovea25,26 (Fig. 1B).
Points of interest
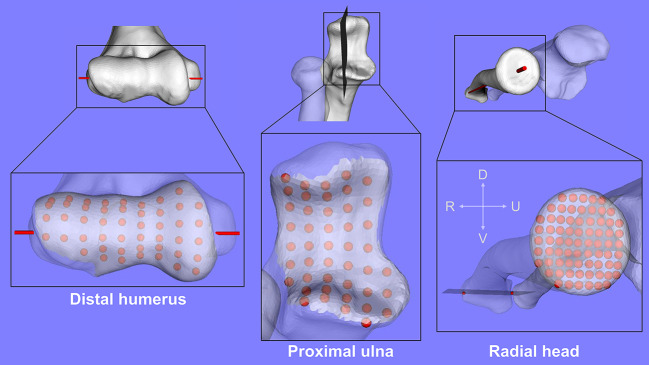
The border of the articular surface of the elbow bones (including the distal humerus, proximal ulna, and radial head) was selected by carefully tracing the visible perimeter. Points of interest were distributed in a grid pattern 2 mm deep on the articular surface, based on previous findings that subchondral bone thickness ranges from 1.0 to 3.2 mm27. The grids on the distal humerus were distributed by dividing the articular surface into 10 equal lengths both along the FE axis and in the direction perpendicular to it. On the proximal ulna, the grids were aligned in the sagittal plane, determined based on the following three reference points: the coronoid and olecranon tips and the bottom of the sagittal ridge of the ulnar trochlear notch, with the same interval as the distal humerus. For the radial head, the axis was defined by connecting the centre of the dish of the radial head and the apex of the distal radial styloid. The plane containing this axis, referred to as the ‘rad-plane’, was determined at the midpoint between the volar and dorsal rims of the sigmoid notch of the distal radius in the radioulnar direction. The grids of the radial head were distributed by dividing the diameter of the radial head into 10 equal lengths in the radial-ulnar and dorsal-volar directions (Fig. 2)28.
Fig. 2.
Illustrations depicting points of interest for the distal humerus, proximal ulna, and radial head. D dorsal direction, V volar direction, R radial direction, U ulnar direction.
Subchondral bone density measurement
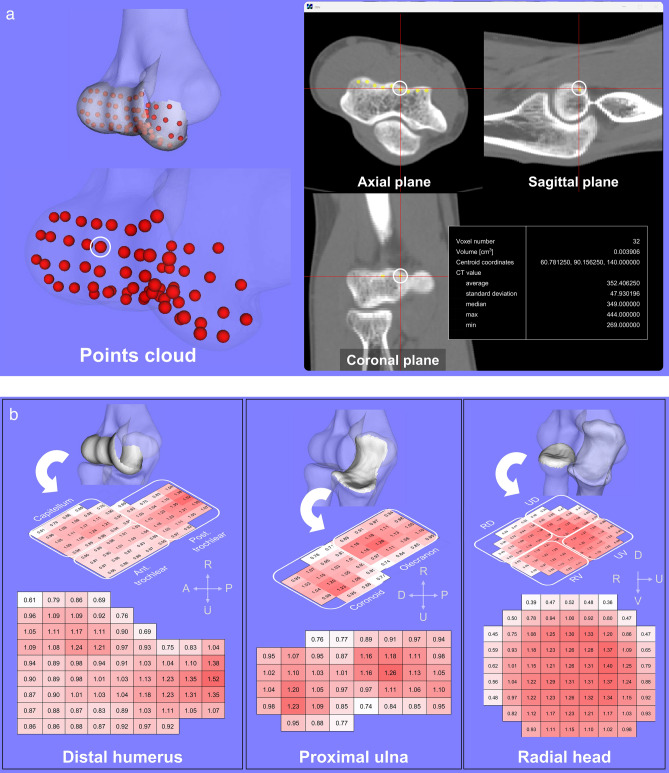
The point cloud data created in the STL file format using the 3-D modelling software were superimposed onto the DICOM images. Volumetric bone densities for the 1-mm-diameter sphere centred at each point of interest were measured in Hounsfield units, with modifications29,30 (Fig. 3A). A 1-mm size was determined by considering subchondral bone thickness and ensuring that the grids did not overlap. As an internal standard, the relative percentage values of the average bone density at all points of interest of the respective bone were calculated to obviate the problems that arise from individual variation (bone quality and bone metabolic profile), scanner variation, and the absence of a calibration phantom31–34.
Fig. 3.
(A) Illustrations depicting measurement of subchondral bone density. The white circle indicates the point being measured. (B) Subchondral bone density analysis in the individual bones. Heat maps showing the subchondral bone density distribution are presented. The numbers in the cell represent the average of the relative values of the individual bones (standardized and coloured). R radial direction, U ulnar direction, A anterior direction, P posterior direction in the distal humerus, D distal direction, P proximal direction in the proximal ulna, D dorsal direction, V volar direction, R radial direction, U ulnar direction in the radial head.
The points were categorized according to anatomical regions, and the bone density values were calculated by averaging the densities of all points of interest within each categorized region. The articular surface of the distal humerus was subdivided into the capitellum, anterior trochlear, and posterior trochlear; that of the proximal ulna was subdivided into the coronoid and olecranon; and that of the radial head was subdivided into radial-dorsal, ulnar-dorsal, radial-volar, and ulnar-volar regions (Fig. 3B).
Extraction of high-density region by binarization
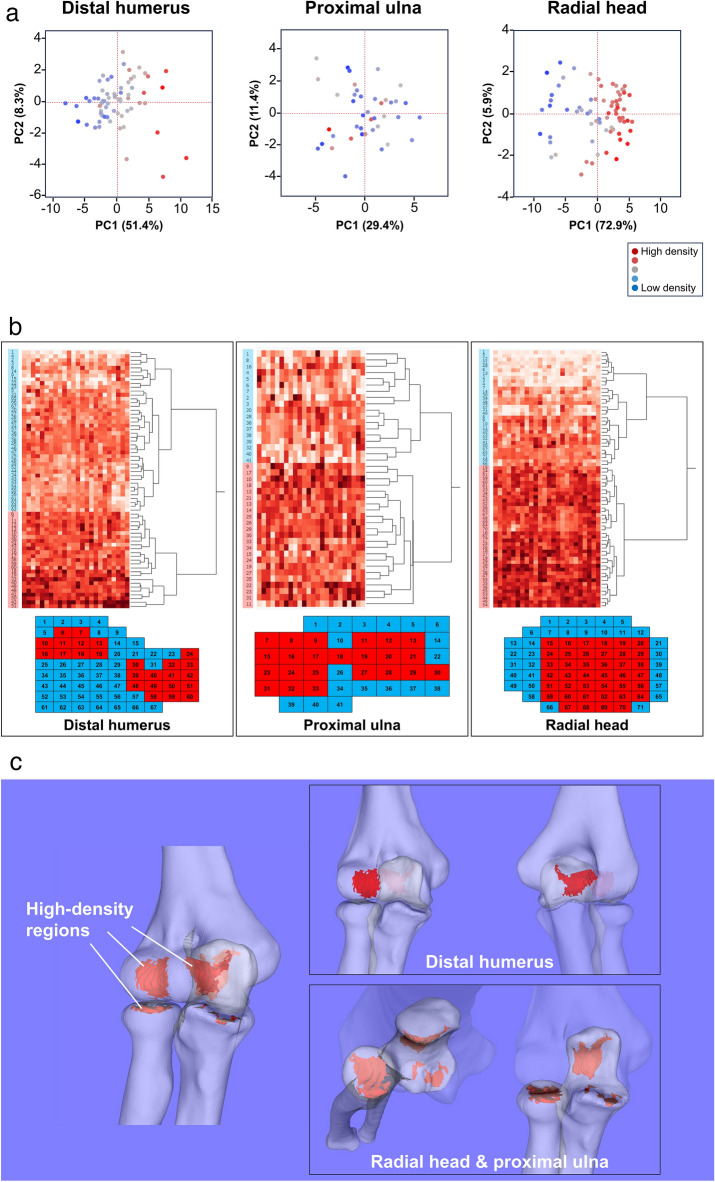
We used principal components analysis and the hierarchical clustering approach to identify clusters exhibiting similar bone density values and extracted the high-density regions accordingly (Fig. 4A,B)31–34. The points were grouped based on the results of hierarchical clustering into the following two different categories for subsequent motion analyses: (1) high-density region (HDR) and (2) low-density region (LDR). In individual bones, a 3-D model for the HDR was created by extracting the subchondral region identified with a threshold bone density value according to the clustering results (Fig. 4C). The individual threshold was determined based on a grouped bone density value of the HDR. The grouped bone density value was calculated by averaging the values of all points of interest in a categorized region.
Fig. 4.
Extraction of high-density region by binarization. Multivariate analyses of (A) principal components analysis and (B) hierarchical cluster analysis for all bone density values at the relevant individual points of interest in the distal humerus, proximal ulna, and radial head. A hierarchical clustering approach binarizes the HDR (red) and LDR (blue). The numbers in the cells represent anatomical points of interest. (C) Distribution patterns of the high-bone density region. Distribution of the high-density region on the capitellum and posterior part of the humeral trochlea is shown in the anterior and posterior views of the elbow (upper right). The distributions of the high-density region on the posterior part of the trochlear notch on the proximal ulna and ulnar-volar side of the radial head are shown on the proximal and anterior views of the elbow (lower right).
Motion analysis of the high-density region
To evaluate the stress across the joint surface during flexion–extension and supination–pronation motions, we assessed the spatial relationship among high-density regions of the individual bone throughout the movement. The flexion–extension motion was reproduced by rotating the forearm bones around the FE axis, and the supination–pronation motion was reproduced by rotating the radius around the SP axis. We defined 0° of extension as when the angle between the principal axes of inertia for the humerus and ulna was 180°. Regarding forearm rotation, we defined 90° of supination as when the position of the rad-plane passed through the ulnar styloid process. The elbow was virtually flexed to 150° and pronated to 90°, with 10° increments. The flexion angles were categorized as extension (< 60° of flexion), flexion (≥ 60° and < 120° of flexion), and full flexion (≥ 120° of flexion), and the rotation angles were categorized as supination (≤ 90° and > 30° of supination), neutral (≤ 30° of supination and ≤ 30° of pronation), and pronation (> 30° and ≤ 90° of pronation) (Fig. 5A).
Fig. 5.
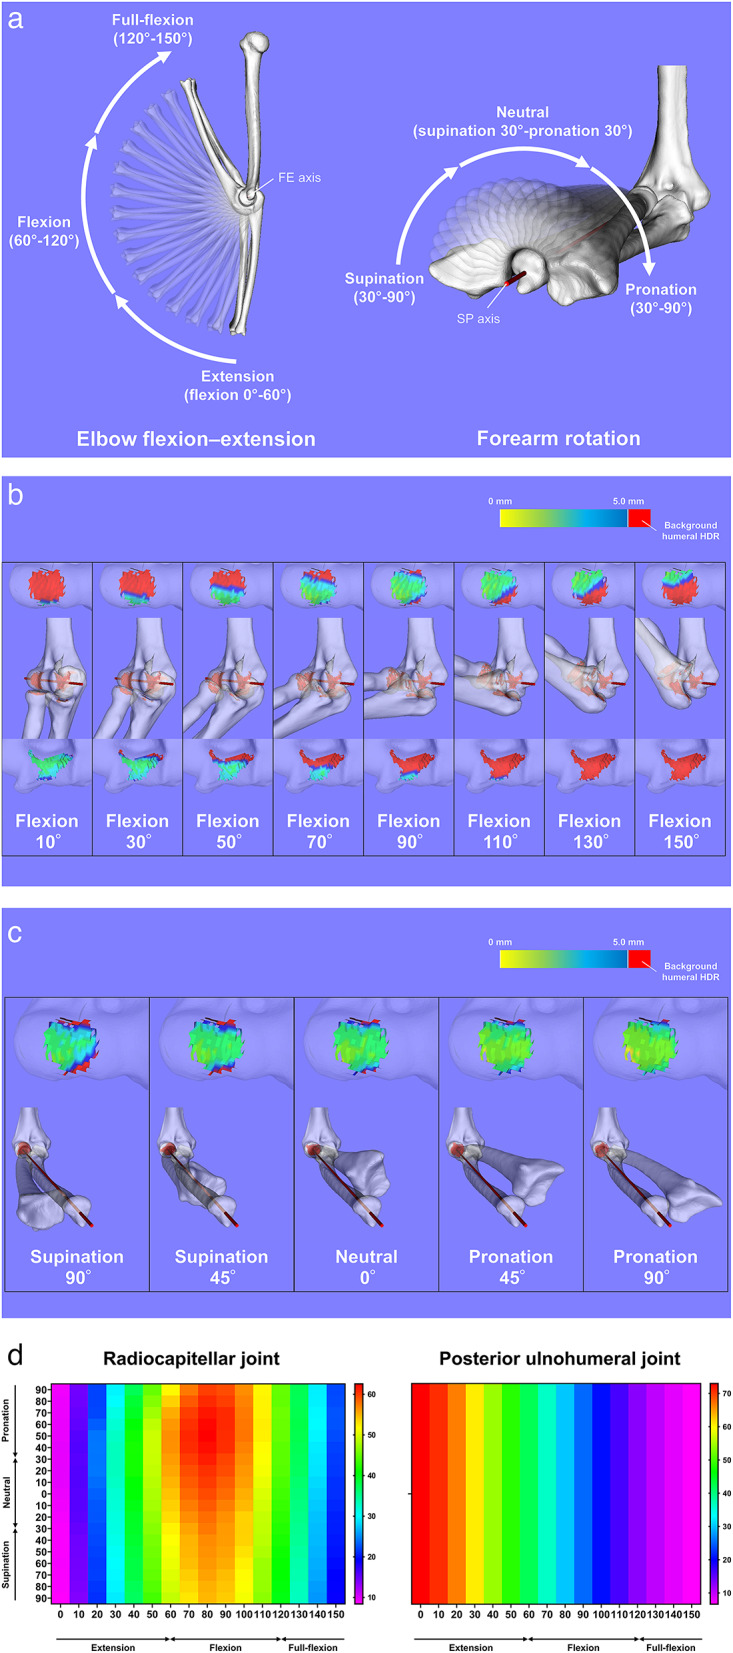
Motion analysis. (A) Elbow flexion–extension motion is reproduced by rotating the forearm bones around the FE axis, and forearm rotation motion is reproduced by rotating the radius around the SP axis. The flexion angles are categorized as extension (< 60° of flexion), flexion (≥ 60° and < 120° of flexion), and full flexion (≥ 120° of flexion), and the rotation angles are categorized as supination (≤ 90° and > 30° of supination), neutral (≤ 30° of supination and ≤ 30° of pronation), and pronation (> 30° and ≤ 90° of pronation). FE axis flexion–extension axis, SP supination–pronation. Proximity contours exhibiting the proximity area during (B) elbow flexion–extension and (C) forearm rotation motions. Contours are drawn onto the high-density regions of the capitellum or posterior humeral trochlea, with the background humeral areas depicted in red. (D) Heat maps for the proximity area for the motion analysis, illustrating the proximity areas at the radiocapitellar joint during elbow flexion–extension and forearm rotation motions (left), and at the posterior ulnohumeral joint during elbow flexion–extension motion (right).
We measured the inter-region distance using the proximity mapping method during flexion–extension and supination–pronation motions (Fig. 5B,C). Surface proximity mappings were depicted on the high-density region of the humerus, shown in red, by visualizing a colored contour map based on the distance with respect to the high-density region of the radial head or proximal ulna. The proximity area between the anterior region of the humerus and the radial region (i.e., radiocapitellar joint) was calculated at each measurement point of both the flexion–extension and supination–pronation motions. Similarly, the area between the posterior region of the humerus and the ulnar region (i.e., posterior ulnohumeral joint) was calculated at each point of the flexion–extension motion. The proximity area was represented by a proximity distance of < 5.0 mm, and the percentage relative to the entire surface area was used for the analysis. A threshold distance of 5.0 mm was determined considering the cartilage thickness of the elbow bones28. Heat maps were drawn for the radiocapitellar and posterior ulnohumeral joints according to the values obtained at each measurement point for comparisons among the categories (Fig. 5D). The measurements were averaged within categories for statistical analyses.
The validity of using the FE and SP axes was confirmed by analysing the variances from the rotation axes calculated from CT scans acquired in multiple positions (Supplementary Fig. 1) and subsequently comparing the results obtained using each axis (Supplementary Fig. 2). The variance of the FE axis ranged from 0.23 to 0.30 mm and from 0.33 to 0.43 mm at the lateral and medial epicondyles, respectively. Similarly, the variance of the SP axis ranged from 0.30 to 0.60 mm and 0.63 to 1.03 mm at the radial head and ulnar fovea, respectively (Supplementary Table 1). Consequently, this led to differences in the proximity area mentioned below of 0.0–2.2% in the radiocapitellar joint and 0.0–1.0% in the posterior ulnohumeral joint (Supplementary Table 2).
Statistical analyses
All statistical analyses were performed using Prism version 9 (GraphPad, San Diego, CA, USA) or JMP Pro version 17.0 (SAS Institute Inc., Cary, NC, USA). The level of significance was set at p < 0.05 for all tests. Data are presented as mean ± standard deviation unless otherwise stated.
The bone density values in different subregions of the distal humerus (capitellum vs. coronoid vs. olecranon) and radial head (radial-dorsal vs. ulnar-dorsal vs. radial-volar vs. ulnar-volar) were compared using one-way analysis of variance (ANOVA). Post-hoc pairwise comparisons were conducted using the Tukey or Games–Howell test, depending on the homogeneity test. Those of the proximal ulna (coronoid vs. olecranon) were compared using the Mann–Whitney U test.
Multivariate analyses were performed for all bone density values at the relevant individual points of interest for the samples. Principal component analysis with a correlation matrix routine and hierarchical clustering using Ward’s method were used to identify groups of points showing high bone density values. The bone density values of individual bones were compared between the HDR and LDR groups using the Mann–Whitney U test, adjusting for multiple comparisons with the Bonferroni correction.
The categorial values of the proximity area in the radiocapitellar joint were compared among the flexion–extension (extension vs. flexion vs. full flexion) and supination–pronation (supination vs. neutral vs. pronation) categories using two-way ANOVA followed by Tukey’s test. In contrast, the categorial values in the posterior ulnohumeral joint were compared among the flexion–extension (extension vs. flexion vs. full flexion) categories using one-way ANOVA followed by the Tukey or Games–Howell test according to the homogeneity test.
A priori power analyses (α = 0.05/3 = 0.0167, 1-β = 0.8, two-tailed) were conducted to detect a difference in the relative bone density value of 0.12 ± 0.08 for the distal humerus, as calculated from previous study findings34. A minimum sample size of 22 specimens was determined necessary to identify meaningful differences in subchondral bone measurements. This calculation was performed using G*Power (Universität Kiel, Kiel, Germany).
Results
Subchondral bone density distribution
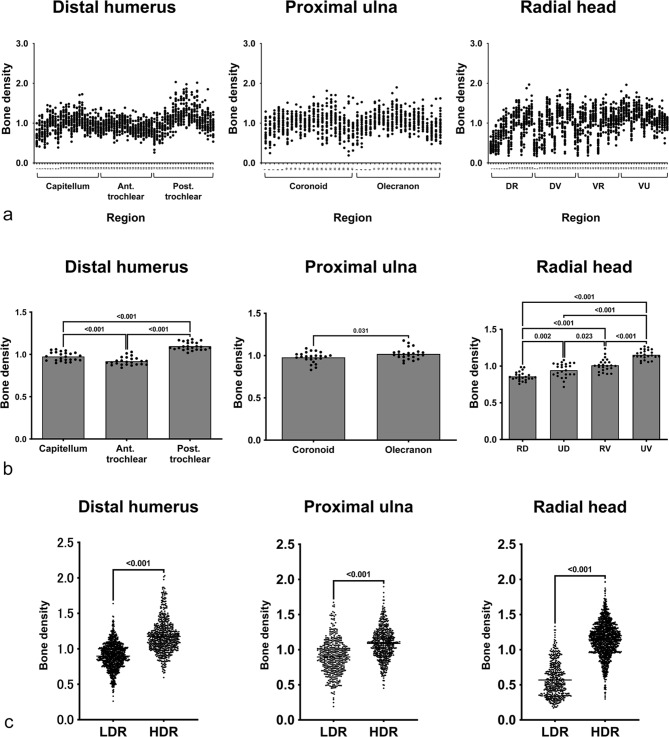
Regional differences in bone density were observed in individual bones (Fig. 3B). Distribution plots of all relevant individual points for samples were created based on anatomical categories, as depicted in Fig. 6A. Specifically, the relative bone density values of the posterior parts of the ulnohumeral joint (1.10 ± 0.05 for the posterior trochlear and 1.02 ± 0.07 for the olecranon) were significantly higher than those of the anterior parts (0.92 ± 0.05 for the anterior trochlear, p < 0.001; and 0.98 ± 0.06 for the coronoid, p = 0.031). Within the radiocapitellar joint, the bone density values of the capitellum were 0.97 ± 0.05, and the ulnar-volar region of the radial head (1.15 ± 0.07) displayed the most notable density among the quadrants (radial-dorsal, 0.86 ± 0.06; ulnar-dorsal, 0.94 ± 0.10; and radial-volar, 1.01 ± 0.09) (all p < 0.001; Fig. 6B).
Fig. 6.
(A) Distribution plots of subchondral bone density for the categorized subregions. (B) Comparison of the categorized subchondral bone densities among the subregions. (C) Comparison of subchondral bone density between the HDR and LDR. HDR high-density region, LDR low-density region.
The high-density regions were binarized and extracted, exhibiting distributions at the capitellum and posterior trochlea in the distal humerus, sagittal ridge in the proximal ulna and ulnar-volar side of the radial head (Fig. 4B,C). The relative bone density values were significantly higher in the HDR group than in the LDR group in the individual bones, including the distal humerus (1.17 ± 0.23 vs. 0.90 ± 0.18, p < 0.001), proximal ulna (1.09 ± 0.22 vs. 0.90 ± 0.25, p < 0.001), and radial head (1.15 ± 0.24 vs. 0.57 ± 0.24, p < 0.001) (Fig. 6C).
Motion analysis
Proximity contours showed that in the radiocapitellar joint, the high-density region of the capitellum proximated to that of the radial head at approximately 90° elbow flexion during flexion–extension motion and proximated most in the pronated forearm position during supination–pronation motion. They also demonstrated that the high-density region of the posterior humeral trochlea proximated to the high-density region in the posterior region of the ulnar trochlear notch in the fully extended elbow position during flexion–extension motion in the posterior part of the ulnohumeral joint (Fig. 5B,C).
The heatmaps generated from the measurements at each elbow position showed the most notable proximity at approximately 90° elbow flexion with a pronated forearm position in the radiocapitellar joint and at the fully extended elbow position in the posterior ulnohumeral joint (Fig. 5D).
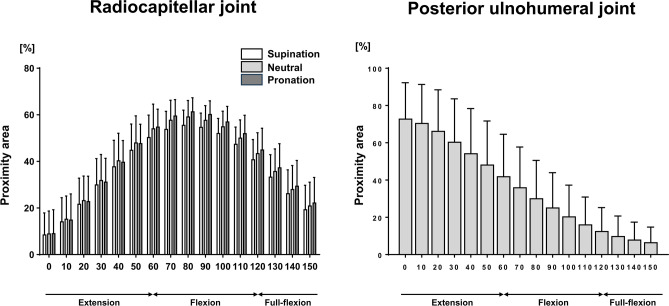
Table 1 summarizes the percentage of the proximity area during motions of elbow flexion–extension and forearm rotation in the radiocapitellar joint. No significant interaction effect (p = 0.867) was found between the two independent categorical variables (elbow flexion–extension and forearm rotation motions). The percentage of the proximity area in the flexion group was significantly higher than that in both the extension (p < 0.001) and full-flexion (p < 0.001) groups. Additionally, the percentage of proximity area in the pronation group was significantly higher than that in the supination group (p = 0.040). In the posterior ulnohumeral joint, the percentage of proximity area in the extension group (62.2% ± 21.1%) was significantly higher than that in the flexion (28.4% ± 18.5%, p < 0.001) and full-flexion (9.3% ± 9.9%, p < 0.001) groups (Fig. 7).
Table 1.
Percentage of the proximity area during motions of elbow flexion–extension and forearm rotation in the radiocapitellar joint [%].
| Supination | Neutral | Pronation | ||||||
|---|---|---|---|---|---|---|---|---|
| Extension | Flexion | Full flexion | Extension | Flexion | Full flexion | Extension | Flexion | Full flexion |
| 26.2 ± 9.7 | 52.5 ± 5.0 | 30.1 ± 9.5 | 28.1 ± 9.4 | 55.8 ± 5.7 | 32.2 ± 9.4 | 27.7 ± 9.0 | 57.6 ± 4.6 | 33.6 ± 10.0 |
Data are presented as mean ± standard deviation.
Fig. 7.
Bar charts for the motion analysis at the radiocapitellar joint during elbow flexion–extension and forearm rotation motions (left), and at the posterior ulnohumeral joint during elbow flexion–extension motion (right).
Discussion
This study evaluated the spatial distributions of subchondral bone density in the distal humerus, proximal ulna, and radial head and characterized their mutual relationships during elbow flexion–extension and forearm rotation motions using proximity mapping. High-density regions were distributed in the capitellum and posterior trochlea in the distal humerus, sagittal ridge in the proximal ulna and ulnar-volar side of the radial head. Furthermore, the radiocapitellar joint exhibited a high-density region of the capitellum that approximated that on the radial head at approximately 90° elbow flexion with a pronated forearm position, and the posterior ulnohumeral joint exhibited a high-density region of the posterior humeral trochlea that approximated the high-density region in the posterior region of the ulnar trochlear notch in the fully extended elbow position.
The subchondral bone functionally adapts to the mechanical stress acting on it5,6. Thus, by measuring bone density, it is possible to infer the local ‘loading history’ over an extended period35–37. However, the structural complexity of the elbow joint makes it difficult to evaluate the bone density distribution in three-dimensions. A key strength of this study lies in its data-driven approach with a clustering method, which enabled the extraction of high-density regions of the subchondral bone, thereby characterizing the spatial distribution of subchondral bone density in an individual bone. Nonetheless, merely elucidating the distribution of forces within each bone is insufficient for understanding elbow biomechanics. In the elbow joint, where three bones intricately interlock and enable a high degree of mobility1, it is crucial to consider the bones in pairs and consider their relative positions during joint movement. The second strength of this study is that it estimated loading conditions during elbow joint movement by evaluating the motion behaviour of these regions.
Considering each bone separately, the subchondral bone densities of the distal humerus were high in the capitellum and posterior trochlea. The capitellum articulates with the radial head, and this anatomical feature is important for transmitting forces proximally38,39. These findings are consistent with Wolff’s law40 and explain the high joint reactive forces experienced through radiocapitellar contact. In the radial head faced with the capitellum, we found the high-density regions at the ulnar-volar side opposite to the ‘safe zone’41. This is reasonable and consistent with the results of previous studies that have estimated high mechanical properties at this location42,43. Posteriorly, the subchondral bone density showed a predominant increase in the posterior part of the humeral trochlea and along the sagittal ridge in the posterior part of the proximal ulna. Although the ulnohumeral joint is conceptually simplified as a symmetrical trochoid joint with a uniform axis of rotation, it is interesting to observe an asymmetrical distribution pattern. Presumably, the loading condition at the ulnohumeral articulation primarily depends on the posterior humeral trochlear collision with the olecranon or the olecranon structurally constrained by the olecranon fossa rather than symmetrical trochoid motion.
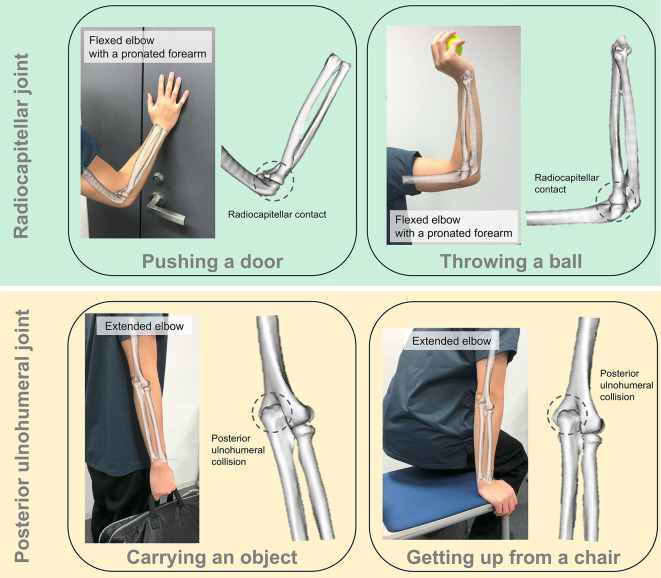
Taken together, the high-density distributions in individual bones and motion analyses evaluating their proximity revealed isolated pairs of subchondral regions with high bone density anteriorly and posteriorly during elbow motion. In the anterior part of the elbow joint, the radiocapitellar joint showed that the high-density region of the capitellum proximated the most to the high-density region of the radial head with approximately 90° elbow flexion with a pronated forearm position. In contrast, in the posterior part of the elbow, the ulnohumeral joint showed that the high-density region of the posterior humeral trochlea and the high-density region in the posterior region of the ulnar trochlear notch were closest in the fully extended elbow position and moved apart as the elbow flexed. We propose that the proximity peak at full extension reflects the stress caused by the collision, as described above, and is a reasonable change. These findings provide additional insights beyond previous studies that evaluated congruity based on contact areas7,8. While the congruity observed during forearm rotation is consistent with our results, identifying changes across the entire range of flexion and extension based solely on congruity is challenging. The current findings reveal that these changes can only be detected by examining the proximity of high-density bone regions resulting from load bearing. Collectively, activities of daily living, such as pushing a door and throwing a ball, frequently involve a flexed elbow with a pronated forearm position. However, activities such as lifting or carrying objects and getting up from a chair typically require the elbow to be fully extended. These movements are considered stress-prone activities (Fig. 8).
Fig. 8.
Illustrations depicting common activities of daily living. Pushing a door and throwing a ball often involve a flexed elbow with a pronated forearm position, utilizing radiocapitellar contact. On the other hand, lifting or carrying objects and getting up from a chair typically necessitate the elbow to be fully extended, utilizing posterior ulnohumeral contact. These movements are acknowledged as stress-prone activities.
In the context of translational medicine, these findings may be useful for preoperative and postoperative decision-making and rehabilitation strategies. If stress is likely to arise at a fracture or cartilage-wearing site, the patient can lower the threshold for surgical treatment. In such cases, physiotherapists and occupational therapists should avoid using loading positions with these patients. Similarly, an understanding of the loading conditions during elbow motion may help elucidate the pathophysiology of elbow disorders. The capitellum serves as a primary location for the onset of cartilage wear in OA, and repetitive radiocapitellar contact, frequently encountered in strenuous labour, can lead to alterations in the cartilage and subchondral conditions. Collisions in the posterior elbow joint may contribute to osteophyte formation as degeneration progresses. Conversely, throwing athletes frequently experience repetitive stress at the capitellum, and our findings support the notion that compressive forces acting on the relatively poorly vascularized capitellum are associated with the development of osteochondritis dissecans. We anticipate that future studies will provide additional insights into these areas of inquiry. Our findings are also clinically relevant to anatomical implant and prosthesis designs. Loading conditions during joint motion in implant designs can replicate normal human elbow movements, thereby restoring joint kinematics, maximizing the contact area with native articular surfaces, and potentially leading to improved postoperative outcomes20,21.
Our study has some limitations. First, we analysed data from a relatively small cohort. Although consistent results were observed in this study, its utility and findings are based on the characteristics of our cohort and not on the population as a whole. Further, variations between individuals might be more apparent in a larger study group. Second, the elbow motions were virtually reproduced based on static positions. Although CT scans were performed using a uniform protocol, the dynamic motion may vary among individual elbows. Dynamic scans would help to improve accuracy in the future.
Conclusion
The normal elbow joint shows that high-density regions of the subchondral bone are distributed at the capitellum and posterior trochlea in the distal humerus, sagittal ridge in the proximal ulna and ulnar-volar side of the radial head. Based on the motion analyses, the radiocapitellar joint shows that the high-density region of the capitellum proximates to that of the radial head in the flexed elbow with a pronated forearm, and the posterior ulnohumeral joint demonstrates that the high-density region of the posterior humeral trochlear proximates to the high-density region in the posterior region of the ulnar trochlear notch in the fully extended elbow, indicating that activities of daily living performed in these positions are stress-prone activities.
Supplementary Information
Author contributions
S. Miyamura: Conception and design of study, Acquisition of data, Analysis and/or interpretation of data, Drafting the manuscript, Approval of the version of the manuscript to be published. R. Shiode: Conception and design of study, Acquisition of data, Analysis and/or interpretation of data, Revising the manuscript critically for important intellectual content, Approval of the version of the manuscript to be published. T. Iwahashi: Analysis and/or interpretation of data, Revising the manuscript critically for important intellectual content, Approval of the version of the manuscript to be published. A. Kazui: Conception and design of study, Analysis and/or interpretation of data, Revising the manuscript critically for important intellectual content, Approval of the version of the manuscript to be published. N. Yamamoto: Conception and design of study, Analysis and/or interpretation of data, Revising the manuscript critically for important intellectual content, Approval of the version of the manuscript to be published. T. Miyake: Conception and design of study, Analysis and/or interpretation of data, Revising the manuscript critically for important intellectual content, Approval of the version of the manuscript to be published. S. Okada: Resources, Analysis and/or interpretation of data, Revising the manuscript critically for important intellectual content, Approval of the version of the manuscript to be published. T. Murase: Conception and design of study, Analysis and/or interpretation of data, Revising the manuscript critically for important intellectual content, Approval of the version of the manuscript to be published. K. Oka: Conception and design of study, Analysis and/or interpretation of data, Revising the manuscript critically for important intellectual content, Approval of the version of the manuscript to be published. H. Tanaka: Analysis and/or interpretation of data, Revising the manuscript critically for important intellectual content, Approval of the version of the manuscript to be published.
Funding
This study was supported in part by the Japan Society for the Promotion of Science (JSPS) KAKENHI (Grant Numbers JP21K16684 and JP22H03199).
Data availability
The datasets generated and/or analysed during the current study are available from the corresponding author upon reasonable request.
Declarations
Competing interests
The authors declare no competing interests.
Footnotes
Publisher’s note
Springer Nature remains neutral with regard to jurisdictional claims in published maps and institutional affiliations.
Supplementary Information
The online version contains supplementary material available at 10.1038/s41598-024-75647-z.
References
- 1.Morrey, B. F., Sotelo, J. S. & Morrey, M. E. Morrey’s the Elbow and Its Disorders (Elsevier, 2017). [Google Scholar]
- 2.Eckstein, F., Muller-Gerbl, M., Steinlechner, M., Kierse, R. & Putz, R. Subchondral bone density in the human elbow assessed by computed tomography osteoabsorptiometry: A reflection of the loading history of the joint surfaces. J. Orthop. Res. 13 (2), 268–278 (1995). [DOI] [PubMed] [Google Scholar]
- 3.Funakoshi, T. et al. Alteration of stress distribution patterns in symptomatic valgus instability of the elbow in baseball players: A computed tomography osteoabsorptiometry study. Am. J. Sports Med. 44 (4), 989–994 (2016). [DOI] [PubMed] [Google Scholar]
- 4.Momma, D. et al. Alterations in stress distribution patterns through the forearm joint surface of the elbow in baseball players assessed using computed tomography osteoabsorptiometry. J. Orthop. Sci. 17 (3), 253–260 (2012). [DOI] [PubMed] [Google Scholar]
- 5.Muller-Gerbl, M., Putz, R., Hodapp, N. H., Schulta, E. & Wimmer, B. Computed tomography-osteoaboorptiometry: A method of assessing the mechanical condition of the major joints in a living subject. Clin. Biomech. 5 (4), 193–198 (1990). [DOI] [PubMed] [Google Scholar]
- 6.Müller-Gerbl, M., Putz, R., Hodapp, N., Schulte, E. & Wimmer, B. Computed tomography-osteoabsorptiometry for assessing the density distribution of subchondral bone as a measure of long-term mechanical adaptation in individual joints. Skelet. Radiol. 18 (7), 507–512 (1989). [DOI] [PubMed] [Google Scholar]
- 7.Goto, A. et al. In vivo elbow biomechanical analysis during flexion: Three-dimensional motion analysis using magnetic resonance imaging. J. Should. Elbow Surg. 13 (4), 441–447 (2004). [DOI] [PubMed] [Google Scholar]
- 8.Omori, S. et al. In vivo three-dimensional elbow biomechanics during forearm rotation. J. Should. Elbow Surg. 25 (1), 112–119 (2016). [DOI] [PubMed] [Google Scholar]
- 9.Block, J. A. & Shakoor, N. Lower limb osteoarthritis: Biomechanical alterations and implications for therapy. Curr. Opin. Rheumatol. 22 (5), 544–550 (2010). [DOI] [PubMed] [Google Scholar]
- 10.Cox, L. G., van Rietbergen, B., van Donkelaar, C. C. & Ito, K. Bone structural changes in osteoarthritis as a result of mechanoregulated bone adaptation: a modeling approach. Osteoarthr. Cartil. 19 (6), 676–682 (2011). [DOI] [PubMed] [Google Scholar]
- 11.Felson, D. T. et al. Can anatomic alignment measured from a knee radiograph substitute for mechanical alignment from full limb films?. Osteoarthr. Cartil. 17 (11), 1448–1452 (2009). [DOI] [PMC free article] [PubMed] [Google Scholar]
- 12.Kellgren, J. H. & Lawrence, J. S. Radiological assessment of osteo-arthrosis. Ann. Rheum. Dis. 16 (4), 494–502 (1957). [DOI] [PMC free article] [PubMed] [Google Scholar]
- 13.Shamir, L. et al. Early detection of radiographic knee osteoarthritis using computer-aided analysis. Osteoarthr. Cartil. 17 (10), 1307–1312 (2009). [DOI] [PMC free article] [PubMed] [Google Scholar]
- 14.Sharma, L. et al. The role of knee alignment in disease progression and functional decline in knee osteoarthritis. JAMA 286 (2), 188–195 (2001). [DOI] [PubMed] [Google Scholar]
- 15.Speirs, A. D., Beaule, P. E., Rakhra, K. S., Schweitzer, M. E. & Frei, H. Increased acetabular subchondral bone density is associated with cam-type femoroacetabular impingement. Osteoarthr. Cartil. 21 (4), 551–558 (2013). [DOI] [PubMed] [Google Scholar]
- 16.Chanlalit, C., Shukla, D. R., Fitzsimmons, J. S., An, K. N. & O’Driscoll, S. W. Influence of prosthetic design on radiocapitellar concavity-compression stability. J. Should. Elbow Surg. 20 (6), 885–890 (2011). [DOI] [PubMed] [Google Scholar]
- 17.Chanlalit, C. et al. Radiocapitellar stability: The effect of soft tissue integrity on bipolar versus monopolar radial head prostheses. J. Should. Elbow Surg. 20 (2), 219–225 (2011). [DOI] [PubMed] [Google Scholar]
- 18.Moon, J. G., Berglund, L. J., Zachary, D., An, K. N. & O’Driscoll, S. W. Radiocapitellar joint stability with bipolar versus monopolar radial head prostheses. J. Should. Elbow Surg. 18 (5), 779–784 (2009). [DOI] [PubMed] [Google Scholar]
- 19.Shukla, D. R., Fitzsimmons, J. S., An, K. N. & O’Driscoll, S. W. Effect of radial head malunion on radiocapitellar stability. J. Should. Elbow Surg. 21 (6), 789–794 (2012). [DOI] [PubMed] [Google Scholar]
- 20.Yeung, C. et al. Regional variations in cartilage thickness of the radial head: Implications for prosthesis design. J. Hand Surg. 40 (12), 2364–2371 (2015). [DOI] [PubMed] [Google Scholar]
- 21.Zhang, Q. et al. Distinct proximal humeral geometry in chinese population and clinical relevance. J. Bone Jt. Surg. 98 (24), 2071–2081 (2016). [DOI] [PubMed] [Google Scholar]
- 22.Oka, K. et al. Accuracy analysis of three-dimensional bone surface models of the forearm constructed from multidetector computed tomography data. Int. J. Med. Robot. Comput. Assist. Surg. 5 (4), 452–457 (2009). [DOI] [PubMed] [Google Scholar]
- 23.Pham, D. L., Xu, C. & Prince, J. L. Current methods in medical image segmentation. Annu. Rev. Biomed. Eng. 2, 315–337 (2000). [DOI] [PubMed] [Google Scholar]
- 24.Kawanishi, Y. et al. Does cubitus varus cause morphologic and alignment changes in the elbow joint?. J. Should. Elbow Surg. 22 (7), 915–923 (2013). [DOI] [PubMed] [Google Scholar]
- 25.Hagert, C. G. The distal radioulnar joint in relation to the whole forearm. Clin. Orthop. Relat. Res. 275, 56–64 (1992). [PubMed] [Google Scholar]
- 26.Hollister, A. M., Gellman, H. & Waters, R. L. The relationship of the interosseous membrane to the axis of rotation of the forearm. Clin. Orthop. Relat. Res. 298, 272–276 (1994). [PubMed] [Google Scholar]
- 27.Miyamura, S., Lans, J., Shimada, K., Murase, T. & Chen, N. C. A quantitative analysis of subchondral bone density around osteochondritis dissecans lesions of the capitellum. J. Hand Surg. 47 (8), e1–e11 (2022). [DOI] [PubMed] [Google Scholar]
- 28.Miyamura, S. et al. Regional distribution of articular cartilage thickness in the elbow joint: A 3-dimensional study in elderly humans. JB JS Open Access 4 (3), 1–11 (2019). [DOI] [PMC free article] [PubMed] [Google Scholar]
- 29.Dunmore, C. J., Kivell, T. L., Bardo, A. & Skinner, M. M. Metacarpal trabecular bone varies with distinct hand-positions used in hominid locomotion. J. Anat. 235 (1), 45–66 (2019). [DOI] [PMC free article] [PubMed] [Google Scholar]
- 30.Dunmore, C. J. et al. The position of Australopithecus sediba within fossil hominin hand use diversity. Nat. Ecol. Evol. 4 (7), 911–918 (2020). [DOI] [PubMed] [Google Scholar]
- 31.Miyamura, S. et al. Bone density measurements from CT scans may predict the healing capacity of scaphoid waist fractures. Bone Jt. J. 102 (9), 1200–1209 (2020). [DOI] [PubMed] [Google Scholar]
- 32.Miyamura, S. et al. Quantitative 3-D CT demonstrates distal row pronation and translation and radiolunate arthritis in the SNAC wrist. J. Bone Jt. Surg. 105 (17), 1329–1337 (2023). [DOI] [PubMed] [Google Scholar]
- 33.Miyamura, S., Lans, J., Murase, T., Oka, K. & Chen, N. C. Degenerative changes in the elbow joint after radial head excision for fracture: quantitative 3-dimensional analysis of bone density, stress distribution, and bone morphology. J. Should. Elbow Surg. 30 (5), e199–e211 (2021). [DOI] [PubMed] [Google Scholar]
- 34.Miyamura, S. et al. Altered bone density and stress distribution patterns in long-standing cubitus varus deformity and their effect during early osteoarthritis of the elbow. Osteoarthr. Cartil. 26 (1), 72–83 (2018). [DOI] [PubMed] [Google Scholar]
- 35.Carter, D. R. Mechanical loading histories and cortical bone remodeling. Calcif. Tissue Int. 36 (1), S19–S24 (1984). [DOI] [PubMed] [Google Scholar]
- 36.Carter, D. R. Mechanical loading history and skeletal biology. J. Biomech. 20 (11–12), 1095–1109 (1987). [DOI] [PubMed] [Google Scholar]
- 37.Carter, D. R., Orr, T. E. & Fyhrie, D. P. Relationships between loading history and femoral cancellous bone architecture. J. Biomech. 22 (3), 231–244 (1989). [DOI] [PubMed] [Google Scholar]
- 38.Walker, P. S. Human Joints and Their Artificial Replacements (Thomas, 1977). [Google Scholar]
- 39.Halls, A. A. & Travill, A. Transmission of pressures across the elbow joint. Anat. Rec. 150, 243–247 (1964). [DOI] [PubMed] [Google Scholar]
- 40.Wolff, J. The classic: on the inner architecture of bones and its importance for bone growth. Clin. Orthop. Relat. Res. 468 (4), 1056–1065 (2010). [DOI] [PMC free article] [PubMed] [Google Scholar]
- 41.Caputo, A. E., Mazzocca, A. D. & Santoro, V. M. The nonarticulating portion of the radial head: Anatomic and clinical correlations for internal fixation. J. Hand Surg. 23 (6), 1082–1090 (1998). [DOI] [PubMed] [Google Scholar]
- 42.Haverstock, J. P. et al. Regional variations in radial head bone volume and density: Implications for fracture patterns and fixation. J. Should. Elbow Surg. 21 (12), 1669–1673 (2012). [DOI] [PubMed] [Google Scholar]
- 43.Gordon, K. D., Duck, T. R., King, G. J. & Johnson, J. A. Mechanical properties of subchondral cancellous bone of the radial head. J. Orthop. Trauma 17 (4), 285–289 (2003). [DOI] [PubMed] [Google Scholar]
Associated Data
This section collects any data citations, data availability statements, or supplementary materials included in this article.
Supplementary Materials
Data Availability Statement
The datasets generated and/or analysed during the current study are available from the corresponding author upon reasonable request.


