Abstract
Background
Cuproptosis is a newly identified form of cell death that is dependent on copper (Cu) ions, termed Cu-dependent cytotoxicity. This process is distinct from other forms of cell death such as apoptosis, necrosis, and ferroptosis. The accumulation of copper is known to play a significant role in various biological processes, including angiogenesis (the formation of new blood vessels) and metastasis (the spread of cancer cells to different parts of the body). These processes are crucial for tumor growth and progression, indicating that copper and the cuproptosis-related genes (CPRGs) might be indispensable in the context of cancer development and progression. Given this background, we aimed to explore the relationship between CPRGs and both prognostic predictions and tumor microenvironment (TME) infiltration in bladder cancer (BLCA).
Methods
For this study, we utilized data from The Cancer Genome Atlas (TCGA) to identify CPRGs and subsequently divided BLCA patients into three distinct molecular clusters based on these genes. To assess the proportions of various immune cell types within the TME, we employed single-sample gene set enrichment analysis (ssGSEA) and the Cell-type Identification by Estimating Relative Subsets of RNA Transcripts (CIBERSORT) method. These computational techniques allowed us to quantify the infiltration of different immune cells, providing insights into the immune landscape of the tumors. Furthermore, we developed a risk score model using CPRGs to predict the survival prospects of BLCA patients.
Results
Our analysis identified three molecular clusters of BLCA patients, each exhibiting unique clinical features and patterns of TME infiltration. Among these clusters, cluster 1 was associated with a poor prognosis. Interestingly, this cluster also showed significant infiltration of activated CD4+ (ssGSEA P<0.001) and CD8+ T (ssGSEA P<0.05) cells, which are crucial components of the immune response against tumors. This finding suggests a complex interaction between the immune system and the tumor, where a high presence of T cells does not necessarily correlate with better outcomes. Additionally, our risk score model revealed that the high-risk group, characterized by a specific expression pattern of CPRGs, also had enhanced infiltration of CD4+ and CD8+ T cells. This indicates that the cuproptosis-based risk model has a robust ability to predict patient prognosis and can guide immunotherapy decisions.
Conclusions
Our study sheds light on the biological functions of CPRGs within the TME of BLCA and their correlations with clinical parameters and patient prognosis. The identification of distinct molecular clusters with varying prognoses and immune cell infiltrations highlights the heterogeneity of BLCA and underscores the potential of CPRGs as biomarkers for prognosis and therapeutic targets. These findings offer new perspectives for the development of immunotherapeutic strategies in the treatment of BLCA patients, potentially leading to more personalized and effective cancer therapies.
Keywords: Bladder carcinoma, cuproptosis, tumor microenvironment (TME), immunotherapy, prognosis
Highlight box.
Key findings
• Identification of three molecular clusters: bladder cancer (BLCA) patients were categorized into three distinct molecular clusters based on cuproptosis-related genes (CPRGs). These clusters exhibited different clinical features and patterns of tumor microenvironment (TME) infiltration.
• Prognostic and therapeutic implications: the study highlighted that the cuproptosis-based risk model effectively predicts patient prognosis and could guide immunotherapy decisions. The findings emphasize the role of CPRGs in the TME and their potential as biomarkers for prognosis and therapeutic targets in BLCA.
What is known and what is new?
• Cuproptosis is a novel form of cell death dependent on copper (Cu) ions.
• CPRGs might play a significant role in cancer development. The study categorizes BLCA patients into three distinct molecular clusters based on CPRGs.
What is the implication, and what should change now?
• The correlation between high-risk scores, poor prognosis, and increased CD4+ and CD8+ T cell infiltration indicates that CPRGs could be potent biomarkers for predicting patient outcomes and guiding immunotherapy.
• CPRGs should be integrated into the diagnostic and prognostic evaluation of BLCA patients. Routine screening for these genes can help to identify patients with higher risks and tailor treatment plans accordingly.
Introduction
Bladder carcinoma (BLCA) is one of the most common malignancies, of which the lifetime risk reaches approximately 1.1% for males and 0.27% for females (1). There are around 549,000 new BLCA cases and over 200,000 deaths from this disease every year (2). The pathophysiology and molecular biology of BLCA have not yet been fully elucidated. BLCA can be classified as high- or low-grade based on its histopathological features. According to the depth of bladder wall invasion, BLCA can be classified as non-muscle-invasive bladder cancer (NMIBC) and muscle-invasive bladder cancer (MIBC), with different treatments respectively (3). It is evident that there are genetic alterations underlying different phenotypes of BLCA. For example, some common mutations have been identified in low-grade NMIBC (such as FGFR3 and PIK3CA) or high-grade MIBC (e.g., ERBB2 and TP53) (4). Currently, intravesical therapy, such as Bacille Calmette-Guérin (BCG), remains the major therapy for BLCA, whereas the therapeutic options have been expanded to cytotoxic chemotherapy, immunotherapy, targeted therapies, and antibody–drug conjugates (5).
As an important intracellular mineral nutrient, copper (Cu) plays a role in several essential cellular process, including mitochondrial respiration, oxygen metabolism, iron uptake, as well as regulation of some biological pathways (6,7). In the past few years, connections between Cu and disease status have been observed, for example, a higher level of Cu has been found in various malignant tumors. It has been reported that BLCA patients demonstrated significantly higher levels of serum Cu compared with controls (8). Moreover, concentration of Cu in BLCA was significantly correlated with expression of vascular endothelial growth factor (VEGF) and hypoxia-inducible factor 1 (HIF-1) (9). Accumulation of Cu is associated with the process of angiogenesis, and metastasis (10). Recently, Tsvetkov et al. revealed a novel mechanism termed cuproptosis, by which excessive intracellular Cu concentrations lead to cell death (11). They observed the essential link between mitochondrial respiration and Cu-induced cell death, which provided a potential direction for possible combination of therapeutic interventions. Therefore, the exploration of cuproptosis-related genes (CPRGs) has the potential value of predicting therapeutic effects and targets.
As an immunogenic cancer, BLCA can be characterized by high tumor mutation burden (TMB). Although immune checkpoint blockade (ICB) has been a revolution for cancer treatment, only a limited number of patients benefit from it (12). The tumor microenvironment (TME), a complex mixture composed of cellular components (fibroblasts, immune cells, etc.) and non-cellular components (extracellular matrix, physicochemical factors, etc.), plays a critical role in initiation, progression, and treatment resistance of BLCA (13,14). The TME could lead to limited reinvigoration of antitumor immunity by imposing metabolic stress on immune cell infiltration (15). Therefore, characteristics of the TME may impact patients’ responses to therapy, and tumor cells could also influence TME by autocrine or paracrine effects (16,17). Recently, Damrauer et al. identified a novel expression signature of an inflamed TME in BLCA, which was associated with improved recurrence-free survival after BCG. They also reported an association between expression of immune checkpoint genes and an inflamed TME (18). To date, the relationship between TME cells infiltration and cuproptosis has been rarely reported in BLCA. It is critical to investigate the function and mechanism of the TME, cuproptosis, and their interactions in the pathogenesis and prognosis of BLCA for better cancer progression management and novel drug development.
In this study, we analyzed The Cancer Genome Atlas (TCGA)-BLCA, GSE13507 and GSE32894 datasets to determine the relationship between cuproptosis patterns and TME cell-infiltrating characteristics in BLCA. We identified three cuproptosis-related phenotypes in BLCA. Then, we established a scoring system to predict patients’ clinical outcomes and TME characteristics. Our findings may provide new ideas for applying different therapeutic treatments towards different BLCA cuproptosis-related phenotypes. We present this article in accordance with the TRIPOD reporting checklist (available at https://tau.amegroups.com/article/view/10.21037/tau-24-456/rc).
Methods
RNA expression datasets
TCGA-BLCA cohort was downloaded in a form of transformed RSEM normalized count from the UCSC Xena Browser (https://xenabrowser.net/datapages/). Somatic mutation data were downloaded from Genomic Data Commons Data Portal (https://portal.gdc.cancer.gov/). GSE13507 and GSE32894 datasets were curated from Gene Expression Omnibus (GEO; https://www.ncbi.nlm.nih.gov/geo/). The study was conducted in accordance with the Declaration of Helsinki (as revised in 2013).
Cuproptosis-related genes (CPRGs) panel
A total of ten genes associated with cuproptosis (CDKN2A, DLD, DLAT, MTF1, LIAS, PDHA1, GLS, FDX1, LIPT1, PDHB) were extracted from a former investigation (11). The details regarding these CPRGs are provided in Table S1.
Consensus molecular clustering
Consensus clustering based on the non-negative matrix factorization (NMF) was conducted using Consensus Cluster Plus tool from Bioconductor (https://bioconductor.org/packages/release/bioc/html/ConsensusClusterPlus.html) to delineate subgroups among BLCA patients, utilizing the expression profiles of CPRGs. The characteristics of these patient clusters are outlined in table available at: https://cdn.amegroups.cn/static/public/tau-24-456-1.xls.
Immune analysis
We utilized the Cell-type Identification by Estimating Relative Subsets of RNA Transcripts (CIBERSORT) deconvolution method to assess the relative abundance of 22 tumor-infiltrating immune cells (TIICs). Subsequently, gene signatures specific to immune cells, as per Charoentong’s research (19), were employed to compute immune infiltration-related scores via single-sample gene set enrichment analysis (ssGSEA).
Somatic mutation analyses
Somatic mutation provided by VarScan file format was downloaded from Genomic Data Commons Data Portal. Copy number alteration files were curated from UCSC Xena online (https://xena.ucsc.edu/).
Construction of cuproptosis-related prognostic risk score
To predict individual patient prognosis, we computed a risk score. Initially, we intersected the differentially expressed genes (DEGs) from each cluster identified by the ‘NMF’ function. Incorporating the ten CPRGs, we conducted univariate Cox regression analysis to identify genes associated with overall survival (OS) by “survival” package survivalFunc. Subsequently, we performed 1,000 iterations and included five gene groups for further screening, following previous protocols (20). Among these, a gene model comprising 14 genes exhibited the highest frequency of occurrence, totaling 396 compared to other 4-gene models. Finally, these 14 genes constituted the gene signature used to compute the risk score, which was determined as follows:
| [1] |
The patients across various cohorts were categorized into high- and low-risk groups by utilizing the median value of the risk score as the threshold. Subsequently, receiver operating characteristic (ROC) and Kaplan-Meier (KM) survival curves by “survivalROC” and “survival” package were constructed based on these risk groups by “glmnet” package. The coefficients of 14 genes are presented in Table S2. The heatmaps were generated by “pheatmap” package.
Statistical analyses
In this study, statistical analysis was conducted using R (version 4.2.3; R Foundation for Statistical Computing, Vienna, Austria) and GraphPad Prism (version 5; GraphPad Software, San Diego, CA, USA). The Wilcoxon test, log-rank test, and Kruskal-Wallis H test were employed. Specific details regarding the statistical tests are provided in the figure legends.
Results
Widespread genetic variation of CPRGs in BLCA
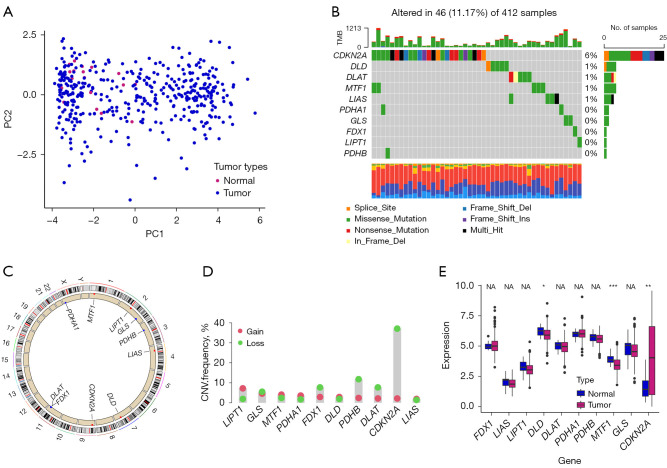
We derived 10 CPRGs from a previous study (11). Some of the TCGA-BLCA samples had the distinctive expression of ten CPRGs from normal samples (Figure 1A). Somatic mutations of CPRGs were detected in 46 of 412 tumor samples in TCGA dataset (Figure 1B). Analyses of copy number variations (CNV) and expression profiling of CPRGs in BLCA are shown in Figure 1C-1E. This part introduced the heterogeneity of ten CGRs in BLCA.
Figure 1.
Widespread genetic variation of CPRGs in BLCA. (A) PCA analysis of normal and tumor samples. (B) Types of genetic alterations in 10 CPRGs. (C) Location of 10 CPRGs on chromosomes. (D) CNV frequency of 10 CPRGs in TCGA-BLCA samples. (E) The boxplot shows expression of 10 CPRGs between normal and tumor tissues. *, P<0.05; **, P<0.01; ***, P<0.001. NA, not applicable; CPRGs, cuproptosis-related genes; BLCA, bladder cancer; PCA, principal component analysis; CNV, copy number variation; TCGA, The Cancer Genome Atlas.
To investigate correlation between CPRGs and clinical prognosis, we combined univariate Cox regression model and KM survival analyses (Figure S1).
Cuproptosis-related subtypes in BLCA
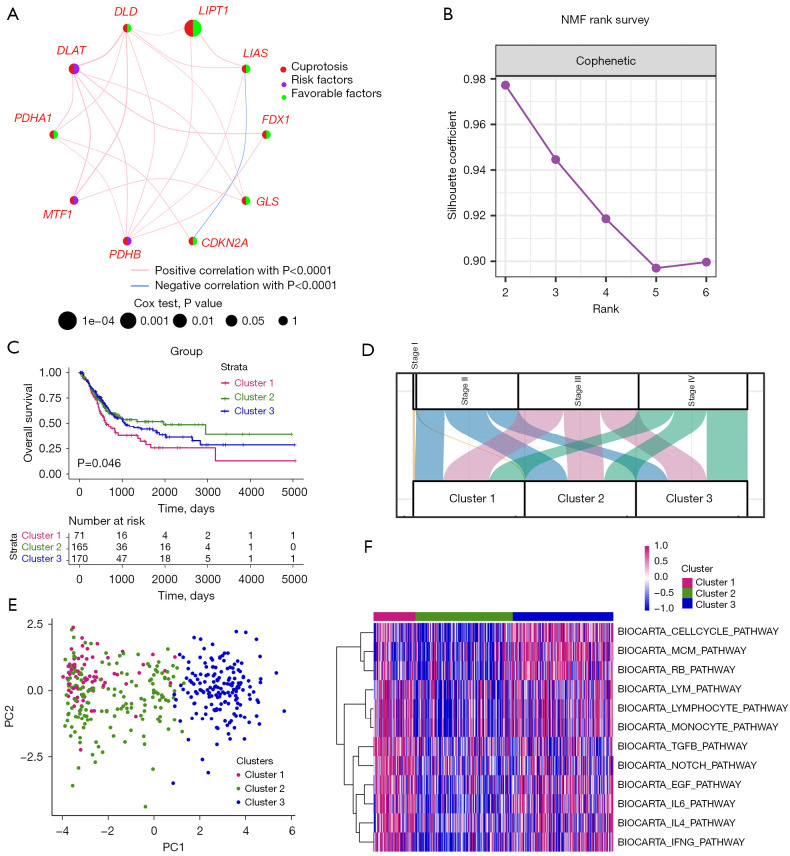
In Figure 2A, a network was utilized to exhibit correlation and prognostic values of CPRGs. To understand expression profiling patterns mediated by cuproptosis in BLCA, we next stratified 406 tumor tissues from TCGA-BLCA cohort into 3 clusters based on gene expression of CPRGs (Figure 2B). There were 71 samples in cluster 1, 165 samples in cluster 2 and 170 samples in cluster 3, among which cluster 1 displayed the worst prognosis (Figure 2C; P<0.05) with 32.39% of patients in stage IV (Figure 2D). The three clusters could be discriminated by PCA (Figure 2E). Pathways analysis showed that cell cycle-related, TGF-β, and immune-related pathways were mainly upregulated in cluster 1, suggesting there were distinct discrepancies of biological function among cuproptosis-related clusters, especially at the angle of immune infiltration (Figure 2F and Figure S2).
Figure 2.
Cuproptosis-related subtypes in BLCA. (A) A network describes the connection and prognostic values of 10 CPRGs. (B) NMF rank survey was shown. The optimal number of clusters: rank =3. (C) KM survival curves according to NMF clusters. P value was determined by the log-rank test. (D) The distribution plot shows the composition of clinicopathological features of three NMF clusters. (E) PCA shows the distribution of 3 NMF clusters. (F) Corresponding pathway activities of three NMF clusters. NMF, non-negative matrix factorization; BLCA, bladder cancer; CPRGs, cuproptosis-related genes; KM, Kaplan-Meier; PCA, principal component analysis.
Immune analysis of in cuproptosis-related clusters
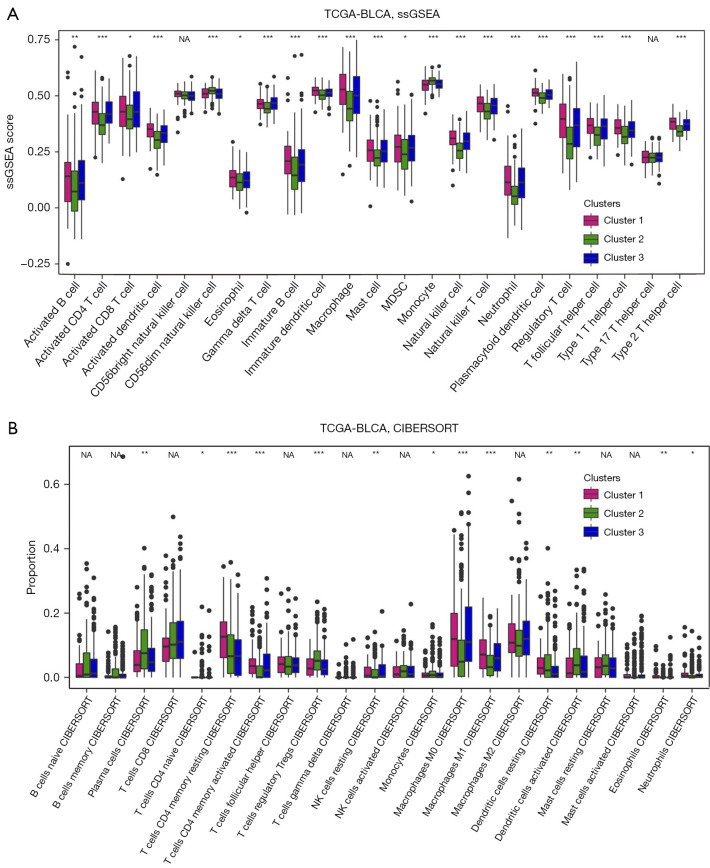
To understand in-depth characteristics of immune infiltration among three clusters, we employed ssGSEA (21) and CIBERSORT (22) analyses and found immune-activated cells such as activated CD4/8+ T (from results of ssGSEA, Figure 3A; from results of CIBERSORT, Figure 3B) were predominantly enriched in cluster 1. Considering that patients in cluster 1 exhibited the worst prognosis, immune therapy related to activated CD4/8+ T cells might be a good candidate treatment for BLCA patients in cluster 1.
Figure 3.
Immune analysis of cuproptosis-related clusters. (A)The ssGSEA was employed to analyze immune cell profiles across 3 clusters. Statistical comparisons among the three clusters were conducted using the Kruskal-Wallis H test. (B) The proportion of immune cells, determined through CIBERSORT analysis, is depicted in boxplots across the 3 clusters. Statistical differences among the clusters were evaluated using the Kruskal-Wallis H test. *, P<0.05, **, P<0.01, and ***, P<0.001 indicate significance. TCGA, The Cancer Genome Atlas; BLCA, bladder cancer; ssGSEA, single-sample gene set enrichment analysis; CIBERSORT, Cell-type Identification by Estimating Relative Subsets of RNA Transcripts; NA, not available; MDSC, myeloid-derived suppressor cell; NK, nature killer.
Construction of risk score model based on cuproptosis
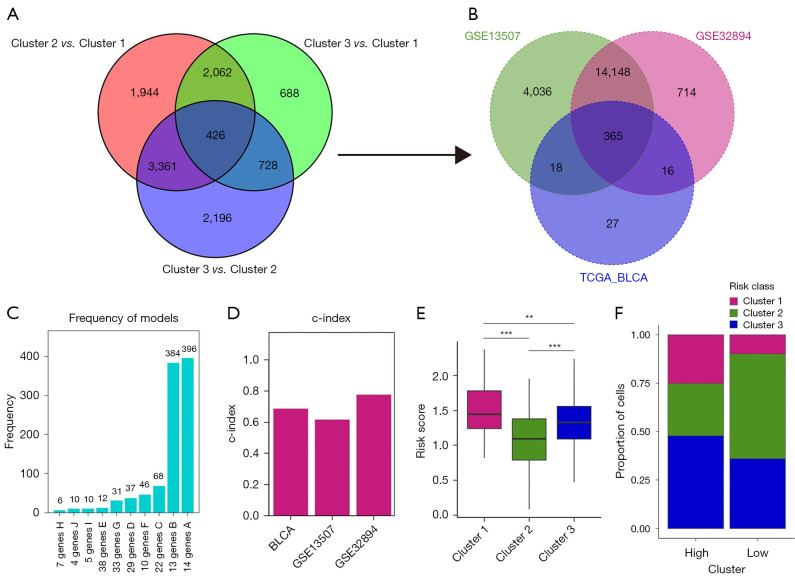
As previously reported, cuproptosis is cell death dependent on mitochondrial respiration. To investigate cuproptosis-related biological function underlying our transcriptomic classifications, we overlapped DEGs of three clusters and obtained in total of 426 genes (Figure 4A). Afterwards, Gene Ontology (GO) function analysis indicated that these genes were indeed associated with mitochondrial biological function such as mitochondrial respiratory chain complex assembly (Figure S3).
Figure 4.
Construction of risk_score model based on cuproptosis. (A) The Venn diagram illustrates the DEGs identified as cuproptosis phenotype-related genes. (B) Venn diagram displays the common genes among GSE13507, GSE32894, and 436 DEGs identified in the TCGA BLCA cohort. (C) Frequency models were utilized to compute gene models. (D) Bar chart presents the C-index of three datasets. (E) Box plot depicts the distribution of risk scores among 3 clusters. (F) The distribution of three clusters within the high- and low-risk groups is illustrated. **, P<0.01; ***, P<0.001. TCGA, The Cancer Genome Atlas; BLCA, bladder cancer; DEGs, differentially expressed genes; C-index, concordance index.
The above analyses mainly reflected molecular characteristics of cuproptosis-related clusters in BLCA. To further understand the prognostic prediction of CPRGs, we next combined 426 genes and ten CPRGs to generate a risk_model, recognized as CPRG_score. Here, we included three datasets (TCGA-BLCA cohort as training set, GSE13507 as validation cohort, and GSE32894 as an external cohort) for calculating the risk score. We observed that 365 of the above 1,345 genes could be detected in all three sets (Figure 4B). Therefore, a total of 436 genes (including 10 CPRGs) were finally used for construction of CPRG_score. After 1,000 iteration as previously described (23), we chose a group of 14 genes with the highest frequency (396 times) as the candidates to calculate the CPRG_score (Figure 4C). The accuracy for predictive ability in patients’ survival by the CPRG_score was presented by concordance index (C-index). Here, all three cohorts had the high value of C-index (0.6874 in TCGA-BLCA cohort; 0.6170 in GSE13507 cohort, and 0.7769 in GSE32894; Figure 4D). Quantification analysis of CPRG_score (Figure 4E) in three clusters was in line with the results of proportion analysis (Figure 4F), which showed that CPRG_score was mainly upregulated in cluster 1. These analyses implied that high CPRG_score could predict a worse prognosis in BLCA patients.
Predictive capacity of CPRG_score in patient prognosis
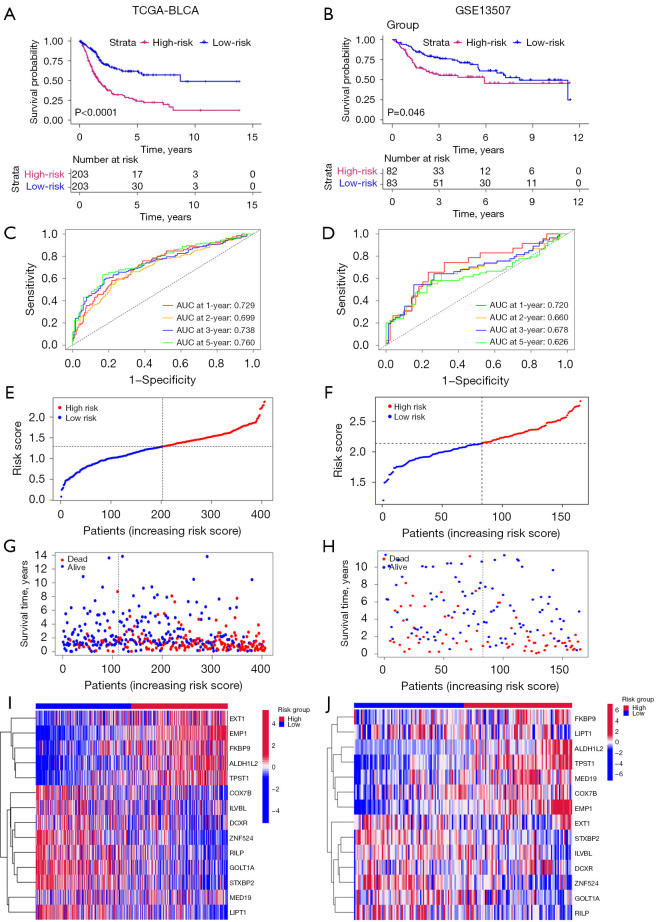
Based on CPRG_score, we explored patients’ survival rates by dividing patients into high- and low-risk groups using the median value of CPRG_score. We observed that the high-risk group predicted a worse survival rate (Figure 5A,5B; Figure S4A). Next, we calculated the area under the curve (AUC) values of survival rates in three cohorts. The results showed that AUC values at 1-, 2-, 3-, and 5-year were all beyond 0.6 in the training set (Figure 5C), validation set (Figure 5D), and the external cohort (Figure S4B). Increasing risk_score was parallel with the increasing death rates (Figure 5E-5H; Figure S4C,S4D). The expression of 14 genes in low- and high-groups were shown by heatmap (Figure 5I,5J; Figure S4E). These results indicated the good ability of CPRG_score to predict prognosis of BLCA patients.
Figure 5.
Predictive capacity of CPRG_score in patients’ prognosis. (A,B) Kaplan-Meier survival curves were plotted, with P values determined using the log-rank test. (C,D) ROC curves were generated to visualize the AUC values of risk scores. (E,F) Distribution plots depict the distribution of risk scores. (G,H) Distribution plots illustrate the correlation between risk scores and patients’ survival status. (I,J) Heatmap plots display the expression levels of 36 genes in high- and low-risk groups. TCGA, The Cancer Genome Atlas; BLCA, bladder cancer; AUC, area under the curve; ROC, receiver operating characteristic.
Immune characteristics between the high- and low-risk groups
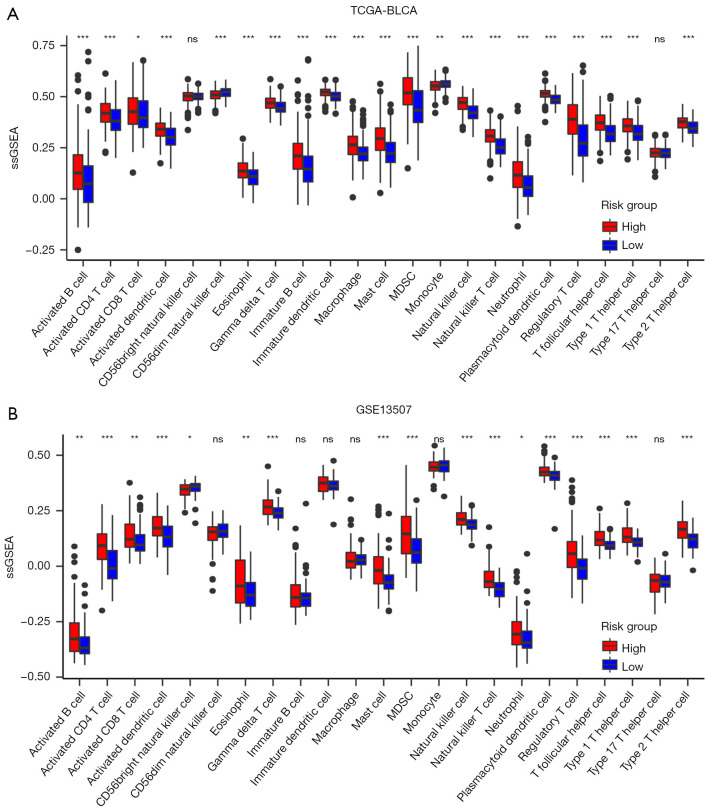
Since CPRG_score exhibited an advantage in predicting patients’ survival rates, we next wanted to understand the immune infiltration patterns of high- and low-risk groups. By using ssGSEA analyses in TCGA (Figure 6A) and GSE13507 (Figure 6B), we observed that activated CD4/8+ T cells were upregulated in high-risk group, consistent with the results in cluster 1, which also had a worse survival rate. Therefore, these results further indicated the advantageous intervention for anti-cancer treatment based on these immune-activated cells, especially for patients in the high CPRG_score group and CPRG cluster 1.
Figure 6.
Immune characteristics between the high- and low-risk groups. (A) The ssGSEA was conducted on TCGA-BLCA data to assess the profiles of immune cells within high- and low-risk groups. Statistical disparities among the clusters were evaluated using the Kruskal-Wallis H test. (B) The ssGSEA was also performed using GSE13507 data to examine immune cell profiles within high- and low-risk groups. The Kruskal-Wallis H test was utilized to compare statistical differences among the clusters, with significance indicated as *, P<0.05, **, P<0.01, and ***, P<0.001. ssGSEA, single-sample gene set enrichment analysis; TCGA, The Cancer Genome Atlas; BLCA, bladder cancer; MDSC, myeloid-derived suppressor cell; ns, not significant.
Construction of a nomogram
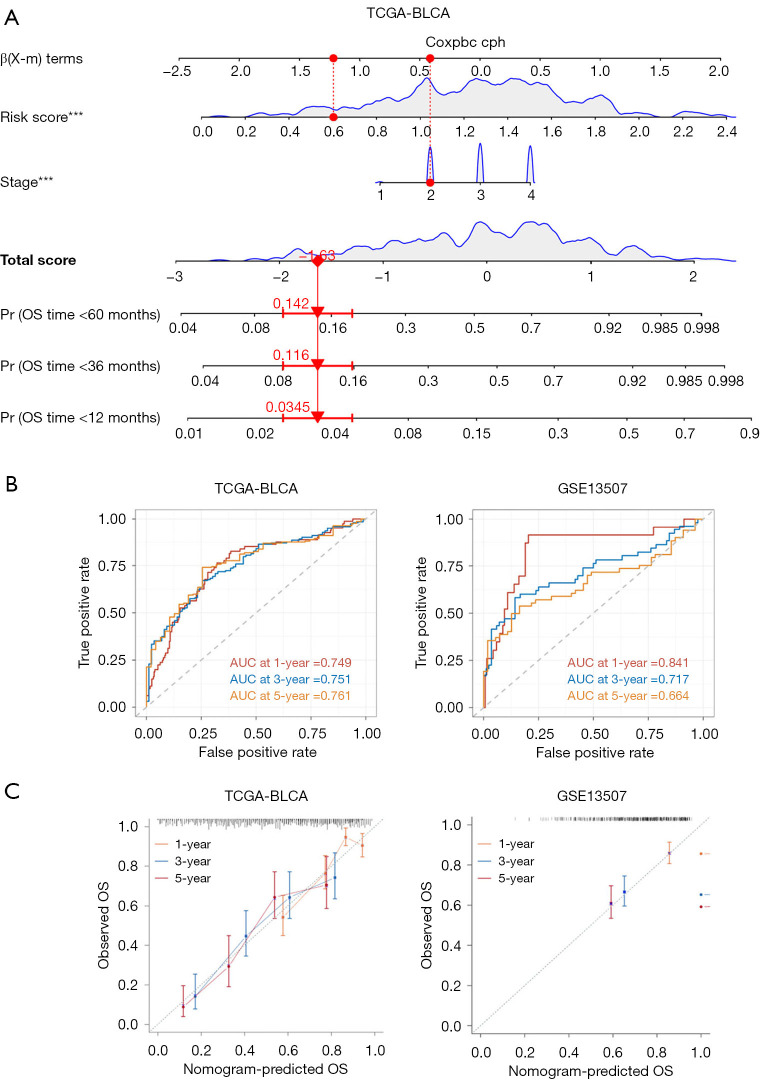
By incorporating CPRG_score and disease stages, we finally developed a nomogram to predict OS of BLCA patients (Figure 7A). We observed that, in the training set (TCGA-BLCA), AUC values at 1, 3, and 5 years were 0.749, 0.751, and 0.761, respectively (Figure 7B). In the validation cohort (GSE13507), AUC values at 1, 3, and 5 years were 0.841, 0.717, and 0.664, respectively (Figure 7B). Compared with the AUC values of disease stages (Figure S5), we observed that AUC values of nomogram of training set and validation cohort were higher than that of disease stages at 1, 3, and 5 years. The calibration plots of the nomogram are displayed in Figure 7C. Thus, the nomogram we developed worked as a good model for predicting BLCA prognosis.
Figure 7.
Construction of a nomogram. (A) A nomogram was developed to predict the 1-, 3-, and 5-year OS of BLCA patients in the training set. (B) ROC curves were constructed to predict the 1-, 3-, and 5-year survival rates in both the training (TCGA) and testing (GSE13507) cohorts. (C) Calibration curves were generated to evaluate the performance of the nomogram in predicting the 1-, 3-, and 5-year survival rates in both the training and testing cohorts. ***, P<0.001. TCGA, The Cancer Genome Atlas; BLCA, bladder cancer; AUC, area under the curve; OS, overall survival; ROC, receiver operating characteristic.
Discussion
In our study, we integrated and analyzed transcriptomic patterns mediated by CPRGs. We observed that the BLCA cohort curated from TCGA could be divided into three clusters with distinct clinicopathological characteristics, among which cluster 1 exhibited the worst survival rate and enrichment with immune-activated pathways. Here, we demonstrated that cluster 1 exhibited the enrichment with immune-activated pathways due to activated CD4/8+ T cells. As previously reported (24,25), cytotoxic CD8+ T cells (CTLs), as an activated type of CD8+ T cells, are a major population of TME cells that acts against the tumor. Therefore, it is advised to promote the activities of CD8+ T cells to enhance patients’ response to immunotherapy in cluster 1. In this part, our research delineated intra-tumor heterogeneity of transcriptomic classifications mediated by cuproptosis and characterized their TME infiltration characteristics. From this, we believed that cuproptosis-based molecular subtypes could provide the new insights of cuproptosis molecular function in BLCA tumorigenesis (26).
Since molecular classifications were mainly based on the characteristics of specific population of patients, we next would like to investigate the correlation between cuproptosis-based mediation and individual patient prognosis. Considering that there were few genes (ten genes were included in this study) related to cuproptosis, we performed analyses as previously reported and obtained in total of 426 DEGs exhibited in all three subtypes, which were finally recognized as cuproptosis phenotype-related genes. By using a model of machine learning including 1,000 iterations, we constructed a risk_model based on 14 genes. Next, three datasets (TCGA-BLCA, GSE13057, and GSE32894) were used to validate the accuracy of risk_model in prognosis prediction. Here, we demonstrated high risk score was consistently related to the worse prognosis and positively correlated with cluster 1, suggesting that this risk_model exhibited an excellent prognostic ability.
Finally, to improve the accuracy of prognosis prediction, we incorporated tumor-node-metastasis (TNM) stages and risk-score to construct a nomogram. In the training, validation, and external sets, we confirmed the strong ability of prediction in our nomogram. Therefore, the nomogram could be used as a cuproptosis-based predictive tool in clinical practice (27,28). However, our study mainly focused on the bioinformatics analyses, which would be short of robust confirmation. More in-depth experimental validation of our findings will be conducted in the near future.
Conclusions
CPRGs play a crucial role in the TME of BLCA, influencing clinical outcomes and immune responses. Their integration into clinical practice could improve prognostic predictions and inform personalized immunotherapy strategies, offering new directions for research and treatment in BLCA.
Supplementary
The article’s supplementary files as
Acknowledgments
We thank TCGA for providing the dataset. Methods were carried out in accordance with relevant guidelines and regulations from TCGA.
Funding: None.
Ethical Statement: The authors are accountable for all aspects of the work in ensuring that questions related to the accuracy or integrity of any part of the work are appropriately investigated and resolved. The study was conducted in accordance with the Declaration of Helsinki (as revised in 2013).
Footnotes
Reporting Checklist: The authors have completed the TRIPOD reporting checklist. Available at https://tau.amegroups.com/article/view/10.21037/tau-24-456/rc
Conflicts of Interest: All authors have completed the ICMJE uniform disclosure form (available at https://tau.amegroups.com/article/view/10.21037/tau-24-456/coif). The authors have no conflicts of interest to declare.
References
- 1.Richters A, Aben KKH, Kiemeney LALM. The global burden of urinary bladder cancer: an update. World J Urol 2020;38:1895-904. 10.1007/s00345-019-02984-4 [DOI] [PMC free article] [PubMed] [Google Scholar]
- 2.Bray F, Ferlay J, Soerjomataram I, et al. Global cancer statistics 2018: GLOBOCAN estimates of incidence and mortality worldwide for 36 cancers in 185 countries. CA Cancer J Clin 2018;68:394-424. 10.3322/caac.21492 [DOI] [PubMed] [Google Scholar]
- 3.di Meo NA, Loizzo D, Pandolfo SD, et al. Metabolomic Approaches for Detection and Identification of Biomarkers and Altered Pathways in Bladder Cancer. Int J Mol Sci 2022;23:4173. 10.3390/ijms23084173 [DOI] [PMC free article] [PubMed] [Google Scholar]
- 4.Alexandrov LB, Nik-Zainal S, Wedge DC, et al. Signatures of mutational processes in human cancer. Nature 2013;500:415-21. 10.1038/nature12477 [DOI] [PMC free article] [PubMed] [Google Scholar]
- 5.Lenis AT, Lec PM, Chamie K, et al. Bladder Cancer: A Review. JAMA 2020;324:1980-91. 10.1001/jama.2020.17598 [DOI] [PubMed] [Google Scholar]
- 6.Oliveri V. Selective Targeting of Cancer Cells by Copper Ionophores: An Overview. Front Mol Biosci 2022;9:841814. 10.3389/fmolb.2022.841814 [DOI] [PMC free article] [PubMed] [Google Scholar]
- 7.Cobine PA, Moore SA, Leary SC. Getting out what you put in: Copper in mitochondria and its impacts on human disease. Biochim Biophys Acta Mol Cell Res 2021;1868:118867. 10.1016/j.bbamcr.2020.118867 [DOI] [PMC free article] [PubMed] [Google Scholar]
- 8.Mao S, Huang S. Zinc and copper levels in bladder cancer: a systematic review and meta-analysis. Biol Trace Elem Res 2013;153:5-10. 10.1007/s12011-013-9682-z [DOI] [PubMed] [Google Scholar]
- 9.Mortada WI, Awadalla A, Khater S, et al. Copper and zinc levels in plasma and cancerous tissues and their relation with expression of VEGF and HIF-1 in the pathogenesis of muscle invasive urothelial bladder cancer: a case-controlled clinical study. Environ Sci Pollut Res Int 2020;27:15835-41. 10.1007/s11356-020-08113-8 [DOI] [PubMed] [Google Scholar]
- 10.Ruiz LM, Libedinsky A, Elorza AA. Role of Copper on Mitochondrial Function and Metabolism. Front Mol Biosci 2021;8:711227. 10.3389/fmolb.2021.711227 [DOI] [PMC free article] [PubMed] [Google Scholar]
- 11.Tsvetkov P, Coy S, Petrova B, et al. Copper induces cell death by targeting lipoylated TCA cycle proteins. Science 2022;375:1254-61. 10.1126/science.abf0529 [DOI] [PMC free article] [PubMed] [Google Scholar]
- 12.Rosenberg JE, Hoffman-Censits J, Powles T, et al. Atezolizumab in patients with locally advanced and metastatic urothelial carcinoma who have progressed following treatment with platinum-based chemotherapy: a single-arm, multicentre, phase 2 trial. Lancet 2016;387:1909-20. 10.1016/S0140-6736(16)00561-4 [DOI] [PMC free article] [PubMed] [Google Scholar]
- 13.Quail DF, Joyce JA. Microenvironmental regulation of tumor progression and metastasis. Nat Med 2013;19:1423-37. 10.1038/nm.3394 [DOI] [PMC free article] [PubMed] [Google Scholar]
- 14.Wang JP, Tang YY, Fan CM, et al. The role of exosomal non-coding RNAs in cancer metastasis. Oncotarget 2017;9:12487-502. 10.18632/oncotarget.23552 [DOI] [PMC free article] [PubMed] [Google Scholar]
- 15.Li X, Wenes M, Romero P, et al. Navigating metabolic pathways to enhance antitumour immunity and immunotherapy. Nat Rev Clin Oncol 2019;16:425-41. 10.1038/s41571-019-0203-7 [DOI] [PubMed] [Google Scholar]
- 16.Vuong L, Kotecha RR, Voss MH, et al. Tumor Microenvironment Dynamics in Clear-Cell Renal Cell Carcinoma. Cancer Discov 2019;9:1349-57. 10.1158/2159-8290.CD-19-0499 [DOI] [PMC free article] [PubMed] [Google Scholar]
- 17.Rodvold JJ, Chiu KT, Hiramatsu N, et al. Intercellular transmission of the unfolded protein response promotes survival and drug resistance in cancer cells. Sci Signal 2017;10:eaah7177. 10.1126/scisignal.aah7177 [DOI] [PMC free article] [PubMed] [Google Scholar]
- 18.Damrauer JS, Roell KR, Smith MA, et al. Identification of a Novel Inflamed Tumor Microenvironment Signature as a Predictive Biomarker of Bacillus Calmette-Guérin Immunotherapy in Non-Muscle-Invasive Bladder Cancer. Clin Cancer Res 2021;27:4599-609. 10.1158/1078-0432.CCR-21-0205 [DOI] [PMC free article] [PubMed] [Google Scholar]
- 19.Charoentong P, Finotello F, Angelova M, et al. Pan-cancer Immunogenomic Analyses Reveal Genotype-Immunophenotype Relationships and Predictors of Response to Checkpoint Blockade. Cell Rep 2017;18:248-62. 10.1016/j.celrep.2016.12.019 [DOI] [PubMed] [Google Scholar]
- 20.Sheng H, Zhang G, Huang Y, et al. A 5-lncRNA Signature Associated with Smoking Predicts the Overall Survival of Patients with Muscle-Invasive Bladder Cancer. Dis Markers 2021;2021:8839747. 10.1155/2021/8839747 [DOI] [PMC free article] [PubMed] [Google Scholar]
- 21.Hänzelmann S, Castelo R, Guinney J. GSVA: gene set variation analysis for microarray and RNA-seq data. BMC Bioinformatics 2013;14:7. 10.1186/1471-2105-14-7 [DOI] [PMC free article] [PubMed] [Google Scholar]
- 22.Chen B, Khodadoust MS, Liu CL, et al. Profiling Tumor Infiltrating Immune Cells with CIBERSORT. Methods Mol Biol 2018;1711:243-59. 10.1007/978-1-4939-7493-1_12 [DOI] [PMC free article] [PubMed] [Google Scholar]
- 23.Song Q, Shang J, Yang Z, et al. Identification of an immune signature predicting prognosis risk of patients in lung adenocarcinoma. J Transl Med 2019;17:70. 10.1186/s12967-019-1824-4 [DOI] [PMC free article] [PubMed] [Google Scholar]
- 24.Farhood B, Najafi M, Mortezaee K. CD8(+) cytotoxic T lymphocytes in cancer immunotherapy: A review. J Cell Physiol 2019;234:8509-21. 10.1002/jcp.27782 [DOI] [PubMed] [Google Scholar]
- 25.Ta HM, Roy D, Zhang K, et al. LRIG1 engages ligand VISTA and impairs tumor-specific CD8(+) T cell responses. Sci Immunol 2024;9:eadi7418. 10.1126/sciimmunol.adi7418 [DOI] [PMC free article] [PubMed] [Google Scholar]
- 26.Li B, Jin K, Liu Z, et al. Integrating molecular subtype and CD8(+) T cells infiltration to predict treatment response and survival in muscle-invasive bladder cancer. Cancer Immunol Immunother 2024;73:66. 10.1007/s00262-024-03651-3 [DOI] [PMC free article] [PubMed] [Google Scholar]
- 27.Liu G, Jin K, Liu Z, et al. Integration of CD4+ T cells and molecular subtype predicts benefit from PD-L1 blockade in muscle-invasive bladder cancer. Cancer Sci 2024;115:1306-16. 10.1111/cas.16119 [DOI] [PMC free article] [PubMed] [Google Scholar]
- 28.Warrick J. Molecular Subtypes of Bladder Cancer: Component Signatures and Potential Value in Clinical Decision-making. Adv Anat Pathol 2024;31:178-87. 10.1097/PAP.0000000000000430 [DOI] [PubMed] [Google Scholar]


