

Abstract
Small membranous extracellular vesicles (EV) incorporate proteins and nucleic acids from the parent cell. Proteins exposed on EV surface are dictated by cellular origin and biogenesis pathway. To better understand the EV origin and function, it is important to develop methods that reveal surface protein composition of heterogeneous EV populations in culture supernatants and in biofluids. Tetraspanins CD9, CD63, and CD81 are common and abundant EV markers. However, their relative enrichment (profile) on EVs of specific cellular origins is not fully elucidated. We introduce LuminEV, a novel version of the Luminex assay for the multiplexed analysis of EV surface proteins. Optimized LuminEV reagents enable direct, specific, and sensitive measurements of EV markers in biofluids and in culture supernatants, bypassing EV isolation step. LuminEV assay for CD9, CD63, and CD81 was validated by comparing simplex and multiplex measurements, establishing linearity, spike‐in recovery, inter‐ and intra‐assay precision, and reproducibility between operators. LuminEV measurements of CD9, CD63, and CD81 in conditioned media from 15 cell lines revealed strong variations between cell types and showed high sensitivity, which enabled EV detection without prior concentration. Using tetraspanin levels as a readout, we noted suppression and induction of EV release from the cultured cells by GW6869 and monensin. Measurement of EV CD9, CD63, and CD81 in blood plasma from 70 disease‐free donors showed respective abundance of 72, 16, and 12%. CD63 displayed weak, albeit significant, negative correlation with age and was slightly lower in female samples. The assay was then used to detect cell type‐specific EV surface markers, including CD235a (erythrocytes), GAP43 (neurons), and CD68 (macrophages), and to detect differences in tetraspanin profiles between healthy and diseased donors. In summary, LuminEV offers robust and sensitive approach for multiplexed assessment of EV surface proteins, to facilitate the research into EV biology, biomarker, and therapeutic applications.
Keywords: assay validation, extracellular vesicles, surface marker analysis, tetraspanin composition
1. INTRODUCTION
Extracellular vesicles, EVs, are nano‐sized membranous particles that play essential roles in the long‐range intercellular communications and contain lipids, soluble proteins, RNA, and surface proteins reflective of their origin and function (He et al., 2018). The ubiquitous EV presence in the body fluids, their diverse biogenesis pathways and capacity for the targeted cargo delivery to a broad range of cell types have inspired research into EV properties as a source of biomarkers and as therapeutic modalities, especially for targeted drug delivery. EV biogenesis pathways include budding of the plasma membranes, nanotube trimming, reverse inward budding of the late and recycling endosomes, as well as the fusion of autophagosomes and lysosomes with the plasma membranes (Saadeldin et al., 2023; Sonbhadra et al., 2023). Thus even EVs released by the same cell types are intrinsically heterogeneous. In biofluids, such as blood plasma, additional layers of heterogeneity stem from the EVs release by different cell and tissue types (Skoczylas et al., 2023). The resulting EV populations are heterogeneous in size, density, and surface protein composition, which hinder reliable EV separation, molecular characterization and functional analysis (Rak, 2010; Colombo et al., 2014).
Current EV isolation methods primarily rely on their physical properties, for example, size and density. These techniques tend to generate mixed EV populations, with disparate molecular and functional characteristics. The importance of EV surface proteins for differentiating between EV subtypes within such populations is widely recognized since surface proteins reflect EV origin, biogenesis, and function (Colombo et al., 2014). To facilitate the analysis of EV surface proteins, several sandwich immunoassays have been developed, wherein EVs are captured and detected with a pair of antibodies targeting distinct surface proteins. These assays predominantly rely on surface‐immobilized antibodies and require preliminary EV isolation from biofluids or conditioned media, using techniques based on size fractionation (ultracentrifugation, ultrafiltration or size exclusion chromatography). As a result, currently used immunoassay platforms typically analyse EV populations defined by the size range (predominantly small EVs, with diameters under 200 nm). Furthermore, these methods lack the ability to multiplex, that is, simultaneously examine multiple proteins to achieve comprehensive characterization of a whole EV population in a single sample (Nolan and Duggan, 2018; Chiang and Chen, 2019; Kurian et al., 2021).
Here, we present a novel immunoassay, LuminEV, which is designed to overcome these hurdles. LuminEV can be used with unprocessed biological fluids and is completely independent of vesicle size. In contrast, it relies on co‐localization of the surface‐exposed tetraspanins and/or other EV markers of interest. Tetraspanins, a family of transmembrane proteins with four membrane‐spanning domains forming distinctive symmetrical structures, play crucial roles in cell membrane organization and thus participate in a wide variety of cellular processes. Three tetraspanins CD9, CD63 and CD81 are also the most commonly used EV surface markers (Andreu & Yáñez‐Mó, 2014).
LuminEV, is specifically designed for the use with MagPlex beads, onto which antibodies against EV markers are covalently bound via carboxyl groups. MagPlex beads are proprietary magnetic particles manufactured by Luminex Corporation specifically designed for Multi‐Analyte Profiling (MAP) technology. MAP technology relies on the same basic principles as flow cytometry, where microspheres (beads) in multiple ranges of fluorescence (up to 500 clearly distinguishable ranges are currently available) pass via microfluidic channel where a red laser or LED excites the internal dyes to distinguish between microsphere sets and a green laser or LED excite the fluorescent reporter dye, in our case phycoerythrin, to enable reading. The detailed description of the MAP technology and underlying principles can be found on the Luminex—Diasorin web page, https://int.diasorin.com/en/luminex‐ltg.
Here, we utilized the major EV tetraspanins, CD9, CD63, and CD81, for both EV capture and detection (Figure 1a). The multiplexed measurements are achieved by simultaneously using multiple capture antibodies conjugated to microspheres in distinct ranges of fluorescence. Because EVs simultaneously display multiple tetraspanin molecules, including multiple iterations of the same tetraspanin (e.g., CD9), it is feasible to use different formats of the same antibody simultaneously for the capture (MagPlex microspheres with covalently bound antibody) and detection (biotinylated antibody followed by streptavidin‐conjugated reporter, such as phycoerythrin, PE). For EV profiling, our final version of LuminEV incorporates the combination of three distinct capture beads, each decorated with a single capture antibody for an individual tetraspanin, and the cocktail of three biotinylated detection antibodies against CD9, CD63 and CD81 (pan‐tetraspanin cocktail), to maximize sensitivity by accessing all possible tetraspanin combinations on a given EV particle. We show that LuminEV combines high sensitivity with multiplexing capacity and can be used for EV assessment in unprocessed cell culture media and in blood plasma samples. In side‐by‐side assessments, LuminEV favorably compared with commercially available tetraspanin immunoassays, Enzyme Linked Immunosorbent Assay (ELISA), and Mesocale Discovery (MSD). We demonstrate potential value of the LuminEV platform for EV measurement and characterization in large population studies, and for the medium‐throughput drug screening. LuminEV can also be useful as a quality control assay for therapeutic EV production. In this manuscript, we report the development and validation of the LuminEV assay for the detection of CD9, CD63, and CD81 on EV surface, using purified EVs, cell culture media and blood plasma. Importantly, LuminEV saves valuable sample, time and reagents compared to EV profiling assays that lack multiplexing capacity and measure a single analyte.
FIGURE 1.
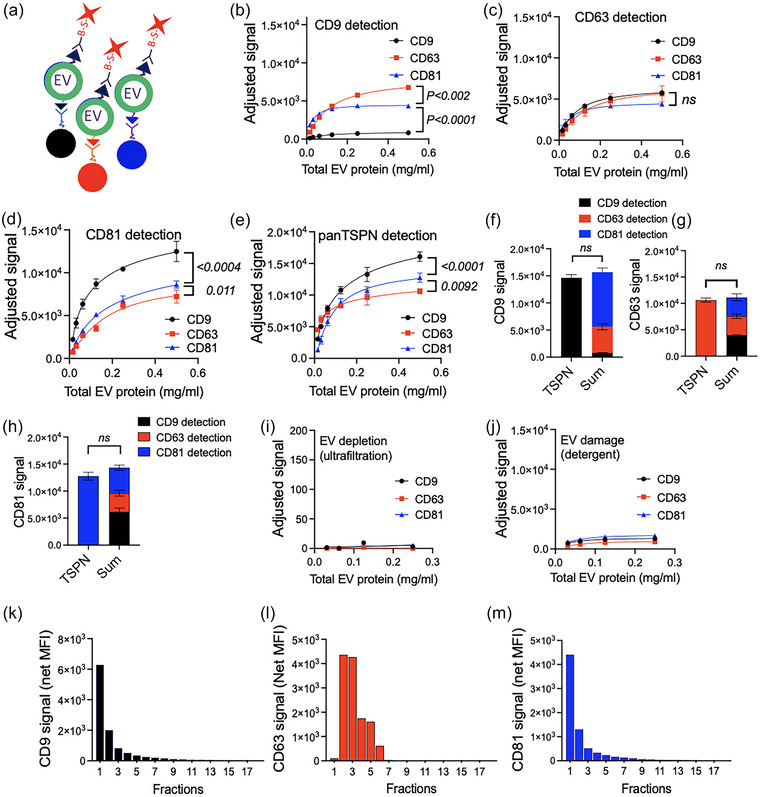
LuminEV enables specific capture and detection of purified extracellular vesicles (EVs). MagPlex particles in three distinct ranges were decorated with antibodies specific for CD9, CD63, and CD81, respectively. (a) Schematic diagram illustrating LuminEV principle. Upon incubation with the sample, three distinct beads decorated with antibodies against different tetraspanins capture extracellular vesicles expressing appropriate antigens. The‐bead‐ EV complex is recognized with the antibody against at least one tetraspanin, which is present on the same vesicle. (b–e) The beads were used to capture EVs collected from cultured U87 cells and purified by sequential rounds of ion exchange and size exclusion chromatography. Total EV protein in final preparations was measured by NanoDrop, to ensure the removal of free protein after SEC and EVs were subsequently diluted as indicated in NeuroDex assay diluent. The dilutions were plated in triplicates in 96‐well plates and EVs captured using beads decorated with antibodies against CD9, CD63, or CD81 and detected with three single tetraspanin antibodies (b–d) as shown. Note distinct distribution of tetraspanins on CD9‐, CD63‐, and CD81‐positive EVs. (e) EV detection in identical dilutions with a cocktail of biotinylated tetraspanin antibodies (CD9, CD63, and CD81) showed higher sensitivity of detection. (f−h) EV diluted to 0.125 mg/mL were subjected to LuminEV with single or cocktail detection antibodies, as in B‐E and the signal obtained with pan‐tetraspanin detection mix compared to the sum of signals obtained with individual tetraspanin antibodies. (i, j) The signal obtained in LuminEV is obliterated by ultrafiltration through 100 kDa MWCO filter (f) or by sample pre‐treatment with detergent (1% Triton X‐100) (g), suggesting EV‐specific recognition (h). (k–m) Furthermore, when isolated EVs were resolved by SEC on a pre‐calibrated column (Izon Sciences) and fractions were subjected to LuminEV for CD9 (k), CD63 (l), and CD81 (m), all major tetraspanin signals were detected in fractions 1–5, which are expected to contain most EVs. For all measurements S.D. values are shown. Statistical significance for line graphs was calculated using multiple comparison test with Bonferroni post‐test. For the bar graphs, statistical significance was determined by two‐way ANOVA. The SEC separation shown in k‐m was performed at least three times with similar results. P values are shown. Ns, not significant.
2. MATERIALS AND METHODS
2.1. Preparation and characterization of LuminEV beads
Antibodies were conjugated to magnetic microspheres in a selected colour range, functionalized with carboxyl groups (MagPlexR, Luminex Corp., Cat. No. MC1XXXX‐01, where XXX correspond to changing catalogue numbers for distinct reference colors), using 1‐ethyl‐3‐(3‐dimethylaminopropyl) carbodiimide (EDC) chemistry (He et al., 2007). Following conjugation, the resultant bead concentration (recovery) was determined in a Countess™ 3 FL automated cell counter (Thermo Fisher Scientific, Cat. No. A49866) using reusable chamber slides (Thermo Fisher Scientific, Cat. No. A25750). The beads were stored in a NeuroDex blocking buffer, to minimize non‐specific interactions, at a minimum concentration of 1 × 10⁶/mL and for up to 3 months. To measure antibody loading, LuminEV beads were resuspended in Assay Diluent at 5.0 × 10⁴ beads/mL and loaded into 96‐well black plates (BrandTech, Cat. No. 781671) at a minimum of 200 beads/well. Serially diluted PE‐conjugated secondary antibodies were added in duplicates. Assay Diluent was used only as a background control. The staining was carried out for 30 min at room temperature in a Genie® Microplate Mixer (600 RPM). Beads were washed three times in a magnetic plate holder and resuspended in xMAP Sheath Fluid Plus (100 µL/well, Thermo Fisher Scientific, Cat. No. 4050021). A minimum of 100 beads per condition were analysed in a Luminex 200 plate reader.
2.2. Preparation of biotinylated detection antibodies
Antibodies were biotinylated by overnight incubation at 4°C with an EZ‐link™ reagent (Thermo Fisher Scientific, Cat. No. 21442) at 20‐fold molar excess, per manufacturer's instructions and biotinylation confirmed by ELISA. Excess reagent was removed using Zeba™ Spin Desalting Columns, 7K MWCO (Thermo Fisher Scientific, Cat. No. 89882).
For specific information, please see Table 1 (capture and detection antibodies) and Table 2 (secondary antibodies).
TABLE 1.
Capture and detection antibodies used in LuminEV assay.
| Antigen | Vendor | Usage | Cat. No. | Host/Type | Species specificity | Marker specificity |
|---|---|---|---|---|---|---|
| CD9 | BioLegend | Capture | 312102 | Mouse Monoclonal | Human, simian | Pan‐EV |
| Biotin‐CD9 | BioLegend | Detection | 312112 | Mouse Monoclonal | Human, simian | Pan‐EV |
| CD63 | BioLegend | Capture | 353039 | Mouse Monoclonal | Human, simian | Pan‐EV |
| Biotin‐CD63 | BioLegend | Detection | 353018 | Mouse Monoclonal | Human, simian | Pan‐EV |
| CD81 | BioLegend | Capture | 34950 | Mouse Monoclonal | Human, simian | Pan‐EV |
| Biotin‐CD81 | BioLegend | Detection | 349514 | Mouse Monoclonal | Human, simian | Pan‐EV |
| CD171 | Thermo Fisher Scientific | Capture | 14‐1719‐82 | Mouse Monoclonal | Human | Neuronal, gut |
| CD235a | BioLegend | Capture | 349502 | Mouse Monoclonal | Human | Erythroid |
| GAP43 | Thermo Fisher Scientific | Capture | MA5‐32256 | Rabbit monoclonal | Human, mouse, rat | Neuronal |
| CD68 | BioLegend | Capture | 333802 | Rat Monoclonal | Mouse, human | Microglia |
| IgG2A | Thermo Fisher Scientific | Capture control | 14472482 | Mouse | N/A | Isotype control |
TABLE 2.
Secondary antibodies to measure primary antibody loading on microspheres.
| Antibody | Vendor | Cat. No. |
|---|---|---|
| PE Goat anti‐mouse IgG | BioLegend | 312102 |
| PE Donkey anti‐rabbit IgG | BioLegend | 406421 |
| PE Goat anti‐rat IgG | BioLegend | 405406 |
2.3. LuminEV procedure
Samples were adjusted with an Assay Diluent to a final volume of 50 µL (plasma inputs are indicated for each experiment) and transferred into 96‐well black plates. Assay Diluent was used only as a background control. A working suspension of LuminEV capture beads was generated to yield at least 2.5 × 10⁴ beads/mL for each capture antibody, for up to seven analytes, and 50 µL of bead suspension was added to each well. EV capture was carried out overnight (16–18 h) at 4°C on a microplate shaker (600 RPM). The plates were washed twice in a magnetic plate holder in NeuroDex Wash Buffer, and the beads were resuspended in Assay Diluent supplemented with biotinylated detection antibody (1‐2 µg/mL, as indicated, 50 µL/well). After a 2‐h incubation at room temperature in a microplate shaker the beads were washed three times in Wash Buffer, resuspended in 50 µL PBS supplemented with Streptavidin‐PE reagent (SAPE, 6 µg/mL) and incubated 20 min at room temperature with shaking. Following SAPE incubation, the beads were washed three times in Wash Buffer, resuspended in xMAP Sheath Fluid (Millipore Sigma, Cat. No. 40‐50015, 100 µL/well), and analysed in a Luminex200 plate reader. For workflow see Figure S1.
EV isolation methods:
Conditioned media collection: Serum‐free conditioned media from U87 and HEK 293 cells (ATCC) and differentiated iPSC neurons (BrainXell) were collected as follows: the cells grown to 50%–70% confluence in complete media were washed three times with EV‐free, serum‐free basal media (SFBM). After the last wash, SFBM were added to the cells for 2 h, to wash off residual serum components, then replaced by fresh SFBM and incubated for 48 h. The media were cleared of dead cells and cell debris by two centrifugation rounds (10 min, 3000 × g and 30 min 10,000 × g) and stored at −80°C until further use.
Ion exchange chromatography: EVs released by the U87MG and HEK293 cells were purified by ion exchange chromatography (IEC) on Q Sepharose Fast Flow (Cytiva, Cat. No 17‐0510‐10) as described previously (Kosanovic et al., 2017). Briefly, pre‐cleared media were adjusted to pH8.0, filtered via 0.22 um PES filters and loaded at room temperature on 10–20 mL FastQ Sepharose column (Cytiva) pre‐equilibrated with 5–6 volumes of 0.05 M Tris–HCl, pH 8.0. The unbound material was removed with excess (five–six column volumes) of equilibration buffer, followed by stepwise elution with five column volumes each, of 0.1 M NaCl in 0.05 M Tris–HCl pH 8.0, and 0.2 M NaCl in 0.05 M Tris–HCl pH 8.0, to remove weakly bound proteins. The EVs were eluted in 1.5 column volumes of 0.4 M NaCl in 0.05 Tris‐HCl pH8.0, and were concentrated in 100 kDa MWCO spin filters (Pall Corporation, Cat. No MAP100C38). The. Excess NaCL was removed by dialysis against NeuroDex storage buffer supplemented with protease inhibitors (Thermo Fisher Scientific, Cat. No 78429).
Size exclusion chromatography (SEC): SEC was used to isolate EVs from crude plasma, for purification of the concentrated conditioned media from iPSC neurons. It was also used as a second purification step for the preparative isolation of U87 and HEK293 EVs. Plasma EVs were concentrated by precipitation from 1–3 mL plasma using total EV isolation reagent (TEV, NeuroDex, Cat. No EX‐014) and reconstituted in PBS. Conditioned media (30–50 mL) were concentrated to a final 0.5 mL volume by spin‐filtration (100 kDa MWCO, see above) and dialyzed against PBS. The concentrated samples (0.5 and 2 mL, as appropriate) were loaded onto pre‐calibrated SEC columns (IZON Science, qEV Original, Legacy 35 nm and qEV2 Legacy, 35 nm). Void volumes of 2.7 mL and 14.1 mL, respectively, were discarded for each column format, per manufacturer's instructions, and up to 25 0.5 mL and 2 mL fractions were collected using automated fraction collector (IZON). Protein concentration (A280 absorption) in each fraction was assessed by NanoDrop2000 spectrophotometer (Thermo Fisher Scientific) to confirm the separation between the EVs and the bulk of contaminating proteins. The concentrated EVs from conditioned media were further purified by size exclusion chromatography following the ion exchange purification (see above). The EV content in fractions 1–5 was confirmed using ZetaView particle tracer (Particle Metrix) (for details, see Supplementary materials).
2.4. Separation of EVs from brain tissue
Brain‐derived EVs (BEVs) were separated from frozen occipital cortex tissues using published protocol with minor modifications (Huang et al., 2020). After tissue digestion by 75 U/mL of Type 3 collagenase (Worthington #CLS‐3, S8P18814) for 15 min, the dissociated tissue was spun at 300 × g for 10 min and 2000 × g for 15 min at 4°C. Cell‐free supernatant was then filtered through a 0.22 µm filter, and followed by a 10,000 × g spin for 30 min at 4°C. The 10K supernatant was then resolved by size exclusion chromatography (SEC) and EV‐contining fractions concentrated.
2.5. Determination of total EV protein
To provide an estimate of EV content in biological fluids and culture media, for easy assessment of the changes in EV release and tetraspanin representation, intact suspensions of EVs purified from the cultured U87 MG and HEK293 cells were subjected to Nanodrop assessment (A280). Alternatively, protein concentrations in intact EV suspensions were measured using Pierce BCA assay per manufacturer's instructions. Both methods provide a measure of surface‐exposed proteins only, and do not account for the intralumenal proteins. Of note, for EVs isolated by sequential ion exchange and size exclusion chromatography, the of Nanodrop and BCA assay measurements yielded similar values.
2.6. Medium‐throughput LuminEV analysis of conditioned media (96‐well format)
MCF7, HEK293, and U87 cells were plated at 4 × 10⁴, 1.5 × 10⁴, and 3 × 10⁴ cells per well, respectively, in replicates of 16. After 24 hours, the media were replaced with SFBM and incubated for additionl 24 hours. SFBM were then transferred into filter plate (1 um pores) placed on top of dilution plate and centrifuged at 1200 rpm for 10 min. From each well, 50 µL of conditioned media were transferred to Luminex plate. Capture bead suspension (CD9, CD63, CD81, or isotype control beads) was added to each well and incubated overnight.
2.7. Detergent treatment of crude EV fractions
Crude EV fractions generated by PEG‐based precipitation (plasma EVs) or by centrifugation/ultrafiltration through 100 kDa MWCO Amicon spin filter (Millipore UFC901008) were supplemented with Triton X‐100 to a final 2% w/v concentration and incubated for 1–2 h at room temperature or for 30 min at 50°C.
2.8. Statistical analysis
In all assays, all samples were tested in technical duplicates unless otherwise indicated. For the comparison of dilution curves, technical triplicates were implemented. All samples were performed at least three times, with similar results. Pairwise comparisons were performed using a two‐tailed T test for normally distributed data and with a non‐parametric Mann–Whitney test for non‐normally distributed data. Where indicated, multiple comparisons test with Bonferroni posttest were used to compare dilution curves.
3. RESULTS
3.1. LuminEV assay development for cell culture
We sought to develop an assay to capture EVs onto beads conjugated with antibodies against the tetraspanins CD9, CD63, and CD81 and then to characterize the captured EVs using labeled detection antibodies against one or more tetraspanins (Figure 1a). To this end, antibodies against CD9, CD63, and CD81, as well as IgG control, were covalently attached to MagPlexR beads. Antibody loading was confirmed by an anti‐IgG assay (Figure S1A). The capture antibodies were biotinylated, and the levels of biotin verified by dose‐dependent binding of Streptavidin‐PE (SAPE) reagent (Figure S1B). For detailed assay workflow, see Figure S1C.
The initial testing was performed using purified EVs isolated from serum‐free conditioned media isolated by sequential ion exchange and size exclusion chromatography (see Methods). Two common human cell lines were used for EV preparation, U87MG, a glioblastoma, and HEK293, an embryonic kidney cell line. Capture with each tetraspanin antibody generated a dilution‐dependent signal nearing saturation at 0.2–0.4 mg/mL. (Figure 1 and Figure S2). We compared the detection values obtained using individual tetraspanin antibodies (Figure 1b–d, Figure S2A–C) and with a pan‐tetraspanin cocktail combining all three antibodies, CD9, CD63, and CD81 (Figure 1e, Figure S2D). The signal obtained using pan‐tetraspanin cocktail was comparable to the sum of signals obtained with individual detection antibodies (Figure 1f–h, Figure S2E). To verify that the signals were produced by EVs, we performed EV depletion by 100 kDa ultrafiltration, followed by LuminEV analysis of EV‐poor flowthrough (Figure 1g, Figure S2F). We have also used Triton X‐100 treatment to damage the EV membranes (Figure 1h, Figure S2G). Both procedures caused a significant signal reduction. In addition, purified EVs were loaded onto a pre‐calibrated size exclusion column (IZON Sciences), and all fractions were subjected to LuminEV analysis for tetraspanin content (Figure 1i–l). The major tetraspanin peaks were detected in fractions 1–4, consistent with the major EV peak as specified by the manufacturer.
All the experiments above were performed in single‐plex (simplex) format, where a single capture bead is added to the sample. We next tested if LuminEV can is amenable to a multiplex format (multiple capture beads added to the same sample), by comparing data obtained in simplex assays with pan‐tetraspanin cocktail detection, and the data generated in a parallel experiment where all three types of capture beads were applied simultaneously in one sample. For multiplex detection we used a combination of CD9, CD63 and CD81 capture beads supplemented with IgG capture control. The blank and/or the signal obtained with control IgG beads were subtracted from the signal values obtained with specific capture beads (Adjusted signal). We observed no significant differences between simplex and mulitiplex detection for any of the tetraspanins measured in EVs isolated from U87 (Figure 2a–c) or HEK293 culture (Figure 2d–e).
FIGURE 2.
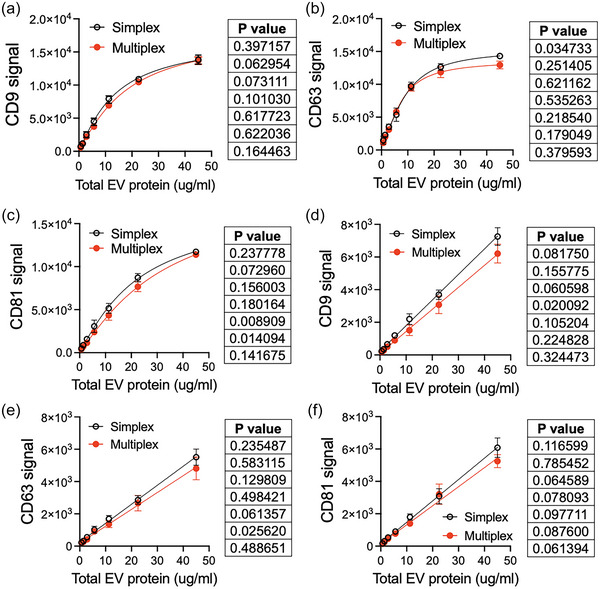
LuminEV with a single bead and multiplex capture yield similar signal values. Serial dilutions of purified U87 and HEK293 EVs were subjected to measurements with a single capture bead (simplex) or using a multiplex mixture of three capture beads decorated with antibodies against CD9, CD63, and CD81. The values obtained for the same capture beads in a multiplex and simplex formats are plotted together to facilitate comparison. (a–c) Median fluorescence intensity for U87 EVs was adjusted for blank value (sample diluent) and plotted for CD9, CD63, and CD81 signal measured in simplex and multiplex assays respectively. (d–f) Median fluorescence intensity for HEK293 EVs was adjusted for the blank value (sample diluent) and plotted for CD9, CD63, and CD81 signal, respectively, measured in simplex and multiplex assays. All measurements were performed in triplicates. The differences between dilution curves were assessed using multiple comparison test with Bonferroni post‐test. P values are shown next to each graph in descending order. Note the lack of significant differences between simplex and multiplex results (p < 0.05).
3.2. LuminEV assay development for plasma samples
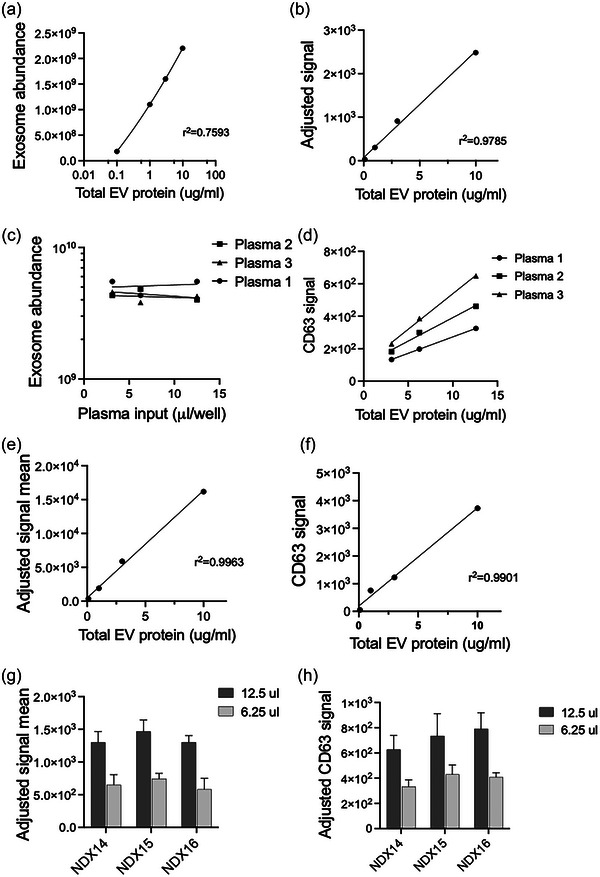
To test whether LuminEV assay is applicable for unprocessed plasma analysis, without prior EV isolation, we examined serial dilutions of plasma (collected with K2 EDTA anticoagulant) in simplex and multiplex formats, using pan‐tetraspanin cocktail for detection (Figure 3a–c). Tetraspanin capture beads generated dilution‐dependent signal that was significantly higher than IgG control (Figure 3d–g). Importantly, tetraspanin‐specific signals were similar between simplex and multiplex assay formats (Figure 3a–c, Figure 3e–g). Furthermore, the signal for each specific tetraspanin was significantly higher than when control capture beads conjugated to isotype IgG antibodies were used (Fig, 3d), both in simplex and in multiplex formats (Figure 3e–g). To further confirm that the LuminEV tetraspanin signal detected in plasma truly reflects plasma EV content, CD9, CD63, and CD81 were measured in plasma depleted of EVs using total EV isolation reagent (Figure 3h–k, depletion) or following membrane disruption with Triton X‐100 (Figure 3h–k, TX‐100). Both EV depletion and membrane disruption dramatically diminished the detectable tetraspanin signal in pooled plasma sample (Figure 3h‐k). Separation of plasma into fractions using size exclusion chromatography revealed CD9 and CD63 signal in early fractions, which are expected to contain EVs (Figure 3l). Importantly, the signal in early fractions was strongly abolished by Triton X‐100 pre‐treatment prior to chromatography (Figure 3l), which indicates the presence of membrane‐bound structures. Transmission electron microscopy of the EV‐containing fractions revealed spherical structures of approximately 50–200 nm in diameter, consistent with the size range described for extracellular vesicles (Figure 3 m). Furthermore, Western blot analysis of the EVs eluted from CD9, CD63, and CD81 LuminEV capture beads showed proportional representation of CD9 protein (Figure S5).
FIGURE 3.
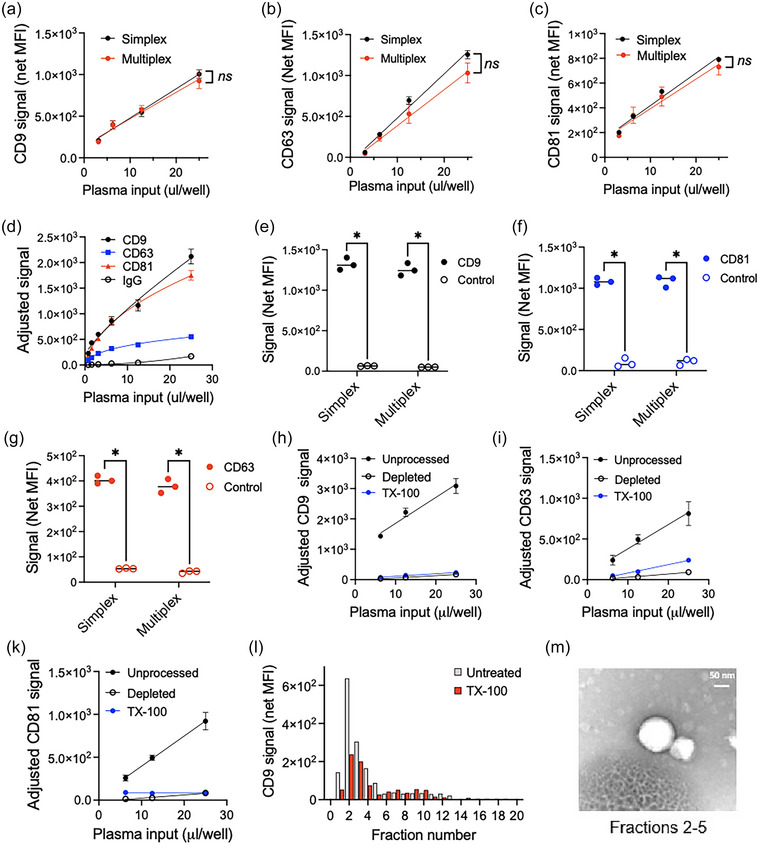
LuminEV shows detection specificity in unprocessed plasma and specifically recognizes EVs. A similar EV capture strategy was applied to blood plasma pooled from 10 disease‐free donors (BioIVT). (a–c) Indicated beads were used to capture EVs in 50 µL of diluted pooled plasma using simplex (black circles) and multiplex formats (red circles). The detection was performed using a mix of antibodies against tetraspanins CD9, CD63, and CD81 (pan‐TSPN cocktail). Median fluorescence intensity (Y axis) adjusted for background fluorescence (sample diluent alone) is plotted against plasma input (X axis) for CD9 (a), CD63 (b), and CD81 (c). Note linear, dilution‐dependent signal, with similar values yielded by simplex and multiplex assays. (d) Serial plasma dilutions were analysed in multiplex LuminEV format with tetraspanin cocktail detection. Control capture beads (IgG) were added to assess non‐specific signal generated by plasma sample. All samples were tested in triplicates. The differences between dilution curves were assessed using multiple measurement test with Bonferroni post‐test. S.D. values are shown. Ns, not significant. (e, f) Plasma samples diluted 4‐fold with sample buffer were subjected to LuminEV with the combination of the indicated tetraspanin (filled circles) and control (IgG) capture beads (empty circles). Note dramatic differences between specific and control capture signal. All samples were assessed in triplicates and the pairwise comparisons performed using two‐tailed T test. Individual values are shown. (g–i) Aliquots of a pooled plasma sample (Precision for Medicine) were depleted of EVs using total EV isolation reagent (Depleted). Alternatively, Triton X‐100 was added to disrupt EV membranes (TX‐100). LuminEV measurements for CD9 (g), CD63 (h), and CD81 (i) were performed as above, on intact plasma (black circles), depleted plasma (empty circles), or TX‐100 treated plasma (blue circles). Note dramatic reduction of specific signal upon EV depletion or with disruption of the EV membrane. All samples were tested in triplicates and the differences between dilution curves established using multiple comparisons test. S.D. and p values are shown. (l) EVs were pre‐treated with TX‐100 prior to loading on pre‐calibrated SEC columns (IZON sciences, QEV Original). 0.5‐mL fractions were collected and assessed by LuminEV for CD9. Note visible reduction of the signal upon TX‐100 treatment (red bars) compared to untreated plasma (gray bars). (m) Fractions 2–5 of intact plasma were pooled and subjected to TEM. Note the presence of spherical structures in appropriate size range, indicative of EV content.
To assess potential dampening of tetraspanin detection in a complex plasma matrix, purified HEK293 EVs were spiked at increasing concentrations into plasma, and their recovery calculated as delta over the baseline signal detected in each given plasma dilution. For all three tetraspanins, signal recovery in plasma was at least 90% (Figure 4a–c).
FIGURE 4.
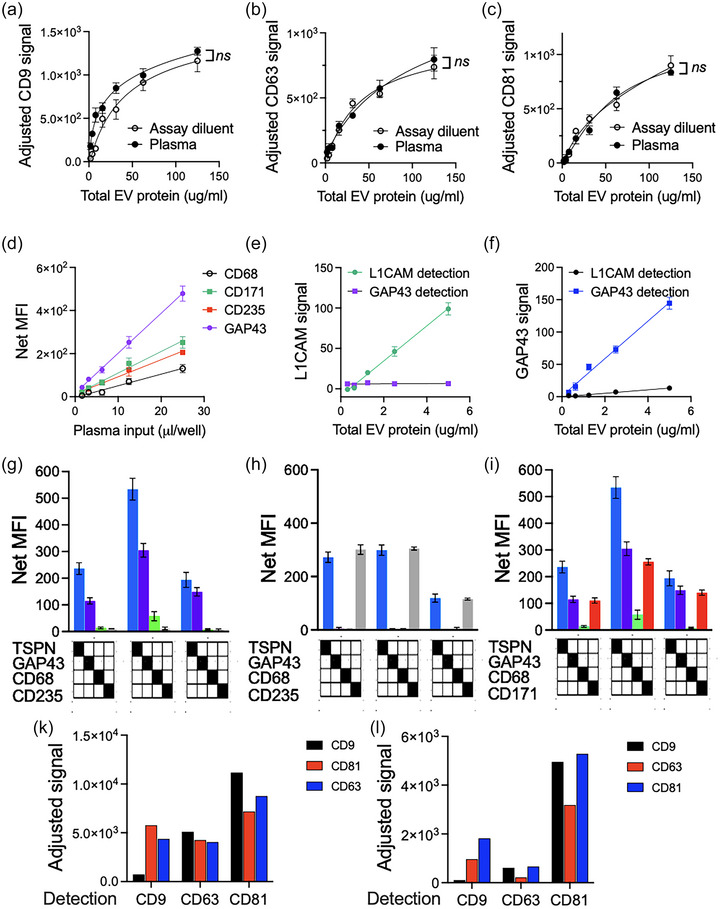
LuminEV can be used to distinguish tissue‐specific EV populations in plasma. (a–c) To rule out potential matrix effects, EVs isolated from the conditioned media of cultured HEK293 cells were spiked at indicated concentrations into unprocessed plasma (closed circles) or added to assay diluent (open circles). CD9 (a), CD63 (b), and CD81 (d) were measured, and the values adjusted for the signal generated by sample diluent (blank) or by plasma alone (matrix background). Note that similar values were generated for spiked EVs regardless of the assay matrix. All samples were tested in duplicates, the difference between dilution curves was determined using multiple comparisons test with Bonferroni post‐test. S.D. values are shown. (d) MagPlex particles were loaded with antibodies against cell type‐specific markers for erythrocytes (CD235), macrophages (CD68), and neurons (GAP43 and CD171). A strong, dilution‐dependent signal with a clear linear range was detected in pooled plasma samples using pan‐TSPN detection. S.D. values are shown. All samples were tested in duplicates and experiments repeated at least three times with similar results. (e–g) The specificity of LuminEV capture was tested by using a range of combinations of the capture and detection antibodies. Note that the material captured with GAP43 antibody can be detected only with tetraspanin or with GAP43 antibodies, but not with CD235 or CD68 antibodies (e). Conversely, particles captured with CD235 beads are recognized only with CD235 or tetraspanin antibodies, but not GAP43 or CD68 antibodies (f). In contrast, CD171 and GAP45 showed cross‐recognition (g), suggesting at least partial co‐localization. All samples were tested in triplicates. S.D. values are shown. (h‐i) Co‐localization of CD9, CD63, and CD81 was assessed on U87 (h) and HEK293 EVs (i) using specified pairs of capture and detection antibodies. Note rare co‐localization of multiple CD9 molecules on a single EV and frequent co‐localization with CD81 in both EV types. Also note the differences in CD63‐positive EVs between U87 and HEK293 EVs. Average values are shown.
3.3. LuminEV assay can be used to identify cell specific EVs and determine colocalization of diverse EV surface markers
Plasma samples contain EVs from a broad range of cells and tissue types. We therefore extended the repertoire of capture beads towards cell type‐specific surface markers, including two neuronal proteins, GAP43 and L1CAM/CD171, erythrocyte marker glycophorin A (CD235A), and macrophage marker CD68. With tetraspanin detection cocktail, all four cell‐specific capture beads generated linear, dilution‐dependent signals (Figure 4d) in pooled human plasma, which was significantly above the signal generated with control beads (loaded with isotype‐matched IgG, data not shown). To demonstrate detection specificity, we used EVs purified from HEK293 cells engineered to overexpress either L1CAM/CD171 or GAP43 neuronal markers, respectively. EVs were purified from conditioned media and subsequently analysed by LuminEV with GAP43 and L1CAM capture beads (Figure 4e, f). L1CAM‐overexpressing EVs generated signal only with L1CAM, but not with GAP43 capture beads (Figure 4e). Similarly, GAP43‐overexpressing EVs generated signal only with GAP43, but not L1CAM capture beads (Figure 4f).
Another potential application of the assay is to detect colocalization of markers on the same vesicle. Here we use this capability to further verify capture specificity by combining markers that are expected or not expected to be on the same EV. EVs captured with GAP43 and CD235 beads were probed alternatively with pan‐tetraspanin antibody cocktail or with antibodies against individual cellular markers GAP43, CD171, CD68, and CD235 (Figure 4g–i). Both GAP43 and CD235a positive EVs were detectable with tetraspanin cocktail; however, GAP43‐positive neuronal EVs were captured by GAP43 but not by macrophage (CD68) or erythrocyte‐specific (CD235a) beads (Figure 4g) and vice versa (4h). In contrast, GAP43‐positive EVs were also detectable with antibodies against another neuronal marker, CD171 (Figure 4i), suggesting at least partial co‐localization of the two neuronal markers on the same EVs.
We also probed fractions of concentrated conditioned media from iPSC neurons resolved on pre‐calibrated gel filtration column (IZON Sciences) (Figure S3). We used capture beads for two neuronal markers (CD171 and GAP43, Figure S3A, B), three tetraspanins (CD9, CD63 and CD81, Figure S3D,E), and erythrocyte marker CD235. As expected, fractions 1–4 contained EVs and were positive for both tetraspanin and neuronal markers, but not for CD235, again pointing to capture specificity.
Finally, using single‐antibody detection, we analysed colocalization of distinct tetraspanins on purified U87 and HEK293 EVs (Figure 4k,l). The results indicate that only a minor fraction of U87 EVs presents with more than one CD9 molecule, while colocalization between either CD9 or CD63 or CD81 with CD63 or CD81 are quite common (Figure 4k). In HEK293 EVs, only a minor fraction presents multiple CD9 molecules, and CD63 is least represented; however, CD81 signal is found on EVs captured by all three antibodies (Figure 4l).
3.4. Assessment of LuminEV precision and dynamic range in purified culture EVs and plasma
We examined LuminEV robustness by testing the same sample set in five technical replicates of seven successive dilutions, repeated in four plates by two independent, proficient operators. EV signal from plasma clearly showed linearity across at least a 16‐fold dilution range (Figure S4). Furthermore, measurements performed on EVs purified from HEK293 conditioned media showed parallelism (lack of sensitivity to dilution), which defines the assay dynamic range between 10 and 10,000 ng/mL (Table 3A). The dynamic range in plasma samples was observed between 4‐fold and 32‐fold dilutions (Table 3B). In this range, variability between technical repeats remains below 14% (Tables 4A, 4B) and below 20% between biological repeats (Tables 5A, 5B).
TABLE 3A.
Parallelism of tetraspanin measurements in isolated culture EVs.
| Total EV (ug protein/mL) | CD9 signal | CD63 signal | CD81 signal | |||
|---|---|---|---|---|---|---|
| Measured | Adjusted | Measured | Adjusted | Measured | Adjusted | |
| U87 EV | ||||||
| 30 | 11738.4 | 391.28 | 12033.3 | 367.7767 | 10661.5 | 355.3833 |
| 10 | 7560.1 | 756.01 | 11346.7 | 1134.67 | 4574.4 | 457.44 |
| 3.333333 | 2597.4 | 779.22 | 3972.9 | 1191.87 | 1497.9 | 449.37 |
| 1.111111 | 801.8 | 721.62 | 1371.2 | 1234.08 | 457.9 | 412.11 |
| 0.37037 | 311.8 | 741.86 | 488.5 | 1318.95 | 173.2 | 467.64 |
| 0.123457 | 92.1 | 746.01 | 152.4 | 1234.44 | 53.6 | 434.16 |
| 0.041152 | 22.7 | 551.61 | 42.5 | 1032.75 | 13.2 | 320.76 |
| HEK293 EV | ||||||
| 150 | 10774.5 | 71.83 | 5267.8 | 35.11867 | 12703.7 | 84.69133 |
| 50 | 4860.2 | 97.204 | 2719.5 | 54.39 | 5552.5 | 111.05 |
| 16.66667 | 1987.8 | 119.268 | 1628.4 | 97.7431 | 2087.6 | 125.256 |
| 5.555556 | 683.1 | 122.958 | 637.7 | 114.786 | 707 | 127.26 |
| 1.851852 | 219.1 | 118.314 | 267.9 | 144.666 | 217.1 | 117.234 |
| 0.617284 | 69.4 | 112.428 | 92.4 | 149.688 | 76.4 | 123.768 |
| 0.205761 | 10774.5 | 118.098 | 30.3 | 147.258 | 25 | 121.5 |
Isolated EVs from U87 and HEK293 cell lines at indicated concentrations were assessed by multiplex LuminEV for CD9, CD63 and CD81 as shown. All signals were adjusted for non‐specific control. Concentrations that showed parallelism when the signal was adjusted for dilution are highlighted in blue.
TABLE 3B.
Parallelism of tetraspanin measurements in pooled plasma samples (Pooled plasma 2).
| Dilution fold | CD9 signal | CD63 signal | CD81 signal | |||
|---|---|---|---|---|---|---|
| Measured | Adjusted | Measured | Adjusted | Measured | Adjusted | |
| 2 | 908.6 | 1817.2 | 453.3 | 906.6 | 292.4 | 584.8 |
| 4 | 578.3 | 2313.2 | 285.7 | 1142.8 | 204.5 | 818 |
| 8 | 367.5 | 2940 | 185.1 | 1480.8 | 139.2 | 1113.6 |
| 16 | 232.4 | 3118.4 | 114.4 | 1830.4 | 85 | 1360 |
| 32 | 132.1 | 3227.2 | 64.8 | 1973.6 | 42.1 | 1347.2 |
| 64 | 70 | 4480 | 31 | 1984 | 17.9 | 1145.6 |
| 128 | 34.2 | 4514.4 | 13 | 1716 | 1.3 | 171.6 |
Pooled plasma was diluted as indicated and three EV‐specific tetraspanins measured by LuminEV. In all cases, the signal was adjusted for non‐specific control. Dilutions that show parallelism are highlighted in blue.
TABLE 4A.
Reproducibility between technical replicates (5 ea) of purified EV dilutions.
| U87 | HEK293 | ||||||||
|---|---|---|---|---|---|---|---|---|---|
| Total EV (µg/mL) | CD9 | CD63 | CD81 | IgG | Total EV (µg/mL) | CD9 | CD63 | CD81 | IgG |
| 30 | 4% | 2% | 8% | 8% | 150 | 7% | 12% | 6% | 1% |
| 10 | 9% | 5% | 5% | 1% | 50 | 4% | 5% | 7% | 5% |
| 3.33 | 18% | 8% | 12% | 6% | 16.66 | 6% | 12% | 11% | 4% |
| 1.11 | 8% | 16% | 6% | 6% | 5.55 | 8% | 11% | 6% | 10% |
| 0.37 | 3% | 12% | 4% | 10% | 1.85 | 5% | 2% | 9% | 4% |
| 0.12 | 11% | 4% | 8% | 4% | 0.612 | 6% | 11% | 10% | 6% |
| 0.04 | 17% | 10% | 11% | 5% | 0.206 | 2% | 4% | 3% | 0.5% |
EVs from two cell lines were diluted as indicated, three major tetraspanins measured by LuminEV and coefficient of variance (CV) calculated for five technical replicates. IgG control was included for all concentrations. Note that CV does not exceed 15%.
TABLE 4B.
Reproducibility between technical replicates (5 ea) of plasma EV measurements.
| Pooled plasma 1 (PFM) | Pooled plasma 2 (PFM) | ||||||||
|---|---|---|---|---|---|---|---|---|---|
| Plasma dilution | CD9 | CD63 | CD81 | IgG | Plasma dilution | CD9 | CD63 | CD81 | IgG |
| 2x | 10% | 4% | 9% | 16% | 2x | 10% | 10% | 16% | 19% |
| 4x | 4% | 0% | 1% | 7% | 4x | 2% | 2% | 3% | 5% |
| 8x | 3% | 1% | 0% | 4% | 8x | 5% | 3% | 5% | 3% |
| 16x | 5% | 2% | 2% | 4% | 16x | 6% | 4% | 3% | 3% |
| 32x | 3% | 2% | 2% | 4% | 32x | 1% | 5% | 3% | 9% |
| 64x | 3% | 2% | 1% | 4% | 64x | 2% | 0% | 1% | 3% |
| 132x | 3% | 4% | 6% | 2% | 132x | 14% | 16% | 13% | 3% |
Two pooled plasma samples were diluted as indicated, three major tetraspanins measured by LuminEV and coefficient of variance (CV) calculated for five technical replicates. IgG control was included for all concentrations. Note that CV exceeds 15% at 2X and 132x dilution.
TABLE 5A.
Reproducibility of EV dilution measurements between the two operators.
| U87 | HEK293 | ||||||
|---|---|---|---|---|---|---|---|
| Total EV (µg/mL) | CD9 | CD63 | CD81 | Total EV (µg/mL) | CD9 | CD63 | CD81 |
| 30 | 4.71% | 2.73% | 12.19% | 150 | 14.98% | 10.92% | 16.08% |
| 10 | 7.58% | 5.14% | 10.18% | 50 | 5.51% | 4.02% | 3.73% |
| 3.33 | 0.31% | 5.75% | 4.26% | 16.66 | 5.29% | 4.83% | 2.53% |
| 1.11 | 3.65% | 8.76% | 0.25% | 5.55 | 12.36% | 3.92% | 4.21% |
| 0.37 | 11.70% | 1.60% | 12.61% | 1.85 | 7.87% | 6.75% | 2.91% |
| 0.12 | 11.42% | 1.91% | 10.28% | 0.612 | 5.36% | 7.86% | 12.86% |
| 0.04 | 23.32% | 22.79% | 24.26% | 0.206 | 5.44% | 8.48% | 1.91% |
EVs from two cell lines were diluted as indicated. Three major tetraspanins were measured by LuminEV in replicates of 5 by two operators, in two parallel assays, and coefficient of variance (CV) calculated for five technical replicates. IgG control was included for all concentrations. Note that CV exceeds 15% only at the lowest concentration tested, for one type of EVs.
TABLE 5B.
Reproducibility of plasma EV measurements between the two operators.
| Pooled plasma 1 (PFM) | Pooled plasma 2 (PFM) | ||||||
|---|---|---|---|---|---|---|---|
| Total EV (µg/mL) | CD9 | CD63 | CD81 | Total EV µ µg/mL) | CD9 | CD63 | CD81 |
| 2x | 12% | 7% | 11% | 2x | 26% | 16% | 28% |
| 4x | 8% | 4% | 7% | 4x | 18% | 4% | 14% |
| 8x | 4% | 6% | 5% | 8x | 8% | 1% | 5% |
| 16x | 8% | 10% | 8% | 16x | 5% | 1% | 3% |
| 32x | 4% | 8% | 7% | 32x | 5% | 5% | 7% |
| 64x | 6% | 9% | 5% | 64x | 11% | 9% | 14% |
| 132x | 5% | 14% | 6% | 132x | 12% | 16% | 26% |
Two pooled plasma samples were diluted as indicated. Three major tetraspanins were measured by LuminEV in replicates of 5 by two operators, in two parallel assays, and coefficient of variance (CV) calculated for five technical replicates. IgG control was included for all dilutions. Note that CV exceeds 15% only for three data points.
In addition, LuminEV was compared with commercial assays that assess tetraspanin levels in EVs, specifically ExoELISA‐ULTRA‐CD63 ELISA (System Biosciences, Cat. No EXEL‐ULTRA‐CD63‐1) and R‐PLEX Human CD63 Assay (Mesoscale Discovery, Cat. No F215L‐3). Measurement of purified U87 EV in CD63 ELISA yielded a linear relationship wherein 1 ug of total EV protein equals approximately 108 EV/mL (Figure 5a,b), which was consistent with the results of ZetaView measurements (Figure S6). This places LuminEV linear assay range between 106 and 109 EV/mL, a sensitivity similar or exceeding ExoELISA‐ULTRA‐CD63. However, unlike commercial LuminEV, commercial CD63 ELISA was incompatible with unprocessed plasma (Figure 5b, c) as it failed to generate a linear, dilution dependent signal. Both MSD assay and LuminEV generated a linear, dilution‐dependent signal with purified HEK293 EVs (Figure 5c, d). Moreover, when 4× and 8× plasma dilutions were tested in parallel in MSD and LuminEV assays, they both produced an appropriate ∼2× signal reduction. Therefore, MSD assay, like LuminEV, is applicable to unprocessed plasma. However, further comparison between the two assays becomes difficult since MSD assay output is in arbitrary units, which have no clear equivalent, neither in particles/mL nor ug of total EV protein/mL and could only be used for normalization purposes.
FIGURE 5.
LuminEV is comparable to the commercial tetraspanin‐based assays. (a, b) Purified EVs were used at indicated concentrations in parallel assays based on CD63 measurement, a CD63‐based ExoLISA (System Biosciences) (a) and LuminEV using CD63 capture and tetraspanin cocktail detection (b). (c, d) Serial dilutions of three pooled plasma samples were assessed by CD63 ExoLISA (c) and by LuminEV (d). Note the lack of dilution dependence in ExoLISA. (e, f) Purified EVs were used at indicated concentrations in parallel assays, CD63 RPLEX (Mesoscale Discovery) (e) and LuminEV (f). Note linear dilution dependent signal in both assays. (g, h) 4x and 8x dilutions of three plasma samples were tested in CD63 RPLEX and LuminEV assays. Both assays yielded appropriate 2‐fold signal reduction upon dilution. All samples were tested in triplicates. S.D. values are shown.
3.5. LuminEV registers the variability of tetraspanin distribution between cell types and plasma samples
Conditioned media from 13 well characterized common cell lines were collected and concentrated by ultrafiltration. EVs were also isolated from neurons differentiated from induced pluripotent stem cell‐derived neurons and from microglia cell lines, as well as from brain tissue. CD9, CD63, and CD81 assessment by LuminEV (Figure 6a–c) showed strong variability between cell types in tetraspanin content and species distribution (Figure 6a, b) as well as cumulative signal (Figure 6c), suggesting that different types of cells release EVs that with distinct surface representation of tetraspanins. The observed variability in CD9, CD63, and CD81 distribution, when normalized to total tetraspanin content (Figure 6a, b), was consistent with the published data obtained with mass‐spectrometry analysis (Kugeratski et al., 2021). This further demonstrates the accuracy of LuminEV and its concordance with other methods.
FIGURE 6.
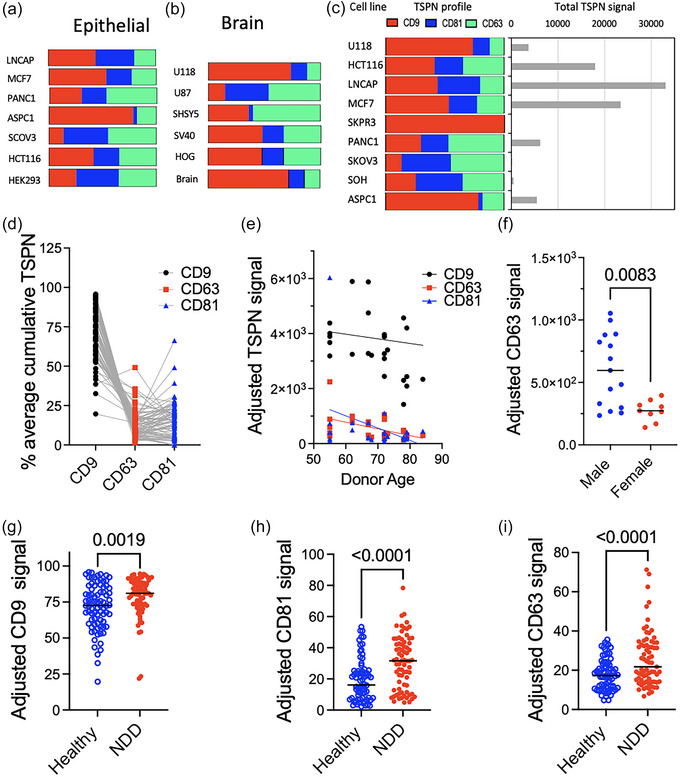
LuminEV is suitable for the assessment of EV tetraspanin profiles in plasma and in cell culture media. (a–c) Conditioned media from established epithelial cell lines (a) and brain‐derived cell lines (b) were analysed using LuminEV assay and tetraspanin profiles compared. The epithelial cell lines include prostate cancer (LNCAP), breast cancer (MCF7), pancreatic cancer (PANC1, ASPC1), ovarian cancer (SCOV3), colorectal cancer (HCT116), and embryonic kidney (HEK293). Brain‐derived cell lines include glioma (U118, U87), neuroblastoma (SHSY5), and brain vascular cell line (SV40). EV isolated from whole brain tissue are used for comparison. (c) Tetraspanin profiles for a range of cell lines normalized as percent of total (cumulative tetraspanin signal per fixed protein input, left) are shown along with EV abundance (total TSPN signal, right). Both tetraspanin profiles and relative EV abundance values are consistent with previously published data. (d–f) Plasma samples from 80 apparently healthy donors were diluted 4‐fold and tetraspanin profiles assessed in a multiplex assay. All values are adjusted for non‐specific control (IgG). (d) Spaghetti plot shows relative contribution (% of total) of CD9, CD81, and CD63. (e) Regression analysis showed no age dependence of the EV tetraspanin content. (f) Data breakdown by sex indicates that CD63 content is higher in plasma EV from male donors. (g–i) Plasma samples from apparently healthy donors (H, N = 78) and ‐ from donors diagnosed with neurodegenerative disease (NDD, N = 76) were analysed at 1:4 dilution in a LuminEV assay and adjusted CD9, CD63 and CD81 signal compared between groups.
Next, plasma samples from apparently healthy donors were analysed by LuminEV for the differences in CD9, CD63, and CD81 content (Figure 6d–f). The variability in CD9, CD63, and CD81 content between individuals was 22%, 71%, and 82% respectively, wherein CD9 was the most abundant, and CD63 was the least abundant of the tree tetraspanins, with median values constituting approximately 72% and 8% of the total, respectively (Figure 6d). These findings are consistent with observations by others (Karimi et al., 2022). No significant correlation was noted between the age and tetraspanin content; however, CD63 displayed modest but significant difference between age‐matched male and female groups (Figure 6e,f). Further studies are required to confirm this initial result.
To demonstrate the suitability of LuminEV for the comparison of EV content and tetraspanin profiles in health and disease, we have measured EV tetraspanins in the plasma of healthy donors (N = 78) and patients with neurodegenerative disease (NDD, N = 86) (Figure 6g–i). Of 80 NDD patients, some were diagnosed with Alzheimer's disease (N = 34) and the rest with Parkinson's disease (N = 52). A modest, but statistically significant increase suggestive of the elevated EV release was observed for all tetraspanins in the NDD group compared to healthy controls.
3.6. EV modulation in cell culture
LuminEV sensitivity allows tetraspanin assessment in unprocessed conditioned media in a 96‐well format, after passing through 1um plate filter to remove cells and large debris. We observed acceptable variability (CV ≤ 20%) between plating replicates (wells) using untreated MCF7, HEK293 and U87 cell lines (Figure 7a–c). Treatment with the nSMase2 inhibitor GW4869 or the ionophore monensin, an inhibitor and a stimulator of EV release, respectively, caused appropriate significant modulation of tetraspanin levels (Figure 7d–f).
FIGURE 7.
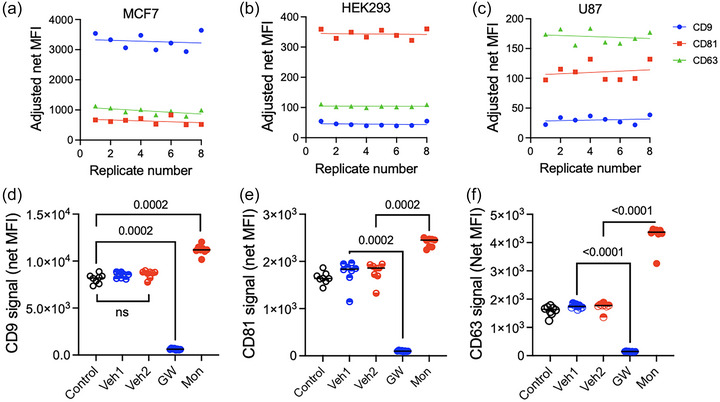
LuminEV is applicable for monitoring EV production and screening of drugs modifying EV release. (a–c) Three cell lines were plated in 96‐well plates: each cell line was plated in replicates of eight. The cells were transferred to serum‐free media and incubated for 24 h, then the media were transferred into 1 µm filter plates, debris removed, and filtrates analysed by LuminEV with CD9, CD63, CD81, and control capture beads. Adjusted CD9, (a), CD81(b), and CD63 (c) signal is plotted for each replicate. Note excellent reproducibility between replicates. (d‐f) MCF7 cells were plated as above. After 24 h, the cells were transferred to serum‐free medium and treated with modifiers of EV production, nSMase2 inhibitor GW4869 and monensin, as indicated, or with vehicle controls (70% EtOH and DMSO, respectively). After 48 hours, the media were transferred into 1 µm filter plates, debris removed and filtrates analysed by LuminEV with CD9, CD63, CD81, and control capture beads. Adjusted CD9, (d), CD81(e), and CD63 (f) signal are shown for each treatment. Note a significant reduction of EV markers in the presence of GW4869 and induction by monensin.
4. DISCUSSION
EV surface protein characterization represents a valuable approach that can aid in defining diverse subpopulations of EVs in cell culture, conditioned media and biofluids, and is also an integral part of MISEV guidelines. Here, we describe the development of a straightforward and robust technique for simultaneous, multiplexed detection and assessment of multiple EV surface proteins. This novel immunoassay, based on a sandwich principle, is applied to intact EVs, with two antibodies against two proteins presumably linked together by the EV membrane. This concept has been exploited for EV analyses in assays ranging from ELISA to microfluidic devices. Here we paired this approach with the Luminex platform, which strategically combines high sensitivity with ease of multiplexing (simultaneous analysis of multiple antigens in the same sample). Importantly, our method, LuminEV, is optimized for the use with unprocessed plasma and conditioned media, thus bypassing time‐consuming and often cumbersome steps of EV separation.
Assay validation according to the published guidelines for EV flow cytometry and FDA guidelines for immunoassay development requires specificity, sensitivity, signal linearity, and precision (https://www.fda.gov/files/drugs/published/Bioanalytical‐Method‐Validation‐Guidance‐for‐Industry.pdf). The specificity requirements for the EV analysis platform are twofold: selectivity for the EVs and specificity for the chosen antigen (surface EV protein). It is critical to note that our assay is not centred around EV size, the only requirement is that the target EV markers are present on the outer EV membrane. LuminEV selectivity toward EVs was demonstrated using EV depletion by multiple methods: PEG‐based precipitation, ultrafiltration with a 100 kDa molecular weight cutoff and EV lysis. All approaches achieved significant (over 50%) reduction in the measured signal. Antibody specificity was assessed using comparison with non‐specific, isotype‐matched control antibodies (IgG) and using sandwich combinations of the antibodies targeting surface markers of distinct cell types for divergent EV subpopulations, for example, erythrocyte, neuron‐, or macrophage‐derived. For example, capture with LuminEV beads against CD235 (erythrocyte marker) yielded clear signal upon detection with a tetraspanin antibody cocktail (a combination of common EV markers), but not with antibodies against neuronal marker GAP43 or macrophage marker CD68. This confirms LuminEV specificity for both EVs and the chosen analytes, in this case, population‐specific surface proteins. Moreover, the data establishes the utility of LuminEV for co‐localization assessment of EV surface proteins, a feature that can be further exploited for the analysis and characterization of EV subtypes in blood plasma and in cell culture media.
Moreover, EVs released by HEK293 cells that were engineered to express a single neuronal antigen, either CD171 or GAP43, were captured only when using beads decorated with the appropriate antibody. No cross‐reactivity was observed with EVs from non‐transfected HEK cells or with EVs from cells expressing the other protein. Similarly, plasma EVs captured by GAP43 antigen showed cross‐reactivity with another neuronal antigen, CD171, but not with an erythrocyte marker, CD235a. The presence of CD171 on neuronal EVs generated in cell culture is in keeping with previous reports (Faure et al., 2006; Lachenal et al., 2011; Norman et al., 2021; Shi et al., 2014), and detection of GAP43 (Pfenninger et al., 1991), another neuron‐specific membrane protein, further corroborates LuminEV specificity. Together, our results clearly demonstrate specificity.
Following initial LuminEV development using a single type of capture bead, we demonstrated the multiplexing capacity of the platform, particularly important for low‐abundance samples collected in clinical studies. Simplex and multiplex assays showed similar linearity and detection range. As expected, the analysis of tetraspanin levels in plasma EVs from 80 donors showed considerable variability between individuals. CD9 is the most abundant tetraspanin in plasma, and CD63 is the least represented. These results are consistent with the findings by others, wherein the K2 EDTA plasma showed the lowest content of CD63‐positive EVs, while in the serum, CD81‐positive EVs were the least represented (Karimi et al., 2022). Despite its low representation in plasma, in our study only CD63 showed significant, albeit weak correlation with the age and biological sex. The ability to measure these and other EV surface proteins in plasma should allow assessments of large cohorts of samples and will aid in identifying critical parameters for EV normalization in biomarker studies. Indeed, a pilot study using samples from healthy donors and patients diagnosed with neurodegenerative disease clearly shows increased tetraspanin levels in the disease group. Such studies may be in the future expanded to other diseases.
Current EV research emphasizes heterogeneity of canonical EV markers, for example, tetraspanins, in EV populations released by diverse cell types. Here we show clear differences in EV tetraspanin expression between thirteen cell lines. Even similar cell lines can display different patterns. For example, EVs from U118 glioblastoma cells predominantly express CD9, while EVs from U87 glioblastoma cells express higher levels of CD81 and CD63. LuminEV can help to identify suitable EV markers for each cell type.
Importantly, LuminEV showed high sensitivity (linear range of 106–109 particles per mL), sufficient for quantification of surface EV tetraspanins in unprocessed conditioned media. Moreover, this high sensitivity allowed us to register the alteration in EV production caused by canonical agents such as an nSMase2 inhibitor and the ionophore monensin in a 96‐well format, suggesting future use as a screening tool for drugs that modulate EV production. To the best of our knowledge, this is the first 96‐well format test of EV release.
In conclusion, LuminEV is a novel, sensitive, specific, and user‐friendly assay for the analysis of EV surface proteins in culture media and, more importantly, in biological fluids. LuminEV offers the advantages of multiplexing, low sample volume requirements and applicability for unprocessed plasma and conditioned media samples. It favorably compares with the existing commercial EV assays and can be used to study EV surface protein composition and colocalization in cell culture and plasma. The assay could be expanded to include a wider array of EV surface proteins, potentially revealing new biomarkers, and providing a more detailed EV profile for various cell types and pathological conditions. We believe that it can inform EV subpopulation analysis in cell culture and in biological fluids and provide links between specific EV populations and their biological functions.
AUTHOR CONTRIBUTIONS
Emma Tordoff: Investigation (lead); writing—review and editing (supporting). Jillian Allen: Investigation (equal). Ahmed Elsherbini: Investigation (equal); writing—review and editing (supporting). Katya Elgart: Investigation (supporting). Erden Eren: Investigation (supporting); writing—review and editing (supporting). Vrinda Kalia: Investigation (supporting); writing—review and editing (supporting). Haotian Wu: Investigation (supporting); writing—review and editing (supporting). Dimitrios Kapogiannis: Conceptualization (supporting); funding acquisition (supporting); methodology (supporting); writing—review and editing (supporting). Olesia Gololobova: Investigation (supporting); writing—review and editing (supporting). Kenneth W Witwer: Conceptualization (equal); methodology (equal); resources (equal); writing—review and editing (equal). Olga Volpert: Conceptualization (lead); methodology (lead); supervision (equal); validation (equal); writing—original draft (lead); writing—review and editing (equal). Erez Eitan: Conceptualization (lead); funding acquisition (lead); methodology (equal); resources (lead); supervision (equal).
CONFLICT OF INTEREST STATEMENT
O.V., E.E., E.T., J.A. and A.E. are currently employed by NeuroDex Inc., a for‐profit start‐up, focused on development of EV‐based diagnostic assay. K.E. was employed by NeuroDex when the work was conducted. E.E. is a major shareholder at NeuroDex. K.W. is or has been an advisory board member of ShiftBio, Exopharm, NeuroDex, NovaDip, and ReNeuron, and holds a portion of NeuroDex options. KW also offers private consultations (Kenneth Witwer Consulting) and conducts research sponsored by Ionis Pharmaceuticals. EE is employed by Denali Therapeutics. All other authors have no competing interests.
Supporting information
Supporting information
ACKNOWLEDGEMENTS
TEM samples were prepared and imaged by the Brandeis Electron Microscopy Facility. The study was supported in part by the Intramural Research Program of the National Institute on Aging, NIH (for E. Eren and D. Kapogiannis).
Tordoff, E. , Allen, J. , Elgart, K. , Elsherbini, A. , Kalia, V. , Wu, H. , Eren, E. , Kapogiannis, D. , Gololobova, O. , Witwer, K. , Volpert, O. , & Eitan, E. (2024). A novel multiplexed immunoassay for surface‐exposed proteins in plasma extracellular vesicles. Journal of Extracellular Vesicles, 13, e70007. 10.1002/jev2.70007
Contributor Information
Olga Volpert, Email: ovolpert@neurodex.co.
Erez Eitan, Email: eeitan@neurodex.co.
DATA AVAILABILITY STATEMENT
All primary data is available upon request. Please contact corresponding author Olga Volpert (ovolpert@neurodex.co).
REFERENCES
- Andreu, Z. , & Yáñez‐Mó, M. (2014). Tetraspanins in extracellular vesicle formation and function. Frontiers in Immunology, 5, 442. [DOI] [PMC free article] [PubMed] [Google Scholar]
- Chiang, C. Y. , & Chen, C. (2019). Toward characterizing extracellular vesicles at a single‐particle level. Journal of biomedical science, 26(1), 9. [DOI] [PMC free article] [PubMed] [Google Scholar]
- Colombo, M. , Raposo, G. , & Thery, C. (2014). Biogenesis, secretion, and intercellular interactions of exosomes and other extracellular vesicles. Annual review of cell and developmental biology, 30, 255–289. [DOI] [PubMed] [Google Scholar]
- Faure, J. , Lachenal, G. , Court, M. , Hirrlinger, J. , Chatellard‐Causse, C. , Blot, B. , Grange, J. , Schoehn, G. , Goldberg, Y. , Boyer, V. , Kirchhoff, F. , Raposo, G. , Garin, J. , & Sadoul, R. (2006). Exosomes are released by cultured cortical neurones. Molecular and Cellular Neurosciences, 31, 642–648. [DOI] [PubMed] [Google Scholar]
- He, J. , Liu, G. , Dou, S. , Gupta, S. , Rusckowski, M. , & Hnatowich, D. (2007). An improved method for covalently conjugating morpholino oligomers to antitumor antibodies. Bioconjugate Chem, 18, 983–988. [DOI] [PMC free article] [PubMed] [Google Scholar]
- He, C. , Zheng, S. , Luo, Y. , & Wang, B. (2018). Exosome Theranostics: Biology and Translational Medicine. Theranostics, 8(1), 237–255. [DOI] [PMC free article] [PubMed] [Google Scholar]
- Huang, Y. , Cheng, L. , Turchinovich, A. , Mahairaki, V. , Troncoso, J. C. , Pletniková, O. , Haughey, N. J. , Vella, L. J. , Hill, A. F. , Zheng, L. , & Witwer, K. W. (2020). Influence of species and processing parameters on recovery and content of brain tissue‐derived extracellular vesicles. Journal of Extracellular Vesicles, 9, 1785746. [DOI] [PMC free article] [PubMed] [Google Scholar]
- Karimi, N. , Dalirfardouei, R. , Dias, T. , Lötvall, J. , & Lässer, C. (2022). Tetraspanins distinguish separate extracellular vesicle subpopulations in human serum and plasma—Contributions of platelet extracellular vesicles in plasma samples. Journal of Extracellular Vesicles, 11, e12213. [DOI] [PMC free article] [PubMed] [Google Scholar]
- Kosanovic, M. , Milutinovic, B. , Goc, S. , Mitic, N. , & Jankovic, M. (2017). Ion‐exchange chromatography purification of extracellular vesicles. Biotechniques, 63, 65–71. [DOI] [PubMed] [Google Scholar]
- Kugeratski, F. G. , Hodge, K. , Lilla, S. , McAndrews, K. M. , Zhou, X. , Hwang, R. F. , Zanivan, S. , & Kalluri, R. (2021). Quantitative proteomics identifies the core proteome of exosomes with syntenin‐1 as the highest abundant protein and a putative universal biomarker. Nature Cell Biology, 23, 631–641. [DOI] [PMC free article] [PubMed] [Google Scholar]
- Kurian, T. K. , Banik, S. , Gopal, D. , Chakrabarti, S. , & Mazumder, N. (2021). Elucidating Methods for Isolation and Quantification of Exosomes: A Review. Molecular biotechnology, 63(4), 249–266. [DOI] [PMC free article] [PubMed] [Google Scholar]
- Lachenal, G. , Pernet‐Gallay, K. , Chivet, M. , Hemming, F. J. , Belly, A. , Bodon, G. , Blot, B. , Haase, G. , Goldberg, Y. , & Sadoul, R. (2011). Release of exosomes from differentiated neurons and its regulation by synaptic glutamatergic activity. Molecular and Cellular Neurosciences, 46, 409–418. [DOI] [PubMed] [Google Scholar]
- Nolan, J. P. , & Duggan, E. (2018). Analysis of Individual Extracellular Vesicles by Flow Cytometry. Methods in molecular biology (Clifton, N.J.), 1678, 79–92. [DOI] [PubMed] [Google Scholar]
- Norman, M. , Ter‐Ovanesyan, D. , Trieu, W. , Lazarovits, R. , Kowal, E. J. K. , Lee, J. H. , Chen‐Plotkin, A. S. , Regev, A. , Church, G. M. , & Walt, D. R. (2021). L1CAM is not associated with extracellular vesicles in human cerebrospinal fluid or plasma. Nature Methods, 18, 631–634. [DOI] [PMC free article] [PubMed] [Google Scholar]
- Pfenninger, K. H. , de la Houssaye, B. A. , Helmke, S. M. , & Quiroga, S. (1991). Growth‐regulated proteins and neuronal plasticity. A commentary. Molecular Neurobiology, 5, 143–151. [DOI] [PubMed] [Google Scholar]
- Rak, J. (2010). Microparticles in cancer. Seminars in thrombosis and hemostasi, 36(8), 888–906. [DOI] [PubMed] [Google Scholar]
- Saadeldin, I. M. , Ehab, S. , & Cho, J. (2023). Relevance of multilamellar and multicompartmental vesicles in biological fluids: understanding the significance of proportional variations and disease correlation. Biomarker Research, 11, 77. [DOI] [PMC free article] [PubMed] [Google Scholar]
- Shi, M. , Liu, C. , Cook, T. J. , Bullock, K. M. , Zhao, Y. , Ginghina, C. , Li, Y. , Aro, P. , Dator, R. , He, C. , Hipp, M. J. , Zabetian, C. P. , Peskind, E. R. , Hu, S. C. , Quinn, J. F. , Galasko, D. R. , Banks, W. A. , & Zhang, J. (2014). Plasma exosomal alpha‐synuclein is likely CNS‐derived and increased in Parkinson's disease. Acta Neuropathologica, 128, 639–650. [DOI] [PMC free article] [PubMed] [Google Scholar]
- Skoczylas, Ł. , Gawin, M. , Fochtman, D. , Widłak, P. , Whiteside, T. L. , & Pietrowska, M. (2023). Immune capture and protein profiling of small extracellular vesicles from human plasma. Proteomics, e2300180. [DOI] [PMC free article] [PubMed] [Google Scholar]
- Sonbhadra, S. , Mehak, & Pandey, L. M. (2023). Biogenesis, isolation, and detection of exosomes and their potential in therapeutics and diagnostics. Biosensors (Basel), 13(8), 802. [DOI] [PMC free article] [PubMed] [Google Scholar]
Associated Data
This section collects any data citations, data availability statements, or supplementary materials included in this article.
Supplementary Materials
Supporting information
Data Availability Statement
All primary data is available upon request. Please contact corresponding author Olga Volpert (ovolpert@neurodex.co).