Abstract
Background/Aim
In the pencil beam scanning carbon-ion radiotherapy, spot positions are arranged in three dimensions throughout the entire target region. Therefore, dose deviations can occur due to spot position errors in the target. However, performing three-dimensional measurements for routine patient-specific quality assurance (PSQA) is difficult because a simple measurement method has not been established. This study aimed to establish a three-dimensional dose verification method using beam delivery log data.
Materials and Methods
Pencil beam dose distributions in water were generated through Monte Carlo (MC) calculations. Treatment beam dose distribution was calculated by superposing the pencil beam dose distributions, considering given spot positions and monitor units (referred to as semi-MC, SMC). The aim of this study was to perform gamma analysis (GA) using dose distributions of log data-based SMC instead of measured dose for PSQA. To verify SMC, the SMC depth-dose curves were compared with the measured dose. To assess the equivalence between the proposed and measurement-based methods, pass rates of two-dimensional GA were compared. Furthermore, a three-dimensional GA was performed to investigate clinically suitable criteria.
Results
The SMC dose curves were consistent with measured dose, with a deviation <5%. In two-dimensional GA, pass rates for the proposed method were generally lower than those for measurement-based method. The results of the three-dimensional GA indicated that the proposed method, with criteria of 3%-3 mm and 3%-2 mm, had capabilities comparable to the measurement-based method.
Conclusion
The developed three-dimensional log data-based PSQA method with criteria of 3%-3 mm and 3%-2 mm is clinically applicable.
Keywords: Carbon-ion radiotherapy, scanning beam delivery, patient-specific quality assurance
Carbon-ion radiotherapy (CIRT) is clinically implemented at more than ten facilities worldwide (1). Compared to X-ray beams, carbon-ion beams exhibit advantageous properties such as a higher dose concentration at the end of the range, commonly known as the Bragg peak, and a greater relative biological effectiveness (2). Although passive scattering beam delivery techniques were initially adopted in CIRT facilities, the scanning beam delivery technique has become widespread (1). One of the advantages of this technique is its ability to achieve a three-dimensional dose distribution that conforms to the tumor shape (3,4), even when the tumor possesses an irregular shape. This conformity is achieved by superposing numerous pencil beams with appropriate weights, optimized to create a uniform dose distribution within the target volume.
In the scanning beam delivery technique, the delivered dose distribution is influenced by various types of errors, including those related to spot position, monitor unit (MU), and beam energy. Simulation studies (5) based on the pencil beam analytical model have indicated that an increase in the standard deviation (SD) of spot position errors notably compromises the flatness of the dose distribution. To assess the accuracy of dose delivery, dosimetric patient-specific quality assurance (PSQA) is conducted (6) based on measurements. Treatment beam is delivered to a water phantom, and dose distributions at several depths are measured using a two-dimensional ionization chamber array. These measured dose distributions are compared with the planned dose distributions converted for the water phantom in the planes at equivalent depths. Given that spot positions are arranged in three dimensions throughout the entire target region, dose deviations due to position errors can occur at any point within the target. Thus, two-dimensional dose verification at a limited number of depths is insufficient. To overcome this limitation, Karger et al. had developed a three-dimensional dosimetric device for CIRT (7). Although this three-dimensional dosimetric device enables more efficient dose verification compared to two-dimensional approaches, the region that can be verified remains limited.
For PSQA of particle therapy, the use of beam delivery log data has been proposed in previous studies (8-11). For the scanning beam delivery method, the log data include various parameters for each delivered pencil beam, including spot position, spot size, MU, and beam energy. Using log data, the distribution of the delivered dose can be deduced in a three-dimensional framework through numerical calculation. Winterhalter et al. proposed the use of log file based Monte Carlo (MC) tool for dose reconstructions using patient CT data in the case of proton therapy (10). They stated that their tool is an end-to-end test incorporating all requirements of PSQA. However, the MC calculations for carbon-ion beams require more time than those for proton beams to achieve adequate precision, because the number of physical processes induced by the carbon-ion beam is greater compared to the proton beam. As a result, the implementation of MC calculations using patient CT data for all treatment beams is a laborious task, even when a high-performance computer cluster is used. The present study introduces a straightforward approach to reconstruct the dose distribution in a water phantom for CIRT using results of MC calculations. Since there are no limitations imposed by devices during the measurement, our method considers the entire target volume, facilitating detailed dose verification.
Materials and Methods
Patient data. The study was conducted retrospectively. All treatment beams originate from clinical cases. Informed consent was procured from patients whose data contributed to this research.
Overview of carbon-ion radiotherapy system. The CIRT machine HyBeat, developed by HITACHI Ltd., Tokyo, Japan, is operational at our facility Osaka-HIMAK. The machine delivers the treatment beam through the raster scanning technique. Layer change is achieved by hybrid energy scanning (12), utilizing 12 accelerated energies in conjunction with range shifters that provide 100 nominal energies. The maximum depth is 30 cm in water, and the layers can be changed at 3 mm intervals. The machine offers a maximum field size of 20 cm×20 cm. Osaka-HIMAK is equipped with three treatment rooms, each consisting of two ports fixed in either vertical, oblique (45˚), or horizontal orientations. Treatment plans are formulated using a treatment planning system called VQA Plan (13,14) (HITACHI Ltd.). The radiobiological model is the mixed beam model (15), in which three types of dose are used: the physical, biological, and clinical doses (13).
Figure 1 presents a schematic of the beam delivery system, which is composed of a sequence of devices ordered from downstream to upstream as follows: range shifters, ripple filter, spot position monitor (SPM), main dose monitor (DM), sub dose monitor, X/Y scanning magnets and profile monitor (RPM). The MU and spot position are measured by the main DM and the SPM, respectively. The DM features a plane-parallel ion chamber with a dynamic range spanning from 6×10⁻⁴ to 0.15 MU/spot. As per the specification of the HyBeat system, a radiation dose of 2 Gy is delivered to the volume of 10 cm×10 cm×10 cm (maximum depth: 20 cm) using 200 MU. Both SPM and PRM are orthogonal multiwire proportional chambers. The wire pitch for the SPM is set at 1 mm. Spot position on the SPM plane is determined by calculating the center of gravity of signals within a range of ±6 channels from the peak. The beam axis is adjusted to ensure that the beam positions on the PRM and SPM planes closely align with the central axis. Following this calibration, the typical beam axis deviation at the PRM is 0.15±0.2 mm, while at the SPM, with the scanning magnets inactive, it is 0.01±0.13 mm. The PRM is removed from the beam path when either treatment or quality assurance (QA) beams are being delivered, because the beam width expands upon passing through PRM. Consequently, the spot position is inferred solely using the SPM, assuming that the beam position in the PRM plane aligns precisely with the central axis. An automated feedback system that corrects this position is used. Within the HyBeat system, log data is stored in the control system’s storage device whenever a treatment beam is delivered, including the QA mode. Subsequently, a log file is automatically transferred to network-connected storage accessible to users. The desired log file can be searched using patient and beam identity, delivery date, treatment room, and operational mode (treatment or QA).
Figure 1.

Schematic of the beam delivery system at Osaka-HIMAK. Numbers in parentheses represent distance from isocenter (unit: meter).
Measurement-based PSQA. In this subsection, conventional measurement-based PSQA (M-PSQA) performed at Osaka-HIMAK as clinical routine is described.
The planned dose distribution is converted to a physical dose distribution in water using VQA. The isocenter is set at a depth of 150 mm from the surface of the water phantom. Two-dimensional dose distributions are prepared at specific depths for analysis. For prostate cases, one depth on the proximal side within the target region is selected. For other cases, two depths at the proximal and distal sides are selected. Both depths lie within the coverage of the spread-out Bragg peak (SOBP). Measurements are performed using a two-dimensional ionization chamber array, OCTAVIUS 1500 XDR (PTW, Freiburg, Germany), which is mounted on an adjustable-thickness water tank AVWP09 (Accelerator Engineering Corporation, Chiba, Japan). This setup is similar to that reported in a previous study (6). The dimensions of the individual plane-parallel ion chamber in the OCTAVIUS 1500 XDR are 4.4 mm×4.4 mm×3 mm. The diagonal center-to-center spacing between the chambers measures 7.1 mm. A two-dimensional gamma index analysis (16) is conducted using VeriSoft (PTW), with a dose threshold for the analysis area set at 10% of the maximum dose. The gamma analysis criteria for dose difference to local dose and distance to agreement are set at 3%-3 mm, and the pass line is set at 90%.
Calculation of physical dose in the water phantom and its verification. Let dε(x⃗, s⃗ ) denote a three-dimensional pencil beam physical dose distribution in the water phantom per MU, where x⃗ indicates the calculation point, s⃗ denotes the spot position in the isocenter plane, and ε represents the nominal energy. The position s⃗=0 represents the isocenter. In this study, a dataset of dε(x⃗, s⃗ = 0) was prepared using the MC software PTSim (17,18) (v104) based on Geant4 toolkit (19-21) (v10.02.p03) for all 100 nominal energies available at Osaka-HIMAK (22). The isocenter was at 150 mm depth from the surface of the water phantom, similar to that set in the M-PSQA. Using this dataset, the physical dose distribution D(x⃗ ) of a treatment beam in water was calculated by the following equation: D(x⃗ ) = ∑𝑖w𝑖dε𝑖(x⃗, s⃗𝑖) , (1)
where the subscript i represents the spot in a treatment plan, and wi denotes the MU value. The calculation grid resolution was 1 mm×1 mm×1 mm. When calculating dε(x⃗, s⃗ ≠ 0), an diagonal path from the source to each spot in the isocenter plane was considered. In this specific calculation, the source was defined as the midpoint of the X and Y scanning magnets on the central axis. The calculational method of Eq.(1) using planned data for s⃗𝑖 and wi is referred to as semi-MC (SMC), and that using log data is referred to as log data-based SMC.
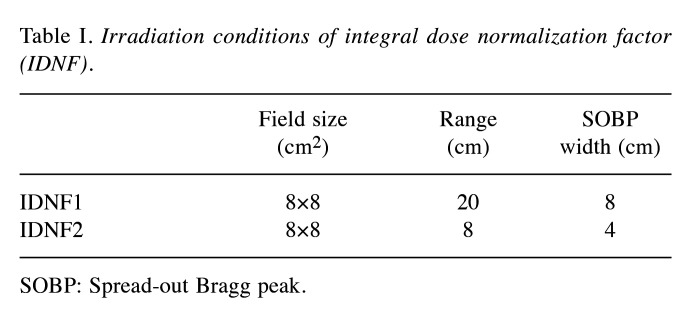
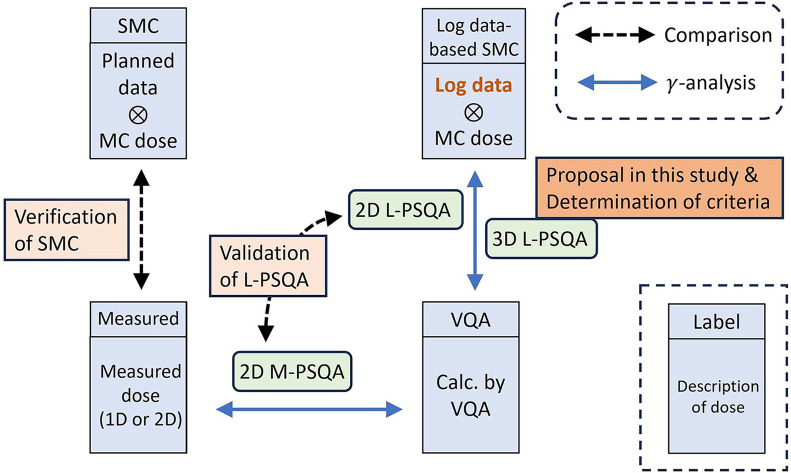
To verify SMC, the depth-dose curves obtained using SMC were compared with measured dose and those calculated by VQA. Two types of rectangular volume irradiations used for calculating the integral dose normalization factor (IDNF) (13) were considered (Table I). Furthermore, two types of clinical treatment beams made for prostate cancer and head and neck (H&N) cancer were also considered. The prostate and H&N cases were chosen as representatives due to their characteristic long-range and short-range dose distributions, respectively. The treatment plans were made by the single-field uniform dose optimization method using VQA. Dose measurements were performed using the Advanced Markus chamber (PTW) for IDNF, and the Pinpoint chamber (PTW) for clinical plans, given that the dose distribution for IDNF is uniform, whereas the clinical treatment beam may exhibit more complex dose distribution. To clarify the content of this subsection and the following two subsections, a summary is provided in Figure 2.
Table I. Irradiation conditions of integral dose normalization factor (IDNF).
SOBP: Spread-out Bragg peak.
Figure 2.
Summary of the last three subsections in Materials and Methods section. MC: Monte Carlo calculation; PSQA: Patient-specific Quality Assurance; M-PSQA: Measurement-based PSQA; SMC: Semi-MC; VQA: VQA Plan; L-PSQA: Log data-based PSQA.
Comparison between log data-based PSQA and measurement-based PSQA in two dimensions. The log data-based PSQA (L-PSQA) was performed in two dimensions following the M-PSQA procedure. The primary distinction lies in the method used to derive the delivered dose distribution: L-PSQA relies on the dose distribution generated through log data-based SMC instead of utilizing measured data. To assess the congruence between L-PSQA and M-PSQA, pass rates of a two-dimensional gamma analysis conducted using VeriSoft were compared. The scope of this comparative analysis included cases of sarcoma, prostate cancer, and H&N cancers. These cases were chosen to represent targets of varying sizes, categorized as small, medium, and large. In total, six treatment beams were analyzed, with two beams assigned to each cancer type. In this analysis, only a single depth measured in M-PSQA was considered for each beam. In addition to the 3%-3 mm criteria employed in clinical routine, the analysis was also conducted using the 3%-2 mm criteria, as recommended for photon therapy (23).
Three-dimensional log data-based PSQA. A three-dimensional gamma analysis for L-PSQA was conducted using an in-house software based on PyMedPhys (version 0.38.0) (24). The criteria for the three-dimensional L-PSQA were determined to provide pass rates comparable to those of the conventional M-PSQA. For the analysis, ten treatment beams aimed at representative cancer sites were randomly chosen. This included two beams each for prostate, H&N, pancreatic, and liver cancers, along with one beam each for lung cancer and sarcoma.
Results
Verification of the calculated physical dose in the water phantom. Figure 3 shows the depth-dose curves along the central axis for IDNF1 and IDNF2. Overall, the dose curves of SMC are consistent with those of VQA and the measured dose. In the case of the IDNF1, the differences between the SMC dose and measured dose in the SOBP region are <1%, as depicted at the bottom of Figure 3B. In the case of the IDNF2, the differences of SMC dose from the measured dose are within 3% in the SOBP region except for the distal edge.
Figure 3.
Figure 4 illustrates the depth-dose curves for a single prostate cancer case (Figure 4A) and two H&N cases (Figure 4B and C). The physical dose distribution of CIRT shows a slope in the target region, because relative biological effectiveness varies with depth. The SMC dose generally underestimates the measured dose in all cases. For the prostate and H&N1 cases, the dose curves of SMC agree with the measured dose within 3%. The dose curve for the H&N2 case is notably uneven, and the deviation reaches up to 5%. The differences in the fall-off and tail regions were not analyzed due to their low absolute values, which tend to yield large values of the differences compared to those in the target region when expressed as percentages.
Figure 4.
Comparison of depth-dose curve along the central axis for (A) prostate cancer case and (B),(C) head and neck (H&N) cases. The solid and dashed curves represent the SMC and VQA doses, respectively, and the dots indicate the measured dose. Horizontal dotted and dashed lines in the bottoms aid visualization for ±3% and ±5%, respectively. The definition of difference is the same as that in Figure 3.
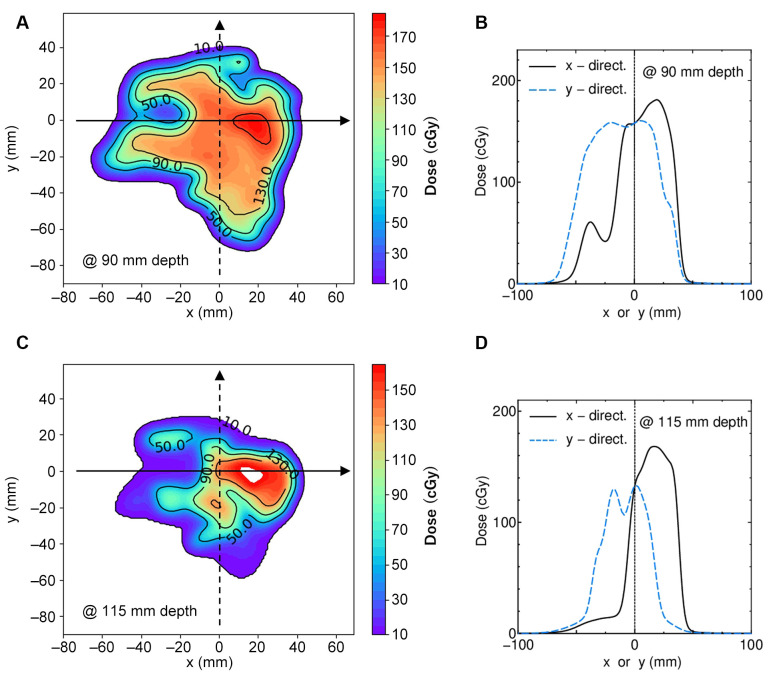
To clarify the ~5% deviation observed in Figure 4C, the dose distribution of VQA in the plane perpendicular to the beam axis at corresponding depths was investigated. Figure 5A shows the two-dimensional dose distribution at a depth of 90 mm. Figure 5B shows lateral dose curves in x- and y-directions indicated by arrows in Figure 5A. Figure 5C and D present the same data as Figure 5A and B, respectively, but at the depth of 115 mm. The measurement points shown in Figure 4 were on the central axis of the beam, where x=y=0. As shown, these points are not in a flat dose region at either depth. This suggests that even minor positional inaccuracies could cause large dose errors. Since the measured dose agrees well with the dose curves of VQA and SMC in the prostate case, where the physical dose distribution is comparatively smooth, it can be said that the 5% dose errors in the H&N2 case arise from the difficulty of measurement in a complicated dose distribution. While this issue is due to measurement error, it is important to note that calculation accuracy tends to decrease in inhomogeneous regions (14).
Figure 5.
(A) Two-dimensional dose distribution of the plane perpendicular to the beam axis at 90 mm depth in the H&N2 case. (B) Dose curves in x- and y-directions on the arrows in (A) are represented by the solid and dashed curves. (C)(D) correspond to (A)(B) but for a 115 mm depth. Measurements recorded at x=y=0.
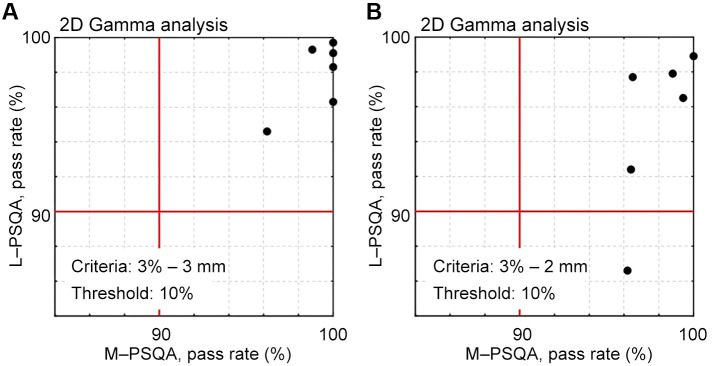
Comparison between log data-based PSQA and measurement-based PSQA in two dimensions. Figure 6 presents a scatter plot that compares the pass rates of two-dimensional gamma analysis for six treatment beams used in the verification of SMC. The acquisition of log data coincided with the measurement in M-PSQA. Figure 6A shows the results for criteria of 3%-3 mm. The gamma pass rates of L-PSQA are lower than those of M-PSQA. Results of analysis with criteria 3%-2 mm are also shown in Figure 6B. Although all beams passed in M-PSQA, one beam failed in L-PSQA.
Figure 6.
Scatter plot between the resultant pass rates of two-dimensional gamma analysis for six clinical beams. Horizontal and vertical axes represent the gamma pass rates obtained by M-PSQA and L-PSQA, respectively. Criteria: (A) 3%-3 mm and (B) 3%-2 mm; threshold: 10% in both criteria. Passing line of 90% is indicated by lines.
Three-dimensional log data-based PSQA. In CIRT, dose distribution features a characteristic tail in the beam direction as shown in Figure 4. In conventional M-PSQA, dose verification is conducted only in the target region. Furthermore, errors expressed as a percentage in the tail region tend to be large, as previously discussed in Figure 4. Therefore, it is justified to exclude the tail region from the three-dimensional gamma analysis by setting an appropriate threshold. To determine this threshold, the depth-dose curves of VQA for the prostate and H&N cases initially presented in Figure 4 are replotted in Figure 7, where the vertical axis represents the percentage of the maximum dose for each case. As depicted by the dot-dashed line in Figure 7, a 20% threshold appears to be suitable.
Figure 7.
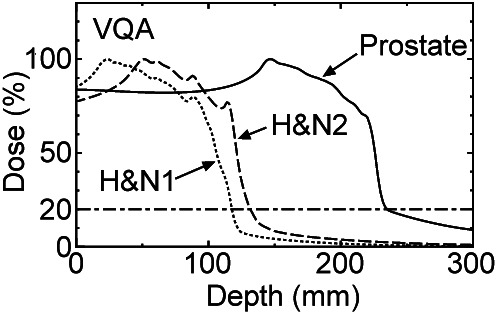
VQA percent depth-dose curves of prostate (solid), head and neck (H&N)1 (dotted) and H&N2 (dashed) cases in Figure 4. Dot-dashed line indicates 20%.
Figure 8 depicts histograms of three-dimensional L-PSQA gamma pass rates for the ten beams while changing criteria as (a) 3%-3 mm, (b) 3%-2 mm, (c) 2%-2 mm, and (d) 2%-1 mm. As determined in the previous paragraph, the threshold is set at 20%. The pass line is 90%. The analysis reveals a decline in the pass rates in the sequence of (a)–(d) as expected; all beams pass under criteria (a), one fails in (b), and multiple beams fail in both (c) and (d). Given that nine out of the ten beams passed when applying conventional M-PSQA (the remaining one beam was not analyzed by M-PSQA), it may be concluded that three-dimensional L-PSQA, employing criteria of 3%-3 mm and 3%-2 mm, exhibits capability comparable to the conventional method.
Figure 8.
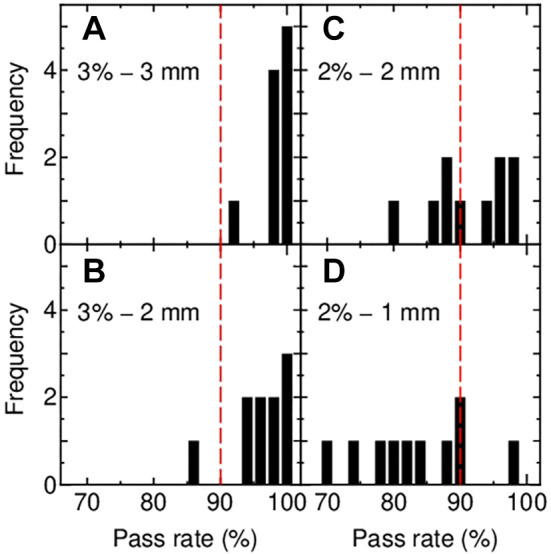
Histograms of gamma pass rate resulting from the three-dimensional gamma analysis with criteria of (A) 3%-3 mm, (B) 3%-2 mm, (C) 2%-2 mm and (D) 2%-1 mm. Threshold: 20% (Figure 7); dashed lines indicate pass line of 90%.
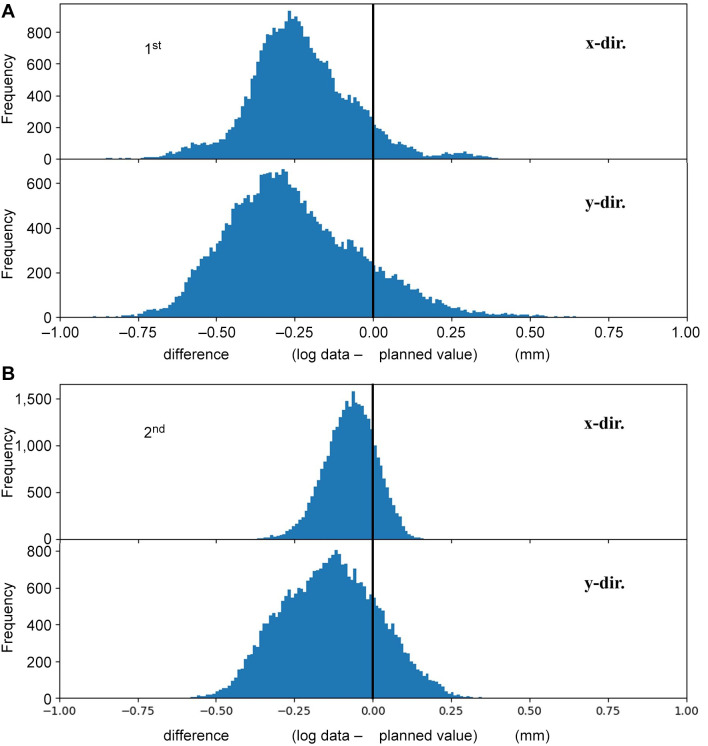
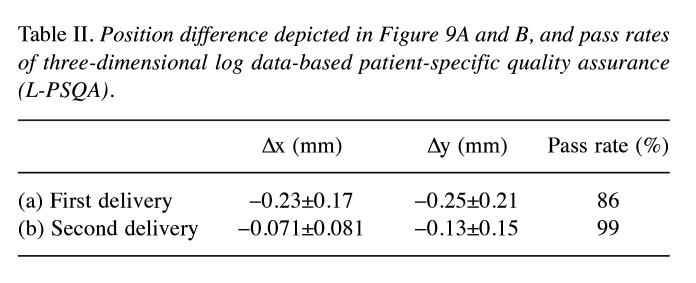
Figure 9A shows histograms depicting the spot position difference between log data and planned values in the x- (upper) and y-direction (lower) for the failed beam shown in Figure 8B. The mean value and standard deviation of the difference for the x- and y-directions is –0.23±0.17 mm and –0.25±0.21 mm, respectively. In M-PSQA, when a beam fails the QA test, re-measurement of the failed beam is commonly performed. Following the conventional procedure, the corresponding beam was delivered again to conduct L-PSQA in other day. Figure 9B shows the histograms of spot position difference of this second delivery. The peak positions for x- and y-directions are closer to zero, and the distribution widths are narrower than those of the first delivery. The values are summarized in Table II with gamma pass rates.
Figure 9.
Histogram of spot position difference between log data and planned value for x- (upper) and y-directions (lower). (A) For the failed beam depicted in Figure 8B (first delivery). (B) For log data of delivery in another day (second delivery).
Table II. Position difference depicted in Figure 9A and B, and pass rates of three-dimensional log data-based patient-specific quality assurance (L-PSQA).
Discussion
In the context of particle beam scanning therapy, where a three-dimensional dose distribution is formed by superposing pencil beams, the conventional method, which involves measuring dose distributions in multiple cross-sections using two-dimensional ionization chamber array and comparing them with treatment plans, can no longer be considered as PSQA.
At the beginning of this study, comparisons between doses of SMC, measurements and VQA were made under three conditions to validate the dose reconstruction method: H&N (representing cases with a short range), prostate (representing cases with a long range), and uniform rectangular irradiation with constant physical doses. As depicted in Figure 3 and Figure 4, overall, the findings indicated good consistency of the SMC dose with both VQA and the measured dose.
Subsequently, two-dimensional gamma analysis was conducted for the six beams actually used in treatment using both the conventional M-PSQA (measurement vs. VQA) and our developed method, L-PSQA (log data-based SMC calculation vs. VQA). The results are depicted in Figure 6, where M-PSQA consistently yielded pass rates exceeding 90% for both criteria of 3%-3 mm and 3%-2 mm. In contrast, L-PSQA identified one case as a failure in the case of criteria 3%-2 mm. This not only demonstrates the validity of L-PSQA but also highlights its capability to detect differences in dose distributions that M-PSQA may not discern. Generally, a greater number of evaluation points in gamma analysis tends to result in higher pass rates. Considering the detector spacing of OCTAVIUS 1500 XDR and the calculation grid resolution for L-PSQA, one might naturally expect L-PSQA to exhibit higher pass rates. However, the actual results were contrary. This may be due to the detector resolution being larger than the calculation resolution and, hence, some errors detected in L-PSQA could not be detected in M-PSQA.
Finally, the criteria for three-dimensional L-PSQA were established. While maintaining the previously employed pass line of a gamma pass rate exceeding 90%, three-dimensional L-PSQA using the criteria of 3%-3 mm and 3%-2 mm was found to give similar pass rates to the two-dimensional M-PSQA as depicted in Figure 8. Considering the recommendations of the AAPM TG-219 report (23), the criteria of 3%-2 mm are adopted in our facility. Price et al. reported (25) that the failure rate increased from 0% to 5% when the criteria were changed from 3%-3 mm to 3%-2mm (pass line was 90%). In our case, making a similar change in criteria resulted in an increase in the number of failed beams from 0 to 1 out of 10, while our statistical sample is insufficient. If the number of failed beams increases significantly, reconsideration of the criteria is necessary.
Our L-PSQA also analyzes the differences between the actual spot positions and the treatment plan, as illustrated in Figure 9. Figure 9A shows the differences with the plan for the failed beam, while Figure 9B demonstrates the differences when the same beam was delivered again, achieving a gamma pass rate exceeding 90%. These figures indicate that the position accuracy of the treatment machine in the second delivery is better than that in the first delivery due to a couple of factors, represented by the temperature of the magnets. Consequently, the treatment plan itself can be deemed acceptable.
After confirming the validity of L-PSQA, it has been seamlessly incorporated into our clinical practice without encountering any issues thus far. Although obtaining log files requires a single beam delivery before treatment, this process takes only a few minutes. Considering the time traditionally spent on measurements, adopting L-PSQA significantly contributes to labor reduction.
On the other hand, L-PSQA has limitations as also noted by Zhao et al. (11). It claims to perform three-dimensional dose verification but lacks the capability to verify the energy. In our facility, energy verification is conducted during daily QA sessions to ensure that the accelerator consistently delivers the intended energy. However, achieving a complete three-dimensional dose verification requires addressing the challenge of how to incorporate energy verification, and this remains a task for future development.
Our ultimate goal is to verify dose distributions by log file based MC using patient CT data as performed by Winterhalter et al. (10). Nevertheless, in the context of CIRT, the complexity of nuclear reactions significantly increases the calculation time as discussed in the Introduction. Improving computational speed is a challenge for future developments.
Conclusion
In this study, a method of dosimetric PSQA for CIRT using log data-based SMC calculation was developed. The calculation method to reconstruct the delivered dose was verified by comparison of the calculated dose curve with the measured dose. The proposed L-PSQA (log data-based SMC calculation vs. VQA) was compared with the conventional M-PSQA (measurement vs. VQA) by means of the gamma pass rate of the two-dimensional gamma analysis. The results indicated that L-PSQA might be more stringent than M-PSQA. The three-dimensional gamma analysis of L-PSQA was also conducted while changing the criteria. It was found that L-PSQA with criteria of 3%-3 mm and 3%-2 mm exhibited a capability comparable to that of conventional M-PSQA, making it appropriate for clinical application. The stricter criteria of 3%-2 mm were chosen in our facility.
Funding
JSPS KAKENHI, Grant Number JP22K07770.
Conflicts of Interest
The Authors declare that there are no conflicts of interest in relation to this study.
Authors’ Contributions
Conceptualization: MT, MY, TK; Data curation: MT; Formal analysis: MT, MY; Funding acquisition: MT; Investigation: MT, MY, YN, TN, NH, TT; Methodology: MT, MY, YN, TK; Project administration: MT, MY, TK; Resources: MT, NH, TT; Software: MT, MY, YN; Supervision: MY, TK; Validation: MT; Visualization: MT; Roles/Writing - original draft: MT; Writing - review & editing; MY, NY, NT, NH, TT, TK.
Acknowledgements
The Authors thank the staff of Osaka Heavy Ion Administration Company and HITACHI Ltd. for their help in operating accelerator. They also thank QA committee of Osaka-HIMAK for fruitful discussion on this project. This work was supported by JSPS KAKENHI Grant Number JP22K07770.
References
- 1.PTCOG. Available at: https://ptcog.site/index.php/facilities-in-operation-public. [Last accessed on August 13, 2024]
- 2.Rath AK, Sahoo N. Particle radiotherapy: Emerging technology for treatment of cancer. Springer India. 2016 doi: 10.1007/978-81-322-2622-2. [DOI] [Google Scholar]
- 3.Haberer T, Becher W, Schardt D, Kraft G. Magnetic scanning system for heavy ion therapy. Nucl Instr Meth Phys Res A. 1993;330(1-2):296–305. doi: 10.1016/0168-9002(93)91335-K. [DOI] [Google Scholar]
- 4.Furukawa T, Inaniwa T, Sato S, Shirai T, Takei Y, Takeshita E, Mizushima K, Iwata Y, Himukai T, Mori S, Fukuda S, Minohara S, Takada E, Murakami T, Noda K. Performance of the NIRS fast scanning system for heavy-ion radiotherapy. Med Phys. 2010;37(11):5672–5682. doi: 10.1118/1.3501313. [DOI] [PubMed] [Google Scholar]
- 5.Li Y, Gao Y, Liu X, Shi J, Xia J, Yang J, Mao L. The influence of beam delivery uncertainty on dose uniformity and penumbra for pencil beam scanning in carbon-ion radiotherapy. PLoS One. 2021;16(4):e0249452. doi: 10.1371/journal.pone.0249452. [DOI] [PMC free article] [PubMed] [Google Scholar]
- 6.Furukawa T, Inaniwa T, Hara Y, Mizushima K, Shirai T, Noda K. Patient-specific QA and delivery verification of scanned ion beam at NIRS-HIMAC. Med Phys. 2013;40(12):121707. doi: 10.1118/1.4828845. [DOI] [PubMed] [Google Scholar]
- 7.Karger CP, Jäkel O, Hartmann GH, Heeg P. A system for three-dimensional dosimetric verification of treatment plans in intensity-modulated radiotherapy with heavy ions. Med Phys. 1999;26(10):2125–2132. doi: 10.1118/1.598728. [DOI] [PubMed] [Google Scholar]
- 8.Johnson JE, Beltran C, Wan Chan Tseung H, Mundy DW, Kruse JJ, Whitaker TJ, Herman MG, Furutani KM. Highly efficient and sensitive patient-specific quality assurance for spot-scanned proton therapy. PLoS One. 2019;14(2):e0212412. doi: 10.1371/journal.pone.0212412. [DOI] [PMC free article] [PubMed] [Google Scholar]
- 9.Li H, Sahoo N, Poenisch F, Suzuki K, Li Y, Li X, Zhang X, Lee AK, Gillin MT, Zhu XR. Use of treatment log files in spot scanning proton therapy as part of patient-specific quality assurance. Med Phys. 2013;40(2):021703. doi: 10.1118/1.4773312. [DOI] [PMC free article] [PubMed] [Google Scholar]
- 10.Winterhalter C, Meier G, Oxley D, Weber DC, Lomax AJ, Safai S. Log file based Monte Carlo calculations for proton pencil beam scanning therapy. Phys Med Biol. 2019;64(3):035014. doi: 10.1088/1361-6560/aaf82d. [DOI] [PubMed] [Google Scholar]
- 11.Zhao J, Chen Z, Wu X, Xing Y, Li Y. Study of an online plan verification method and the sensitivity of plan delivery accuracy to different beam parameter errors in proton and carbon ion radiotherapy. Front Oncol. 2021;11:666141. doi: 10.3389/fonc.2021.666141. [DOI] [PMC free article] [PubMed] [Google Scholar]
- 12.Inaniwa T, Furukawa T, Kanematsu N, Mori S, Mizushima K, Sato S, Toshito T, Shirai T, Noda K. Evaluation of hybrid depth scanning for carbon-ion radiotherapy. Med Phys. 2012;39(5):2820–2825. doi: 10.1118/1.4705357. [DOI] [PubMed] [Google Scholar]
- 13.Fujitaka S, Fujii Y, Nihongi H, Nakayama S, Takashina M, Hamatani N, Tsubouchi T, Yagi M, Minami K, Ogawa K, Mizoe J, Kanai T. Physical and biological beam modeling for carbon beam scanning at Osaka Heavy Ion Therapy Center. J Appl Clin Med Phys. 2021;22(7):77–92. doi: 10.1002/acm2.13262. [DOI] [PMC free article] [PubMed] [Google Scholar]
- 14.Yagi M, Tsubouchi T, Hamatani N, Takashina M, Maruo H, Fujitaka S, Nihongi H, Ogawa K, Kanai T. Commissioning a newly developed treatment planning system, VQA Plan, for fast-raster scanning of carbon-ion beams. PLoS One. 2022;17(5):e0268087. doi: 10.1371/journal.pone.0268087. [DOI] [PMC free article] [PubMed] [Google Scholar]
- 15.Kanai T, Furusawa Y, Fukutsu K, Itsukaichi H, Eguchi-Kasai K, Ohara H. Irradiation of mixed beam and design of spread-out Bragg peak for heavy-ion radiotherapy. Rad Res. 1997;147(1):78. doi: 10.2307/3579446. [DOI] [PubMed] [Google Scholar]
- 16.Low DA, Harms WB, Mutic S, Purdy JA. A technique for the quantitative evaluation of dose distributions. Med Phys. 1998;25(5):656–661. doi: 10.1118/1.598248. [DOI] [PubMed] [Google Scholar]
- 17.Aso T, Kimura A, Kameoka S, Murakami K, Sasaki T, Yamashita T. GEANT4 based simulation framework for particle therapy system. IEEE Nucl Sci Symp Conf Rec Nucl Sci Symp IEEE. 2007;4:2564–2567. doi: 10.1109/NSSMIC.2007.4436673. [DOI] [Google Scholar]
- 18.Akagi T, Aso T, Faddegon B, Kimura A, Matsufuji N, Nishio T, Omachi C, Paganetti H, Perl J, Sasaki T, Sawkey D, SchÜmann J, Shin J, Toshito T, Yamashita T, Yoshida H. The PTSim and TOPAS projects, bringing Geant4 to the particle therapy clinic. Prog Nucl Sci Technol. 2011;2(0):912–917. doi: 10.15669/pnst.2.912. [DOI] [Google Scholar]
- 19.Agostinelli S, Allison J, Amako K, Apostolakis J, Araujo H, Arce P, Asai M, Axen D, Banerjee S, Barrand G, Behner F, Bellagamba L, Boudreau J, Broglia L, Brunengo A, Burkhardt H, Chauvie S, Chuma J, Chytracek R, Cooperman G, Cosmo G, Degtyarenko P, Dell’Acqua A, Depaola G, Dietrich D, Enami R, Feliciello A, Ferguson C, Fesefeldt H, Folger G, Foppiano F, Forti A, Garelli S, Giani S, Giannitrapani R, Gibin D, Gómez Cadenas JJ, González I, Gracia Abril G, Greeniaus G, Greiner W, Grichine V, Grossheim A, Guatelli S, Gumplinger P, Hamatsu R, Hashimoto K, Hasui H, Heikkinen A, Howard A, Ivanchenko V, Johnson A, Jones FW, Kallenbach J, Kanaya N, Kawabata M, Kawabata Y, Kawaguti M, Kelner S, Kent P, Kimura A, Kodama T, Kokoulin R, Kossov M, Kurashige H, Lamanna E, Lampén T, Lara V, Lefebure V, Lei F, Liendl M, Lockman W, Longo F, Magni S, Maire M, Medernach E, Minamimoto K, Mora de Freitas P, Morita Y, Murakami K, Nagamatu M, Nartallo R, Nieminen P, Nishimura T, Ohtsubo K, Okamura M, O’Neale S, Oohata Y, Paech K, Perl J, Pfeiffer A, Pia MG, Ranjard F, Rybin A, Sadilov S, Di Salvo E, Santin G, Sasaki T, Savvas N, Sawada Y, Scherer S, Sei S, Sirotenko V, Smith D, Starkov N, Stoecker H, Sulkimo J, Takahata M, Tanaka S, Tcherniaev E, Safai Tehrani E, Tropeano M, Truscott P, Uno H, Urban L, Urban P, Verderi M, Walkden A, Wander W, Weber H, Wellisch JP, Wenaus T, Williams DC, Wright D, Yamada T, Yoshida H, Zschiesche D. Geant4—a simulation toolkit. Nucl Instr Meth Phys Res A. 2003;506(3):250–303. doi: 10.1016/S0168-9002(03)01368-8. [DOI] [Google Scholar]
- 20.Allison J, Amako K, Apostolakis J, Araujo H, Arce Dubois P, Asai M, Barrand G, Capra R, Chauvie S, Chytracek R, Cirrone G, Cooperman G, Cosmo G, Cuttone G, Daquino G, Donszelmann M, Dressel M, Folger G, Foppiano F, Generowicz J, Grichine V, Guatelli S, Gumplinger P, Heikkinen A, Hrivnacova I, Howard A, Incerti S, Ivanchenko V, Johnson T, Jones F, Koi T, Kokoulin R, Kossov M, Kurashige H, Lara V, Larsson S, Lei F, Link O, Longo F, Maire M, Mantero A, Mascialino B, Mclaren I, Mendez Lorenzo P, Minamimoto K, Murakami K, Nieminen P, Pandola L, Parlati S, Peralta L, Perl J, Pfeiffer A, Pia M, Ribon A, Rodrigues P, Russo G, Sadilov S, Santin G, Sasaki T, Smith D, Starkov N, Tanaka S, Tcherniaev E, Tome B, Trindade A, Truscott P, Urban L, Verderi M, Walkden A, Wellisch J, Williams D, Wright D, Yoshida H. Geant4 developments and applications. IEEE Trans Nucl Sci. 2006;53(1):270–278. doi: 10.1109/TNS.2006.869826. [DOI] [Google Scholar]
- 21.Allison J, Amako K, Apostolakis J, Arce P, Asai M, Aso T, Bagli E, Bagulya A, Banerjee S, Barrand G, Beck B, Bogdanov A, Brandt D, Brown J, Burkhardt H, Canal P, Cano-Ott D, Chauvie S, Cho K, Cirrone G, Cooperman G, Cortés-Giraldo M, Cosmo G, Cuttone G, Depaola G, Desorgher L, Dong X, Dotti A, Elvira V, Folger G, Francis Z, Galoyan A, Garnier L, Gayer M, Genser K, Grichine V, Guatelli S, Guèye P, Gumplinger P, Howard A, Hřivnáčová I, Hwang S, Incerti S, Ivanchenko A, Ivanchenko V, Jones F, Jun S, Kaitaniemi P, Karakatsanis N, Karamitros M, Kelsey M, Kimura A, Koi T, Kurashige H, Lechner A, Lee S, Longo F, Maire M, Mancusi D, Mantero A, Mendoza E, Morgan B, Murakami K, Nikitina T, Pandola L, Paprocki P, Perl J, Petrović I, Pia M, Pokorski W, Quesada J, Raine M, Reis M, Ribon A, Ristić Fira A, Romano F, Russo G, Santin G, Sasaki T, Sawkey D, Shin J, Strakovsky I, Taborda A, Tanaka S, Tomé B, Toshito T, Tran H, Truscott P, Urban L, Uzhinsky V, Verbeke J, Verderi M, Wendt B, Wenzel H, Wright D, Wright D, Yamashita T, Yarba J, Yoshida H. Recent developments in Geant4. Nucl Instr Meth Phys Res A. 2016;835:186–225. doi: 10.1016/j.nima.2016.06.125. [DOI] [Google Scholar]
- 22.Nakaji T, Kanai T, Takashina M, Matsumura A, Osaki K, Yagi M, Tsubouchi T, Hamatani N, Ogawa K. Clinical dose assessment for scanned carbon-ion radiotherapy using linear energy transfer measurements and Monte Carlo simulations. Phys Med Biol. 2022;67(24):245021. doi: 10.1088/1361-6560/aca003. [DOI] [PubMed] [Google Scholar]
- 23.Zhu TC, Stathakis S, Clark JR, Feng W, Georg D, Holmes SM, Kry SF, Ma CC, Miften M, Mihailidis D, Moran JM, Papanikolaou N, Poppe B, Xiao Y. Report of AAPM Task Group 219 on independent calculation-based dose/MU verification for IMRT. Med Phys. 2021;48(10):e808–e829. doi: 10.1002/mp.15069. [DOI] [PubMed] [Google Scholar]
- 24.Biggs S, Jennings M, Swerdloff S, Chlap P, Lane D, Rembish J, McAloney J, King P, Ayala R, Guan F, Lambri N, Crewson C, Sobolewski M. PyMedPhys: A community effort to develop an open, Python-based standard library for medical physics applications. J Open Source Software. 2022;7(78):4555. doi: 10.21105/joss.04555. [DOI] [Google Scholar]
- 25.Price RA Jr, Veltchev I, Lin T, Eldib A, Chen L, Jin L, Chen X, Liu J, Wang L, Ma CC. Evaluating suggested stricter gamma criteria for linac-based patient-specific delivery QA in the conventional and SBRT environments. Physica Medica. 2022;100:72–80. doi: 10.1016/j.ejmp.2022.06.005. [DOI] [PubMed] [Google Scholar]


