

Abstract
The EkoSonic™ Endovascular System has been cleared by the United States Food and Drug Administration to accelerate thrombolysis to treat peripheral arterial occlusion, deep vein thrombosis, or pulmonary embolism. The objective of this study was to explore whether this catheter technology could sustain cavitation nucleated by infused Definity®, to support subsequent studies of ultrasound-mediated drug delivery to diseased arteries. The concentration and attenuation spectroscopy of Definity® were assayed before and after infusion at 0.3, 2.0, and 4.0 mL/min through the EkoSonic™ catheter. Passive cavitation imaging was used to map and quantify stable and inertial cavitation as a function of Definity® concentration in a flow phantom mimicking the porcine femoral artery. The 2.0 mL/min infusion rate yielded the highest surviving Definity® concentration and acoustic attenuation. Cavitation was sustained throughout each 15 ms ultrasound pulse, as well as throughout the 3 min infusion. These results demonstrate a potential pathway to use cavitation nucleation to promote drug delivery with the EkoSonic™ Endovascular System.
Keywords: drug delivery, intravascular ultrasound, theragnostic ultrasound, catheter delivery of Definity, cavitation nucleation
INTRODUCTION
Therapeutic ultrasound (US) has been explored recently for several applications including drug delivery and thrombolysis (Dimcevski et al. 2016; Goyal et al. 2017; Shekhar et al. 2019a; Kooiman et al. 2020). However, challenges can arise if the vessels in the heart are the therapeutic target. For the treatment of coronary artery disease, extracorporeal US applications are hampered by cardiac and respiratory movement (Greillier et al. 2018). An alternative approach takes advantage of existing expertise in minimally invasive endovascular access, which is performed routinely in the clinic for a wide range of interventions, notably for the management of occlusive and thrombotic diseases (Sharafuddin et al. 2003; Sousa-Uva et al. 2019). Intravascular US imaging is well established for coronary applications (Yock et al. 1989; Shlofmitz et al. 2019). An endovascular approach is desirable because the US field is aligned with the vascular pathology during cardiac and respiratory motion (Nissen and Yock 2001; Nair et al. 2002). Vascular access provides opportunities for innovative minimally invasive applications of therapeutic US in cardiovascular diseases.
The feasibility of catheter-based US-enhanced thrombolysis was first explored in the 1990s (Tachibana 1992; Tachibana and Tachibana 1997). Corporate development of this approach resulted in clearance by the United States Food and Drug Administration (FDA) of the EkoSonic™ Endovascular System (EKOS Corporation – Boston Scientific, Natick, MA, USA) for US-mediated, catheter-directed drug infusion, including a thrombolytic, into the peripheral vasculature, deep veins, or pulmonary artery. This technology has been used to treat peripheral arterial disease (Goldstein and Mishkel 2011; Marmagkiolis et al. 2014; Saab and Mustapha 2019; Mustapha et al.), deep vein thrombosis (Dumantepe et al. 2013; Engelberger et al. 2014; Engelberger et al. 2015; Zaghlool et al. 2016; Shi et al. 2018), notably to reduce post-thrombotic syndrome (Kahn 2008), and pulmonary embolism (Lin et al. 2009; Piazza et al. 2015; Garcia 2015; Tapson et al. 2018). The EkoSonic™ Endovascular System was designed to deliver a lytic intravascularly to a thrombus, and to enhance lytic efficacy using mechanical effects (Soltani et al. 2008; Garcia 2015). The US drive parameters were designed to enhance mixing without nucleating cavitation (Apfel 1970; Soltani et al. 2008), and nucleation agents such as echocontrast agents were not co-administered.
US contrast agents and echogenic liposomes, consisting of microbubbles stabilized against dissolution by a lipid monolayer or bilayer shell, respectively, have been investigated to enhance drug diffusion via cavitation (Husseini et al. 2005; Coussios and Roy 2008; Wu and Nyborg 2008; Britton et al. 2010; Arvanitis et al. 2011; Sutton et al. 2013; Sutton et al. 2014; Kee et al. 2019; Kooiman et al. 2020). The encapsulated microbubbles serve as cavitation nucleation agents when exposed to US above a certain peak rarefactional pressure amplitude threshold (Tachibana and Tachibana 1995; Datta et al. 2008; Radhakrishnan et al. 2013; Bader and Holland 2013; Gruber et al. 2014). Moreover, cavitation can be triggered and maintained based on the insonation and contrast agent infusion parameters (Goertz et al. 2010; Hitchcock et al. 2011; Bader and Holland 2013; Gruber et al. 2014).
Definity® (Luminity in Europe) is a commercial, FDA-approved, echocontrast agent that has also been used in preclinical and clinical therapeutic US studies (Appis et al. 2015; Mathias et al. 2019; Istvanic et al. 2020). Guidelines (Sidhu et al. 2018) for contrast-enhanced diagnostic US suggest following the manufacturer’s instructions of withdrawing and infusing Definity® using a needle between 18 and 20 G (0.84 and 0.60 mm inner diameter, respectively). Previously, Talu et al. (2008) demonstrated that the needle size and infusion flow rate (from 0.6 mL/min to 30 mL/min) affected the population of custom-made lipid-shelled microbubbles. For a 23 G (0.34 mm inner diameter) infusion needle, the change in the microbubble population was minimal for flow rates of 18 mL/min or less. However, at least 50 % of the microbubbles were destroyed after infusion through a 30 G (0.16 mm inner diameter) needle at flow rates as low as 0.6 mL/min. Talu et al. (2008) observed a decrease in mean microbubble diameter that could be attributed either to bubble destruction or acceleration of gas diffusion out of the microbubbles. Eisenbrey et al. (2015) also observed a loss of contrast enhancement after injecting Definity® through a 24 G (0.31 mm inner diameter) needle. Similar results were obtained by Barrack and Stride (2009) using custom-made microbubbles. Browning et al. (2011) observed that Sonovue® infused through needles of decreasing sizes resulted in decreasing sonotransfection efficiency. In the light of these careful infusion studies, a gap in knowledge exists regarding the effect of Definity® infusion through the 38–46 μm diameter drug delivery holes of the EkoSonic™ Endovascular System.
The purpose of this study was to explore the infusion of Definity® through the EkoSonic™ Endovascular System to induce sustained stable cavitation for enhanced drug delivery applications. To assess changes in the microbubble population, acoustic attenuation spectroscopy, particle size, and concentration of Definity® were compared with and without infusion through the EkoSonic™ Endovascular System. Passive cavitation imaging (PCI) was used to map and quantify stable and inertial cavitation as a function of Definity® concentration in a femoral artery flow phantom. The spatiotemporal extent of cavitation nucleated from Definity® infusions by the EkoSonic™ Endovascular System was assessed.
METHODS
The feasibility of infusing Definity® through an EkoSonic™ catheter to promote cavitation nucleation was evaluated by characterizing the surviving microbubbles and spatiotemporal extent of microbubble activity in a flow phantom mimicking a porcine femoral artery over a 3 min infusion. A nominal infusion time of 3 min was chosen to be similar to pre-clinical studies testing ultrasound-mediated arterial drug delivery using the EkoSonic™ catheter (Kee et al. 2019). Specifically, experiments were performed in the flow phantom to evaluate the impact of Definity® concentration on stable and inertial cavitation. The following sections describe the Definity® infusion protocol, acoustic attenuation and size distribution measurements, PCI algorithm employed, and analysis methods used.
Definity® infusion protocol
EkoSonic™ catheters and the driving instrumentation were provided by Boston Scientific (Model 500–56112, Natick, MA, USA). Definity® was purchased from Lantheus (Billerica, MA, USA) and activated according to the manufacturer’s package insert. Each Definity® vial () was activated and used in an experiment within 12 hours. The vials were vented to a Tedlar gas sampling bag (0.5 L volume, EcnoGrab, Zefon International, Ocala, FL, USA) filled with octafluoropropane gas at 1 atm. Definity® was withdrawn from the vial using a 19 G needle connected to a 100 μL gas tight syringe (Model F-LL-GT, SGE Analytical Science, Austin, TX, USA), transferred to a 10 mL syringe (Becton Dickinson, Franklin Lakes, NJ, USA) containing aliquots of air-saturated phosphate buffered saline (PBS, MilliporeSigma, Saint-Louis, MO, USA) to achieve a desired microbubble concentration. Diluted Definity® was infused through the drug delivery holes of an EkoSonic™ catheter with a Legato 180 syringe pump (KD Scientific, Holliston, MA, USA). Prior to each infusion, an EkoSonic™ catheter was primed with air-saturated PBS. The effluent was either collected for attenuation and size measurements or infused into the flow phantom for cavitation measurements.
A DPM-2001 digital pressure meter (BC Biomedical, Saint Louis, MO, USA) was connected to the syringe pump and the EkoSonic™ catheter using a three-way stopcock to measure the hydrodynamic pressure over a range of infusion rates: 0.3, 2.0, or 4.0 mL/min for a fixed Definity® concentration of . This concentration was chosen from sonothrombolysis studies nucleated from flowing Definity® which enhanced rt-PA lysis (Bader et al. 2015b; Bader et al. 2019). The lowest infusion rate represents a 0.9 mL total volume of diluted Definity over a 3 min infusion. An infusion rate of 4.0 mL/min was the highest rate that did not cause total loss of attenuation of the Definity® due to hydrodynamic overpressure in the catheter. The total volume of diluted Definity® used in each experiment was adjusted to account for the dead volume of the catheter, 1 mL. The maximum hydrodynamic pressure reached during 3 min infusions was recorded and used subsequently to correlate the loss of attenuation with the loss of Definity® (retention or destruction) for each infusion rate, as well as to determine when the catheter was cleaned adequately between runs. Note that EkoSonic™ catheters are designed for single clinical use, but were reused in these in vitro experiments.
Acoustic attenuation spectroscopy
An acoustic attenuation spectroscopy system (Figure 1) was used to characterize the attenuation of Definity® from 2 to 25 MHz, corresponding to the −20 dB bandwidth of the system, after infusion through an EkoSonic™ catheter. The setup was based on that used by Raymond et al (2014). The catheter was inserted in a 10 mL pipet tip which acted as a funnel and placed in a 50 mL centrifuge tube to collect the infused Definity® as described above at three flow rates (0.3, 2.0, and 4.0 mL/min). A 5 mg/mL bovine serum albumin (BSA) (MilliporeSigma) solution was maintained at 37°C with an oxygen saturation of 100 ± 2%.9.0 mL of BSA solution and 1.0 mL of the effluent from the Definity® infusion were pipetted into a clean reservoir (Figure 1) immediately after the end of the infusion. The final concentration in the measurement reservoir was compared to the in-vial concentration of Definity®, (or a 1:2000 v/v dilution). Samples flowed to a sample chamber (CLINIcell, Mabio, Tourcoing, France) by gravity for measurement. Approximately 30 seconds elapsed between the end of the infusion and the attenuation and size measurements. Control measurements were obtained at the same concentration without infusing the Definity® through the EkoSonic™ catheter (direct measurements). The frequency-dependent attenuation coefficient, in decibels per centimeter (dB/cm), was determined using a broadband substitution technique (Raymond et al. 2014).
Figure 1:

Schematic of the acoustic attenuation spectroscopy system. Definity® was infused via a syringe pump into an infusion reservoir, and transferred to the measurement reservoir at a concentration of . The sample flowed from the measurement reservoir to the sample chamber by gravity. A pair of broadband polyvinylidene fluoride transducers was employed to transmit and receive a broadband pulse through the sample chamber. Attenuation data were acquired using an oscilloscope connected to computer. GPIB = general purpose interface bus.
Size distribution measurements
A Multisizer 4 Coulter Counter particle counting system (Beckman Coulter, Indianapolis, IN, USA) with a 30 μm aperture was used to measure the size distribution of Definity® before and after infusion through the EkoSonic™ catheter at three flow rates: 0.3, 2.0, and 4.0 mL/min. Aliquots of Definity® before or after catheter infusion, were serially diluted in PBS at 25°C to a 1:20,000 v/v dilution (corresponding to ). Previous work showed no difference in Definity® size distribution measured at 25°C or 37°C (Shekhar et al. 2018). The particle size distributions were measured between 0.6 and 18 μm in diameter. However, due to low number counts in bins larger than 6 μm, only data between 0.6 and 6 μm were included in the analysis. Particle size distribution was also measured in PBS and subtracted from the data acquired from the diluted aliquots of Definity® infusions. The PBS particle count was less than 5 % of the total particle counts in the diluted Definity® infusions.
Femoral artery physiologic flow model
A phantom mimicking flow in the porcine femoral artery was established (Figure 2). Air-saturated PBS maintained at 37°C was pumped through latex tubing with a 6.35 mm inner diameter (0.79 mm wall thickness) (Latex-tubing, Staten Island, NY, USA) by a pulsatile pump (Model 1407, Harvard Apparatus, Holliston, MA, USA). Hydrodynamic pressure was measured in-line with a sensor (PRESS-N-025, PendoTECH, Princeton, NJ, USA). The flow rate was measured with an inline flow sensor (ME6PXN, Transonic, Ithaca, NY, USA) connected to a flow meter (TS410, Transonic). Pressure and flow data were acquired (PowerLab 8/35 acquisition board, ADInstruments, Dunedin, New Zealand) with LabChart 8 software (ADInstruments). An L11–5v linear array (Verasonics, Kirkland, WA, USA) was connected to a Vantage 256 US scanner (Verasonics) to obtain both B-mode images and acoustic emissions that were beamformed using PCI (Haworth et al. 2017).
Figure 2:
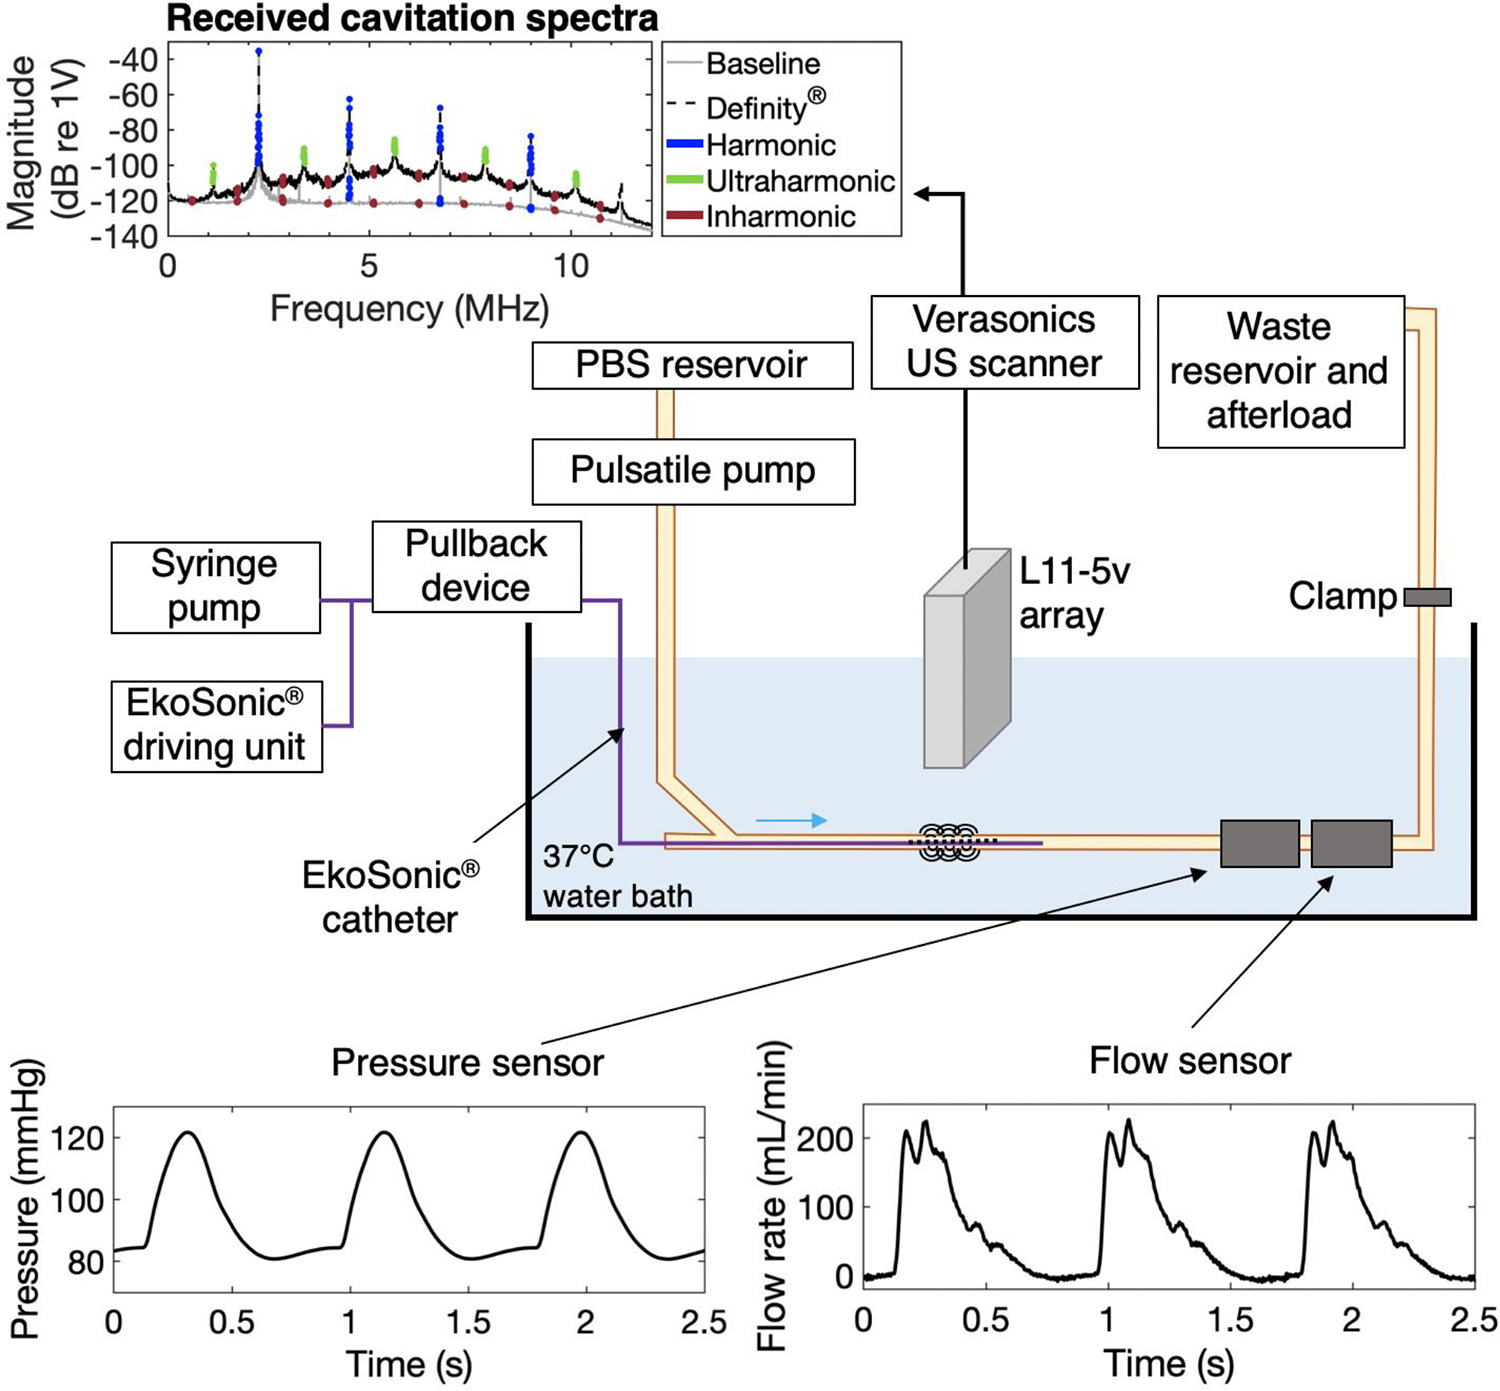
Schematic of femoral artery flow phantom for cavitation activity measurement under physiological conditions. Phosphate-buffered saline (PBS) flowed through the latex tubing using a pulsatile pump. The pump parameters (rate and volume per pulse) as well as a clamp were adjusted to obtain physiologic pressure and flow waveforms measured with a pressure meter and a flow meter. The elevated waste and afterload reservoir permitted the adjustment of the hydrostatic pressure. The EkoSonic™ catheter was inserted in the tubing through a hemostasis valve, connected to a syringe pump for Definity® infusion and the EkoSonic™ driving unit, and connected to a pullback device. The L11–5v ultrasound imaging array was placed axially above the treatment area and connected to a Verasonics research scanner for passive cavitation signal acquisition. The example spectrum shows the frequency content of received signals averaged over all 128 elements of the array with and without presence of Definity®. Harmonic, ultraharmonic, and inharmonic frequency bands processed are indicated in blue, green, and red, respectively. Note that no ultraharmonics are highlighted in the spectrum without Definity® because the magnitude of the data did not exceed 3 dB above the average of the surrounding inharmonic bands.
The linear array was positioned such that the center of the tube was at 22 mm, beyond the elevational natural focus of the array (18 mm), to provide a homogenous point spread function in the region of interest (see paragraph on cavitation energy calculation). The 5.4 F (1.8 mm diameter) EkoSonic™ catheter design includes twelve pairs of 2 mm long transducers, spaced 1 cm apart. The 38–46 μm diameter drug delivery holes are located approximately 5 mm distal from each transducer pair (Figure 3). The EkoSonic™ transducers were driven by a programmable unit provided by EKOS Corporation – Boston Scientific. The EkoSonic™ 2.25 MHz center frequency transducers were driven with 15 ms pulses at a 10 Hz pulse repetition frequency (PRF) and 9 W electrical temporal peak power, which replicated the acoustical parameters used in preclinical studies (Kee et al. 2019).
Figure 3:

Longitudinal and cross-sectional views of the EkoSonic™ catheter. The catheter consists of a central coolant lumen in which the US core is inserted, and 3 drug delivery lumens. Directivity pattern and peak rarefactional pressure field of the EkoSonic™ catheter (bold black line) generated from one pair of ultrasound core transducers in the 6-mm diameter femoral artery flow phantom tube (blue line). The thin black line and gray line denote the rarefactional acoustic pressure isolines for 0.2 MPa, and 1.0 MPa, which are the predicted rarefactional pressure thresholds for stable and inertial cavitation nucleated by Definity® at 2.25 MHz found by setting the cavitation index equal to 0.09 or 0.45, respectively (Bader and Holland 2013). Note however, that the inertial cavitation rarefactional pressure threshold measured for flowing Definity® exposed to 6.0 MHz pulsed Doppler was 0.42 MPa (Radhakrishnan et al. 2013). Robust inertial cavitation is thus expected at 1.0 MPa.
The EkoSonic™ catheter was inserted in the latex tubing through a hemostasis valve and attached to a Volcano R100 pullback device (Philips, Koninklijke, NV, USA). Using a B-Mode image of the tube, the L11–5v imaging array was aligned with the sixth EkoSonic™ transducer pair from the catheter proximal end for experiments exploring the effect of Definity® concentration on cavitation activity as well as the cavitation energy within a 15 ms pulse and during a 3 min infusion. During these experiments the pullback device was not used. For the cavitation measurements over the entire EkoSonic™ treatment zone during a 3 min infusion using the pullback device, the L11–5v imaging array was initially aligned 5 mm proximal to the first EkoSonic™ transducer pair.
Free field directivity pattern of L11–5v linear array and EkoSonic™ catheter output
While the linear array emitted 7.6 MHz center frequency B-mode pulses, the elevational plane thickness (−6 dB beam width) was measured in the free field with a 0.2 mm diameter needle hydrophone (Precision acoustics Ltd, Dorchester, UK). At depths of 15 mm to 35 mm, the plane thickness was 1.5 mm. The free-field acoustic pressure and directivity pattern of a single pair of EkoSonic™ transducers driven with 9 W pulse-average electrical power were measured with a calibrated hydrophone (HNC-1000, Onda Corp., Sunnyvale, CA, USA) in a tank filled with degassed (~20% PO2) water. The hydrophone sensitivity was determined using a custom radiation force balance system consisting of an electronic balance (Sartorius, Göttingen, Germany) and acoustic absorber (Sonic Concepts, Bothell, WA, USA), calibrated using a National Institute of Standards and Technology-traceable transducer (XDR122, Sonic Concepts, Bothell, WA, USA). The acoustic pressure output of one pair of EkoSonic™ transducers was measured azimuthally 360° around the catheter at a fixed 6.0 mm distance from the face of the transducers. The acoustic pressure was also measured radially from 0.6 mm to 56.6 mm at a single azimuthal angle over the main lobe of one transducer. A 2D field map was obtained by multiplying the azimuthal pressure measurements (around the catheter, at a distance of 6 mm) by the acoustic pressure measured radially, normalized by the pressure 6 mm from the face of the catheter (Figure 3).
Passive cavitation imaging
PCI was used to assess cavitation activity as a function of Definity® concentration. PCI was also used to monitor the spatiotemporal cavitation activity both during a single insonation pulse and throughout 3 min Definity® infusions with and without the catheter pullback device. Cavitation emissions were acquired over 15.1 ms using the L11–5v imaging array connected to a Vantage 256 US scanner with a sampling frequency of 31.25 MHz and beamformed offline on a post-processing computer (Dell Precision 5820, Round Rock, TX, USA) using MATLAB (Version 2018b, The Mathworks Inc., Natick, MA, USA). Data acquisition was triggered by the driving unit of the EkoSonic™ catheter. Acquired 15.1 ms data sets were divided into 288 μs windows, which were an integer number of acoustic periods at the insonation frequency in order to minimize spectral leakage (Mast et al. 2008). To determine the effect of Definity® concentration on cavitation activity, only 14.4 ms of the acquired non-beamformed signal was processed in order to avoid the initial (288 μs) and final (426 μs) transients. For each pulse a passive cavitation image was formed and the energy in the ultraharmonic and inharmonic bands was integrated throughout the tube lumen.
To examine the spatiotemporal cavitation activity within a single 14.4 ms processed pulse, the same acquisition and processing scheme was employed. The non-beamformed received signals were subdivided into fifty data sets of 288 μs duration and beamformed according to Eqn. 1. To examine the spatiotemporal cavitation activity over the entire 3 min infusion, data acquisition was triggered by the driving unit of the EkoSonic™ catheter. After a 288 μs delay, data sets of 1.44 ms in duration were acquired at a rate of approximately 1 Hz (limited by the Vantage 256 system data transfer rates) and subdivided into 288 μs windows. Only the second acquired 288 μs window was processed because the peak ultraharmonic energy occurred 0.6 ms after the trigger from the EkoSonic™ driving unit.
PCI was performed by independently beamforming each 288 μs data set in the Fourier domain and integrating the energy in 40 kHz bands at the harmonics (centered on the multiples of the EkoSonic™ transducers frequency, , fixed at 2.25 MHz), ultraharmonics for stable cavitation (centered on odd multiples of ), and inharmonic frequencies for inertial cavitation (centered on multiples of plus 35 kHz to avoid high order ultraharmonics) (Haworth et al. 2017). Similar to the criteria used by Kleven et al. (2019), only the ultraharmonics that were 3 dB higher than the average energy in the surrounding inharmonic bands were processed. Ultraharmonic bands and inharmonic frequencies from 0.6 to 10.7 MHz were processed. Due to the strongly nonlinear behavior of the EkoSonic™ transducers, it was determined through pilot experiments that the signal from the harmonics was mainly representative of direct source emissions and not from bubble activity. The energy of cavitation activity per frequency unit, , at each location, , and discretized frequency index, , with units of was calculated as (Haworth et al. 2017):
| (1) |
where and are the density and sound speed in the media, is the sampling frequency, is the total area of the imaging array, is the area of the element, is the discrete Fourier-domain signal in volts received on the element, is the frequency step size relating the frequency index to the frequency such that and corresponds to 31.25 MHz / 9000, and is the vector between the position and the element, . The summation was performed over the 128 elements of the L11–5v array. Images were formed by summing Eqn. 1 over the frequencies of interest:
| (2) |
The passive cavitation image pixel amplitude can be expressed as an energy density by scaling by a system calibration factor (Haworth et al. 2017), in volts per pascal, that includes diffraction and element sensitivity (Rich and Mast 2015b; Rich and Mast 2015a; Gray et al. 2018). Cavitation images were represented on a dB scale relative to . Duplex cavitation and B-mode images were created in MATLAB (v. R2018b). The background B-mode image was rendered opaque and the cavitation image pixels were rendered partially transparent by modifying the alpha channel of the red green blue alpha (RGBA) image. Alpha values for each pixel (or alpha map) ranged from 0 (totally transparent) for the lowest cavitation image pixel amplitude to 0.8 (which was applied to pixels within 20% of the maximum cavitation image pixel amplitude). Alpha maps were calculated for harmonic, ultraharmonic, and inharmonic images. Composite cavitation images were formed using ultraharmonic and inharmonic energy values in the green and red channels, respectively. The alpha maps for composite images were calculated as the sum of the alpha values for each pixel of the ultraharmonic and inharmonic images. Alpha values were capped at 0.8 so that the base B mode image was at least partially visualized, despite robust initial cavitation activity. Composite images were shown using a 2D color map displayed over a black background.
Cavitation energy calculation
Because the point spread function (PSF) of the beamformer (Eqn. 1) artifactually attributes energy to locations around the position of true sources, the total energy of the source may be incorrect. The beamformed energy is formed by convolving the true energy source distribution by the PSF of the beamformer at the position relative to the imaging array, noted . Correcting for this error via deconvolution to obtain the true energy source field is non-trivial because the PSF for passive cavitation imaging is spatially dependent (Löfdahl 2007). However, preliminary simulations were performed for point sources at pixel locations within the tube lumen (Figure 3). The spatial average of the integration of the PSFs, is defined as
| (3) |
where the sum is over the pixels within the tube lumen, , and the spatial average (angle bracket) is over the position of the point sources, , within the lumen. The integrated point spread functions varied according to by a maximum of ± 9 % at 0.6 MHz and ± 15 % at 10.7 MHz (the band over which the images were formed).
However, the errors cancel so that the spatial average of the sum of the values of the PSFs is equivalent (within 1%) to the sum of the PSF values in the center of the tube. Due to this relatively small error, the point-spread function was approximated to be independent of the source location such that equals . Furthermore, it was assumed that cavitation within the tube lumen was sufficiently spatially uniform to allow the error induced by the spatial invariance of the PSF to be neglected. Then the beamformed energy can be expressed as:
| (4) |
where is the spatial convolution operator. Applying the Fubini-Tonelli theorem to Equation 4, the total cavitation energy at a particular point in the image, can be written:
| (5) |
where and are positions vectors used for integration. Because the energy sources are micronsized bubbles that are much smaller than the wavelength, they can be considered point sources. Under this condition, the integral of the true energy field is equal to the total energy, , at frequency index, . Assuming that there is no cavitation activity outside the tube:
| (6) |
The integration of the beamformed energy is calculated over a region of interest, denoted , which includes the tube lumen plus a boundary which is sufficiently large to account for the spread of energy due to the PSF. In our experiment, these margins were 2 and 4 mm in the lateral and axial directions, respectively. The integration of the PSF is over the domain of the PSF containing 99% of the energy which is denoted .
Though was treated as a continuous variable by Haworth et al. (2017), Equation 6 must be discretized for displaying images. The discretized form of and are noted and . Discretization over the respective calculation grids for the PSF and the beamformed image yields:
| (7) |
where and are the pixel size of the beamformed image and the simulated point spread function, respectively. The pixel sizes are assumed to be significantly smaller than the −3 dB area of the PSF. The denominator of Equation 7, the sum of the amplitudes of the pixels in the point spread function, , was calculated at discrete frequencies between 0.5–12 MHz and fit to an equation of the form , where was a fitting parameter and was frequency. The fitting parameter, , was found to be Hz/m2. By replacing the denominator in Equation 7 with , the total cavitation energy, , in the tube lumen was approximated as:
| (8) |
The total cavitation energy in a pulse, , was calculated by summing obtained for each one of the fifty 288 μs data sets comprised in the 14.4 ms acquired pulses:
| (9) |
Measurements of the total cavitation energy in air-saturated PBS (without Definity®) were performed to assess the background total cavitation energy. The amount of background total cavitation energy was the same as measurements made in degassed water (20% gas saturation), so this background is equivalent to noise in the detection system. This background energy was subtracted from the energy with Definity® present to isolate the cavitation energy.
Effect of Definity® concentration on cavitation nucleation
The effect of Definity® concentration infused through the catheter on cavitation activity was assessed for concentrations between and , corresponding to a dilution factor between 10 and 4000 (v/v) relative to the in-vial Definity® concentration. The maximum concentration in this range corresponds to the estimated number of microbubbles per milliliter for a 70 kg patient receiving a standard infusion over three minutes. The minimum of this range was determined based on pilot experiments that indicated no acoustic emissions above the PBS baseline were measured. Definity® solutions were infused at 2.0 mL/min in the physiologic flow phantom. This flow rate resulted in the highest concentration of Definity® delivered through the drug holes of the EkoSonic™ catheter. The average separation between microbubbles in the flow after dilution at the highest concentration () was approximately 67 μm, which is more than 20 times the radius (~3 μm) of a resonant bubble at 1.1 MHz, the subharmonic frequency (Bader and Holland 2012). This average separation avoids bubble to bubble interactions (Leighton 1994) and satisfies the assumption of spatially incoherent sources for the range of Definity® concentrations tested (Arvanitis et al. 2015). Cavitation activity from seven pulses acquired at 20 s intervals were recorded for each Definity® infusion. The measurements were performed in triplicate for a total of 21 pulses at each concentration. B-mode images were acquired at the end of a 3 min Definity® infusion for the and concentrations. The mean and standard deviation of the total energy computed within the beamformed region of interest, , was calculated for each infused Definity® concentration using MATLAB. The total energy (in ) was calculated according to Eqn. 9 over 14.4 ms of each pulse. The total energy was compared as a function of the Definity® concentration, , by fitting the log of the data with a four-parameter logistic function (Eqn. 10):
| (10) |
where and were determined using a least squares fit to the mean of the log of the data weighted by the log of the standard deviation at each Definity® concentration. The logistic fit was performed using the MATLAB function “fit”.
Spatiotemporal distribution of cavitation activity nucleated by Definity®
The intrapulse spatiotemporal cavitation activity was assessed for Definity® infused at 2.0 mL/min at a concentration of . Cavitation emissions nucleated by the 6th EkoSonic™ transducer pair were recorded without catheter pullback and divided into fifty 288 μs data sets. This process was repeated for seven 15 ms pulses. Fifty averaged passive cavitation images were formed by pixel-wise averaging across the seven pulses. The fifty averaged passive cavitation images were analyzed for the energy within the tube lumen as a function of time within an insonation pulse.
The ability to sustain cavitation activity without catheter pull-back throughout a 3 min infusion was also evaluated at a 2.0 mL/min infusion rate with a Definity® concentration of for the sixth EkoSonic™ transducer pair. Cavitation activity was determined via post-processing by calculating the total energy in a single 288 μs data set as described previously and according to Eqn. 7. Each 3 min infusion experiment was repeated 3 times. Data was averaged across the repetitions. Cavitation images of the stable and inertial cavitation were formed by averaging 175 beamformed images obtained during a 3 min infusion.
To evaluate the ability to sustain cavitation activity during a 3 min Definity® infusion with pull-back, the cavitation activity was measured while moving the EkoSonic™ catheter through a fixed “treatment zone” at 0.5 mm/s with the Volcano R-100 pullback device. Pullback and data acquisition were started simultaneously 20 s after initiating the infusion to allow Definity® to reach the treatment zone. This data acquisition protocol enabled the cavitation activity over each of 12 transducer pairs to be recorded. Definity® at a catheter concentration of was infused at 2.0 mL/min and insonified with the EkoSonic™ transducers driven at 9 W pulse-average electrical power. The cavitation activity was determined by calculating the total energy in each 288 μs recorded window according to Eqn. 7. The baseline ultraharmonic and inharmonic energies, determined in degassed water at 20 % oxygen saturation measured with a dissolved oxygen meter probe (DO 6+, Oakton instruments, Vernon Hills, IL, USA), were subtracting from the energy at each time point. Each experiment was repeated 3 times. The data was averaged across all repetitions.
Statistical methods
Statistical significance of differences observed in Definity® total concentration, total volume, count at the modal diameter, and acoustic attenuation was assessed using an ANOVA test with Bonferroni multiple comparison correction. In each case, the no infusion data were compared with those from the three infusion rates. The ultraharmonic and inharmonic energies recorded during infusion were tested for gaussian distribution by the nonparametric Kolmogorov-Smirnov test using the “kstest” function in MATLAB.
RESULTS
The hydrodynamic pressure inside the EkoSonic™ catheter during a 3 min infusion was measured at three flow rates: 0.3, 2.0 and 4.0 mL/min. The maximum gauge pressures inside the infusion catheter were 40, 110, and 200 kPa for the three flow rates, respectively. The pressure build-up occurred progressively during the first 30 seconds and was maintained until the end of the infusion. Figure 4 shows the (A) number- and (B) volume-weighted size distribution and the (C) frequency-dependent acoustic attenuation coefficient of Definity® without and with infusion through the EkoSonic™ catheter at 0.3, 2.0, and 4.0 mL/min. The peak concentration in the number-weighted size distribution (~1-μm diameter) dropped by 18 ± 3 % (p = 0.08), 13 ± 2 % (p = 0.16), and 37 ± 5 % (p < 0.01) for the 0.3 mL/min, 2.0 mL/min, and 4.0 mL/min infusions, respectively, relative to no infusion. The total number of microbubbles dropped by 38 ± 6 % (p < 0.01), 17 ± 2 % (p = 0.05), and 50 ± 8 % (p < 0.01) for 0.3, 2.0, and 4.0 mL/min infusions, respectively, compared to Definity® measured directly from the vial after dilution. The total volume decreased by 87 ± 35 % (p < 0.01), 48 ± 17 % (p = 0.02), and 75 ± 36 % (p < 0.01) for the 0.3 mL/min, 2.0 mL/min, and 4.0 mL/min infusions, respectively, relative to no infusion. For infusion rates of 0.3 and 4.0 mL/min, the acoustic attenuation in the 5–15 MHz frequency range dropped by 3.7 ± 0.6 (p < 0.01), and 3.3 ± 1.1 (p < 0.01) dB, respectively. For an infusion rate of 2.0 mL/min, the attenuation increased by 2.2 ± 1.4 dB (p = 0.017). At 2.1 MHz, which was the nearest frequency to the 2.25 MHz center frequency of the EkoSonic transducers, attenuation decreased by 11.8 ± 0.5 (p < 0.01), 4.2 ± 1.5 (p < 0.01), and 7.8 ± 0.7 (p < 0.01) dB for 0.3, 2.0 and 4.0 mL/min infusion rates, respectively.
Figure 4.

(A) Number-weighted and (B) volume-weighted size distributions of Definity® before and after infusion through the EkoSonic™ catheter at flow rates of 0.3, 2.0, or 4.0 mL/min. (C) Attenuation measurements of Definity® before and after infusion through the EkoSonic™ catheter at the same flow rates. Error bars represent the standard deviation of 3 measurements.
Figure 5 illustrates the beamformed total ultraharmonic (A) and inharmonic (B) energy in the lumen for Definity® infusions at concentrations between and . Both the ultraharmonic and inharmonic energy increased concomitantly with the concentration until . Both the total ultraharmonic and inharmonic energies decreased at the highest concentration. The four-parameter logistic fit of the log of the data yields the parameters presented in Table 1. Figure 5.B includes B-mode images of the tube at the end of the 3 min infusion at infused Definity concentrations of and . Echogenicity from Definity® in the lumen and the catheter were observed at , but not at .
Figure 5:

Effect of infused Definity® concentration on the (A) ultraharmonic and (B) inharmonic total cavitation energy, indicative of stable and inertial cavitation, respectively. Results are presented as the total energy in a single 14.4 ms pulse obtained in three experimental runs, calculated using Equation 9. Error bars are the standard deviation across seven pulses and three runs (n=21). The black lines are four-parameter sigmoid fits of the data, weighted by the inverse of the coefficient of variation. B-mode image inserts were acquired at the end of a 3 min infusion with infused Definity® concentrations of and .
Table 1:
Four-parameter logistic fitting parameters for the ultraharmonic and inharmonic acoustic emissions as a function of Definity® concentration. The uncertainty figures denote the 95 % confidence intervals.
| Ultraharmonic (R2=0.97) | −2.51 ± 0.98 | 2.41 ± 1.12 | −3.04 ± 2.34 | 7.03 ± 0.34 |
| Inharmonic (R2=0.98) | −0.27 ± 0.18 | −1.55 ± 0.33 | 4.05 ± 2.21 | 7.30 ± 0.14 |
Figure 6.A shows the cavitation energy in the ultraharmonic and inharmonic frequency bands as a function of time during the insonation pulse. The total energy in these bands dropped an order of magnitude over the first 3 ms and remained approximately constant for the duration of the pulse. Figure 6.B presents passive cavitation images formed using the data sets starting at 0.6, 1.7 and 11.5 ms after the pulse starts. Inharmonic emissions moved closer to the catheter over the duration of the pulse whereas ultraharmonic emissions stayed closer to the tube wall. Ultraharmonic emissions observed at 11.5 ms are located primarily within the two main acoustic output lobes of the transducer pair (Figure 3).
Figure 6:

A. Ultraharmonic and inharmonic acoustic emissions within seven 15 ms pulses at a pulse repetition frequency of 10 Hz. The concentration of Definity® infused through the catheter was . Data are represented as the mean ± standard deviation (n=7). Time points 0.6, 1.7, and 11.5 ms, are marked with gray dashed lines. The 0 ms time point corresponds to the start of the ultrasound pulse. B. Cross-sectional multiplex images of cavitation emissions obtained by passive cavitation imaging for processing windows starting at 0.6 (left column), 1.7 (middle column), and 11.5 (right column) ms; B-mode ultrasound in grayscale and passive cavitation image overlays: signal from the transducers (harmonics) in blue, stable cavitation (ultraharmonics) in green, and inertial cavitation (inharmonics) in red. The color maps represent values in dB relative to . The bottom row shows the merged inharmonic and ultraharmonic layers, highlighting the spatiotemporal dynamics of stable and inertial cavitation.
Figure 7 illustrates the energy in the ultraharmonic (A) and inharmonic (B) bands (averaged over 3 repetitions) throughout the 3-minute Definity® infusions at 2.0 mL/min. The cavitation activity began 20 seconds after infusion was initiated, consistent with the time it takes for a fluid to flow down the length of the catheter. Cavitation activity was sustained throughout the infusion period. The nonparametric Kolmogorov-Smirnov test determined that cavitation events did not follow a Gaussian distribution (p<0.01). Figure 7.C shows the beamformed images from the ultraharmonic and inharmonic bands averaged over the course of one 3-min infusion of Definity®. Ultraharmonic and inharmonic emissions appeared throughout the flow phantom tube lumen. However, inharmonic emissions appear more prominently at three out of the four acoustic output lobes of the EkoSonic™ transducer pair observed in Figure 3.
Figure 7:

(A) Stable and (B) inertial cavitation activity measured throughout Definity® infusions at 2.0 mL/min through the EkoSonic™ catheter. The concentration of Definity® infused through the catheter was . Cavitation activity measured in phosphate-buffered saline PBS only (noise) is plotted in a dashed black line. Data are represented in mean ± standard deviation (n=3). C. Passive cavitation images of the average stable (left) and inertial (right) energy acquired over the course of one 3 min infusion of Definity®.
Figure 8.A is a plot of the cavitation energy from ultraharmonic and inharmonic frequency bands during a single 3 min Definity® infusion at 2.0 mL/min with an EkoSonic™ catheter pull-back at a rate of 0.5 mm/s. The twelve peaks correspond to the twelve pairs of transducers passing in front of the imaging array. The ultraharmonic energy spread over 2.5 orders of magnitude but was sustained throughout the pull-back except for three time points when the first transducer pair passed in front of the imaging array, around the 0 s time point. The inharmonic energy varied over 2 orders of magnitude depending on the position of the EkoSonic™ transducer pairs relatively to the imaging plane, and was sustained throughout the pull-back. The ultraharmonic energy was one order of magnitude below the inharmonic energy when the first three pairs of transducers passed in front of the imaging array (around times 0, 20, and 40 s), and a factor of 5 lower at pairs number 11 and 12 (from approximately 210 s). Ultraharmonic and inharmonic had similar energies for the peaks 3 through 10. Figure 8.A shows passive cavitation images acquired when the imaging array was above the first and fourth pairs of transducers. Over the first transducer pair, inertial cavitation was nucleated inside the catheter. Over the fourth pair, both stable and inertial cavitation were nucleated within the tube lumen.
Figure 8:

A. Stable and inertial cavitation activity at a single axial image location in the flow phantom during a single 3 min infusion at 2.0 mL/min with a catheter pull-back rate of 0.5 mm/s. The concentration of Definity® infused through the catheter was . Data time points were aligned in post-processing to set the first peak at 0 s to compensate for positioning variability between experimental runs (n=3). B. Composite passive cavitation images acquired at times points when the array was above the first (Tx1) and fourth (Tx4) pairs of transducers.
DISCUSSION
This study assessed the use of the EkoSonic™ catheter to deliver Definity® and nucleate cavitation in a porcine femoral artery flow phantom. The maximum gauge pressures inside the infusion catheter during infusions at 0.3, 2.0, or 4.0 mL/min were 40, 110, or 200 kPa, respectively. As Definity® exited the catheter during the 4.0 mL/min infusion, the Bernoulli pressure drop potentially caused microbubble destruction, resulting in an overall decrease in the volume-weighted size distribution (Figure 4.A). Some of the Definity® was likely retained by the catheter inner luminal surface. The frequency dependent acoustic attenuation of non-infused Definity® was consistent with the literature (Chatterjee et al. 2005; Goertz et al. 2007; Raymond et al. 2014). Definity® infusions at 0.3 or 4.0 mL/min exhibited a marked reduction of acoustic attenuation between 2 and 15 MHz (Figure 4.B). The 2.0 mL/min Definity® infusion preserved the acoustic attenuation reduction between 2 and 15 MHz, likely due to a high number of resonant-sized particles exiting the catheter (Fig. 4A). The acoustic attenuation of Definity® above 15 MHz for all three infusion flow rates was similar to the acoustic attenuation of Definity® not infused through the catheter. This observation suggests that Definity® microbubbles with resonant frequencies above 15 MHz were less susceptible to destruction after infusion through the 38–46 μm drug delivery holes of the EkoSonic™ catheter. Talu et al. (2008), also reported size-and flow-dependent destruction of an echocontrast agent when passing through small orifices.
As shown in Figure 5, the total cavitation energy varied with Definity® concentration linearly at low concentrations, and saturated at higher concentrations. The plateau in total cavitation energy at Definity® concentrations above was likely due to shadowing from opacification along the top of the flow phantom tube, seen on B-mode US images acquired after the Definity® infusion (Figure 5.B). Liberated gas from ruptured Definity® accumulated along the top of the tube and contributed to shadowing observed at the higher concentrations. Radhakrishnan et al demonstrated loss of echogenicity from Definity® in a flow phantom exposed to Doppler pulses (2013). No gas layer was observed along the top wall of the tube in their experiment, suggesting that infusion through the EkoSonic™ catheter or long US pulses (15 ms) promoted microbubble coalescence in the present study. US-induced coalescence of echocontrast agents were notably observed by Postema et al. (2004) and Bader et al. (2015b).
Figure 6 shows the spatiotemporal appearance of stable and inertial cavitation nucleated by Definity® exposed to the EkoSonic™ catheter driven at 9 W temporal peak electrical power. Cavitation energy decreased by one order of magnitude over the first 3 ms of the 15 ms pulse for both stable and inertial cavitation activity. This observation is likely due to the progressive destruction of the microbubbles present in the pressure field during the pulse (Radhakrishnan et al. 2012; Radhakrishnan et al. 2013). Thus PCI could be used to monitor the spatiotemporal bioactive gas release from microbubbles or echogenic liposomes (Britton et al. 2010; Peng et al. 2013; Miao et al. 2018; Shekhar et al. 2019b; Lafond et al. 2019). The 18 dB dynamic range of the color map was tailored such that cavitation at the beginning and end of the pulse could be visualized. Other specific PCI applications might be improved with an adjustable dynamic range for the color map, just as the color map is tuned for color Doppler duplex images. The extension of the traditional 1D color bar to 2D color map enabled simultaneous display of spatially distributed ultraharmonic and inharmonic energy, coupled with B-mode imaging for spatial localization. Compositing two complementary image channels in a way that can be distinguished by color blind individuals is challenging because combinations of complementary colors yield white, which would obfuscate the visualization of the underlying B-mode grayscale image.
Beneficial bioeffects have been shown to depend on microbubble concentration (Peng et al. 2013; Maciulevicius et al. 2015), notably the cell-to-bubble ratio (Guzmán et al. 2003). The continuous replenishment of cavitation nuclei via catheter delivery provided sustained cavitation activity throughout the 3 min infusions (Figure 7). The cavitation energy recorded during infusions (Figure 7.A and B) did not follow a Gaussian distribution, as expected (Holland and Apfel 1990; Maxwell et al. 2013; Desjouy et al. 2015). Cavitation was also sustained while using the pullback device indicating that Definity® nucleated stable cavitation after flowing past all but the first transducer pair (Figure 8). Note that the first drug delivery lumen is 5 mm distal from the first transducer pair. As drug delivery holes are located downstream of each transducer pair, no Definity® was in the tube lumen at the location of the first transducer pair and cavitation was detected primarily within the catheter (Figure 8). To nucleate stable cavitation throughout the tube lumen, a robust infusion of Definity® was necessary. Note that both stable and inertial cavitation appear over the fourth transducer pair.
PCI has been used to provide spatial monitoring in vivo of delivery of a fluorophore as a drug mimic from echogenic liposomes (Haworth et al. 2016) and microbubbles (Choi et al. 2014). Passive cavitation images provided detailed spatial distribution of bubble activity within the flow phantom throughout the 15-ms pulse duration (Figure 6.B). Cavitation activity was detected within the tube lumen at the beginning of the pulse (see 0.6 ms image in Figure 6.B) preferentially at the location of the acoustic lobes. The cavitation energy faded over the duration of the pulse so that only a scant amount of cavitation appeared at the end of the pulse at 11.5 ms near the inner tube wall. The location of the residual cavitation along the tube wall may be due to acoustic radiation force exerted by the US field on the microbubble cloud nucleated by Definity® infused from the catheter. Radiation force toward the vascular endothelium would be beneficial for applications of enhanced drug delivery and sonothrombolysis (Bader et al. 2015a; Ebben et al. 2017; Kooiman et al. 2020). Notably, the EkoSonic™ Endovascular System enhanced the delivery of pioglitazone-loaded echogenic liposomes across the endothelium post stent deployment in a porcine arterial atherosclerosis model (Huang et al. 2009; Kee et al. 2019).
The averaged beamformed images of cavitation activity obtained over the entire course of a 3 min Definity® infusion (Figure 7.C), presented a lobular shape, similar to the pressure field shown in Figure 3. The main acoustic lobe below the EkoSonic™ catheter transducer core did not appear in the composite image likely due to acoustic shadowing by the catheter. The lobular shape and the shadowing artifact did not impact the assumption that the source distribution within the lumen was homogeneous (Equation 5). Indeed, the spatial average of the sum of the values of the PSFs within an area defined by 6 dB of the maximum cavitation emission (Figure 6.B) was within 1% of the sum of the PSF values in the center of the tube. Cavitation energy rendered outside the tube was due to a known limitation of the delay, sum, and integration beamforming technique used in this study (Haworth et al. 2015; Haworth et al. 2016).
The frequency-dependent size of the PSF can be approximated by laterally, and axially, where is the depth divided by the transducer aperture (Gyöngy and Coussios 2010). In our configuration, the PSF size ranged from 1.1 to 0.1 mm laterally, and from 4.7 to 0.3 mm radially for inharmonic frequencies between 0.6 and 10.7 MHz. More sophisticated beamforming algorithms such as Robust Capon beamforming (Coviello et al. 2015), phase coherence factor spatial filtering (Boulos et al. 2018; Salido et al. 2019), or maximum intensity projection (Jones et al. 2020) would improve the PCI resolution and the overall image legibility. Transcranial ultrafast (megahertz-rate) three-dimensional PCI has been shown to improve ablation prediction compared to temporally averaged PCI for millisecond pulsed ultrasound insonation of rabbit brain (Jones et al. 2020).
The destruction of Definity® as a function of catheter infusion flow rate was also measured at a single infused concentration (). Other Definity® concentrations were not explored, which is a limitation of the study. The flow phantom modeled femoral arterial flow and therefore did not include slow volume flow, which occurs due to vascular occlusion or high flow velocities in the neighborhood of a stenosis (Spencer 1981). Another limitation of the present work was that the sensitivity of the PCI array, such as the one presented by Gray et al. (2018), was not obtained, which would be needed to compare cavitation activity quantitatively. Quantitative measurement of absolute energy emissions can be used to monitor cavitation-mediated bioeffects spatially (Yang et al. 2019) and temporally (Arvanitis et al. 2012; Rich et al. 2018). Also, the fidelity of the detection system did not allow the observation of higher order subharmonics (e.g. one-third the fundamental) due to bubble cloud collapse (Johnston et al. 2014).
The use of PCI, presented in this study, coupled with a specific bioeffect assessment would allow the choice of acoustic parameters to be optimized to obtain the desired effect (such as drug delivery or sonothrombolysis). The acoustic output level was chosen based on preliminary experiments showing that both inertial and stable cavitation were nucleated. The acoustic energy beamformed was approximately the same for both stable and inertial cavitation at the electrical drive power used (9W). Recent publications suggest that both inertial and stable cavitation promote drug delivery: inertial cavitation opens endothelial tight junctions (Chen et al. 2011; Silvani et al. 2019; Beekers et al. 2020), and acoustic streaming caused by stable or inertial cavitation (Elder 1959; Nyborg 1982; Marmottant and Hilgenfeldt 2003; Kwan et al. 2015) increases drug transport across the endothelium (Haworth et al. 2016). In our studies, Definity® concentration had a limited impact on the type of cavitation nucleated within the 14.4 ms acoustic pulse.
Catheter-based intra-arterial drug delivery strategies have been investigated to maximize therapeutic effect on a target while limiting systemic effects. Although the EkoSonic™ catheter described in this work is used clinically primarily to promote sonothrombolysis, the same system shows potential for the emerging application of US-mediated drug delivery nucleated by an echocontrast agent. Catheter directed drug delivery is notably used in the anticancer arsenal for liver chemoembolization (Imai et al. 2014; Kim et al. 2016) and radioembolization of yttrium-90 microspheres (Rhee et al. 2005; Lewandowski et al. 2007; Salem et al. 2007). The present work indicates that Definity® could be infused through an EkoSonic™ catheter to promote bubble activity for therapeutic US applications.
CONCLUSION
Cavitation can be nucleated by Definity® and the EkoSonic™ catheter and endovascular device system, thereby opening a new horizon of drug delivery applications. In this study, we assessed the effect of Definity® infusion through the EkoSonic™ catheter, and the feasibility of cavitation nucleation in a femoral artery flow phantom. We showed that the infusion flow rate has a major impact on the Definity® size distribution and acoustic attenuation, and identified 2.0 mL/min as an infusion rate with the least impact on those parameters. Using PCI, we showed that cavitation was sustained near the transducer pairs throughout a 3-min infusion, and over the entire 12 cm treatment zone of the catheter when used in pull-back mode. These results provide a foothold and restricted parameter space for future studies using Definity® for US-mediated catheter-based therapies with the EkoSonic™ Endovascular System. This study also highlights relevant parameters that need to be studied when developing such applications with any other combination of US contrast agents and the EkoSonic™ catheter.
ACKNOWLEDGMENTS
This work was funded by the U.S. National Institutes of Health through grant R01 HL135092 to the University of Cincinnati, Boston Scientific, and University of Texas Health Science Center Houston for collaborative development of the EkoSonic™ Endovascular System for ultrasound-mediated drug delivery.
Footnotes
Publisher's Disclaimer: This is a PDF file of an unedited manuscript that has been accepted for publication. As a service to our customers we are providing this early version of the manuscript. The manuscript will undergo copyediting, typesetting, and review of the resulting proof before it is published in its final form. Please note that during the production process errors may be discovered which could affect the content, and all legal disclaimers that apply to the journal pertain.
REFERENCES
- Apfel RE. The Role of Impurities in Cavitation-Threshold Determination. J Acoust Soc Am Acoustical Society of America, 1970;48:1179–1186. [Google Scholar]
- Appis AW, Tracy MJ, Feinstein SB. Update on the safety and efficacy of commercial ultrasound contrast agents in cardiac applications. Echo Res Pract 2015;2:R55–R62. [DOI] [PMC free article] [PubMed] [Google Scholar]
- Arvanitis CD, Bazan-Peregrino M, Rifai B, Seymour LW, Coussios CC. Cavitation-enhanced extravasation for drug delivery. Ultrasound Med Biol 2011;37:1838–1852. [DOI] [PubMed] [Google Scholar]
- Arvanitis CD, Clement GT, McDannold N. Transcranial Assessment and Visualization of Acoustic Cavitation: Modeling and Experimental Validation. IEEE Trans Med Imaging 2015;34:1270–1281. [DOI] [PMC free article] [PubMed] [Google Scholar]
- Arvanitis CD, Livingstone MS, Vykhodtseva N, McDannold N. Controlled Ultrasound-Induced Blood-Brain Barrier Disruption Using Passive Acoustic Emissions Monitoring. PLoS ONE 2012;7:e45783. [DOI] [PMC free article] [PubMed] [Google Scholar]
- Bader KB, Bouchoux G, Peng T, Klegerman ME, McPherson DD, Holland CK. Thrombolytic efficacy and enzymatic activity of rt-PA-loaded echogenic liposomes. J Thromb Thrombolysis 2015a;40:144–155. [DOI] [PMC free article] [PubMed] [Google Scholar]
- Bader KB, Gruber MJ, Holland CK. Shaken and stirred: mechanisms of ultrasound-enhanced thrombolysis. Ultrasound Med Biol 2015b;41:187–196. [DOI] [PMC free article] [PubMed] [Google Scholar]
- Bader KB, Gruber MJ, Holland CK. Corrigendum to:”Shaken and Stirred: Mechanisms of Ultrasound-Enhanced Thrombolysis” in Ultrasound Med Biol 2015; 41 (1): 187–196. Ultrasound Med Biol Elsevier, 2019;45:2266. [DOI] [PubMed] [Google Scholar]
- Bader KB, Holland CK. Gauging the likelihood of stable cavitation from ultrasound contrast agents. Phys Med Biol 2013;58:127–144. [DOI] [PMC free article] [PubMed] [Google Scholar]
- Barrack T, Stride E. Microbubble Destruction During Intravenous Administration: A Preliminary Study. Ultrasound Med Biol 2009;35:515–522. [DOI] [PubMed] [Google Scholar]
- Beekers I, Vegter M, Lattwein KR, Mastik F, Beurskens R, van der Steen AFW, de Jong N, Verweij MD, Kooiman K. Opening of endothelial cell–cell contacts due to sonoporation. J Controlled Release 2020;322:426–438. [DOI] [PubMed] [Google Scholar]
- Boulos P, Varray F, Poizat A, Ramalli A, Gilles B, Bera J-C, Cachard C. Weighting the passive acoustic mapping technique with the phase coherence factor for passive ultrasound imaging of ultrasound-induced cavitation. IEEE Trans Ultrason Ferroelectr Freq Control IEEE, 2018;65:2301–2310. [DOI] [PubMed] [Google Scholar]
- Britton GL, Hyunggun K, Kee PH, Jaroslaw A, Holland CK, McPherson DD, Huang S-L. In Vivo Therapeutic Gas Delivery for Neuroprotection With Echogenic Liposomes. Circulation 2010;122:1578–1587. [DOI] [PMC free article] [PubMed] [Google Scholar]
- Browning RJ, Mulvana H, Tang M, Hajnal JV, Wells DJ, Eckersley RJ. Influence of Needle Gauge On In Vivo Ultrasound and Microbubble-Mediated Gene Transfection. Ultrasound Med Biol 2011;37:1531–1537. [DOI] [PubMed] [Google Scholar]
- Chatterjee D, Sarkar K, Jain P, Schreppler NE. On the suitability of broadband attenuation measurement for characterizing contrast microbubbles. Ultrasound Med Biol 2005;31:781–786. [DOI] [PubMed] [Google Scholar]
- Chen H, Brayman AA, Kreider W, Bailey MR, Matula TJ. Observations of Translation and Jetting of Ultrasound-Activated Microbubbles in Mesenteric Microvessels. Ultrasound Med Biol 2011;37:2139–2148. [DOI] [PMC free article] [PubMed] [Google Scholar]
- Choi JJ, Carlisle RC, Coviello C, Seymour L, Coussios C-C. Non-invasive and real-time passive acoustic mapping of ultrasound-mediated drug delivery. Phys Med Biol 2014;59:4861–4877. [DOI] [PubMed] [Google Scholar]
- Coussios CC, Roy RA. Applications of acoustics and cavitation to noninvasive therapy and drug delivery. Annu Rev Fluid Mech 2008;40:395–420. [Google Scholar]
- Coviello C, Kozick R, Choi J, Gyöngy M, Jensen C, Smith PP, Coussios C-C. Passive acoustic mapping utilizing optimal beamforming in ultrasound therapy monitoring. J Acoust Soc Am Acoustical Society of America, 2015;137:2573–2585. [DOI] [PubMed] [Google Scholar]
- Datta S, Coussios C-C, Ammi AY, Mast TD, de Courten-Myers GM, Holland CK. Ultrasound-Enhanced Thrombolysis Using Definity® as a Cavitation Nucleation Agent. Ultrasound Med Biol 2008;34:1421–1433. [DOI] [PMC free article] [PubMed] [Google Scholar]
- Desjouy C, Fouqueray M, Lo CW, Muleki Seya P, Lee JL, Bera JC, Chen WS, Inserra C. Counterbalancing the use of ultrasound contrast agents by a cavitation-regulated system. Ultrason Sonochem 2015;26:163–168. [DOI] [PubMed] [Google Scholar]
- Dimcevski G, Kotopoulis S, Bjånes T, Hoem D, Schjøtt J, Gjertsen BT, Biermann M, Molven A, Sorbye H, McCormack E, Postema M, Gilja OH. A human clinical trial using ultrasound and microbubbles to enhance gemcitabine treatment of inoperable pancreatic cancer. J Controlled Release 2016;243:172–181. [DOI] [PubMed] [Google Scholar]
- Dumantepe M, Tarhan IA, Ozler A. Treatment of chronic deep vein thrombosis using ultrasound accelerated catheter-directed thrombolysis. Eur J Vasc Endovasc Surg 2013;46:366–371. [DOI] [PubMed] [Google Scholar]
- Ebben HP, Nederhoed JH, Lely RJ, Wisselink W, Yeung K. Microbubbles and UltraSound-accelerated Thrombolysis (MUST) for peripheral arterial occlusions: protocol for a phase II single-arm trial. BMJ Open British Medical Journal Publishing Group, 2017;7:e014365. [DOI] [PMC free article] [PubMed] [Google Scholar]
- Eisenbrey JR, Daecher A, Kramer MR, Forsberg F. Effects of Needle and Catheter Size on Commercially Available Ultrasound Contrast Agents. J Ultrasound Med 2015;34:1961–1968. [DOI] [PubMed] [Google Scholar]
- Elder SA. Cavitation microstreaming. J Acoust Soc Am 1959;31:54–64. [Google Scholar]
- Engelberger RP, Fahrni J, Willenberg T, Baumann F, Spirk D, Diehm N, Do D-D, Baumgartner I, Kucher N. Fixed low-dose ultrasound-assisted catheter-directed thrombolysis followed by routine stenting of residual stenosis for acute ilio-femoral deep-vein thrombosis. Thromb Haemost 2014;111:1153–1160. [DOI] [PubMed] [Google Scholar]
- Engelberger RP, Spirk D, Willenberg T, Alatri A, Do D-D, Baumgartner I, Kucher N. Ultrasound-assisted versus conventional catheter-directed thrombolysis for acute iliofemoral deep vein thrombosis. Circ Cardiovasc Interv 2015;8:e002027. [DOI] [PubMed] [Google Scholar]
- Garcia MJ. Endovascular Management of Acute Pulmonary Embolism Using the Ultrasound-Enhanced EkoSonic System. Semin Interv Radiol 2015;32:384–387. [DOI] [PMC free article] [PubMed] [Google Scholar]
- Goertz DE, de Jong N, van der Steen AFW. Attenuation and Size Distribution Measurements of Definity™ and Manipulated Definity™ Populations. Ultrasound Med Biol 2007;33:1376–1388. [DOI] [PubMed] [Google Scholar]
- Goertz DE, Wright C, Hynynen K. Contrast agent kinetics in the rabbit brain during exposure to therapeutic ultrasound. Ultrasound Med Biol Elsevier, 2010;36:916–924. [DOI] [PMC free article] [PubMed] [Google Scholar]
- Goldstein JA, Mishkel G. Choosing the correct therapeutic option for acute limb ischemia. Interv Cardiol 2011;3:381–390. [Google Scholar]
- Goyal A, Francois TH, Tenwalde MG, Chen X, Althouse A, Villanueva FS, Pacella JJ. Inertial cavitation ultrasound with microbubbles improves reperfusion efficacy when combined with tissue plasminogen activator in an in vitro model of microvascular obstruction. Ultrasound Med Biol 2017;43:1391–1400. [DOI] [PMC free article] [PubMed] [Google Scholar]
- Gray MD, Lyka E, Coussios CC. Diffraction Effects and Compensation in Passive Acoustic Mapping. IEEE Trans Ultrason Ferroelectr Freq Control 2018;65:258–268. [DOI] [PubMed] [Google Scholar]
- Greillier P, Ankou B, Bour P, Zorgani A, Abell E, Lacoste R, Bessière F, Pernot M, Catheline S, Quesson B, Chevalier P, Lafon C. Myocardial Thermal Ablation with a Transesophageal High-Intensity Focused Ultrasound Probe: Experiments on Beating Heart Models. Ultrasound Med Biol 2018;44:2625–2636. [DOI] [PubMed] [Google Scholar]
- Gruber MJ, Bader KB, Holland CK. Cavitation thresholds of contrast agents in an in vitro human clot model exposed to 120-kHz ultrasound. J Acoust Soc Am 2014;135:646–653. [DOI] [PMC free article] [PubMed] [Google Scholar]
- Guzmán HR, McNamara AJ, Nguyen DX, Prausnitz MR. Bioeffects caused by changes in acoustic cavitation bubble density and cell concentration: a unified explanation based on cell-to-bubble ratio and blast radius. Ultrasound Med Biol 2003;29:1211–1222. [DOI] [PubMed] [Google Scholar]
- Gyöngy M, Coussios C-C. Passive spatial mapping of inertial cavitation during HIFU exposure. IEEE Trans Biomed Eng 2010;57:48–56. [DOI] [PubMed] [Google Scholar]
- Haworth KJ, Bader KB, Rich KT, Holland CK, Mast TD. Quantitative frequency-domain passive cavitation imaging. IEEE Trans Ultrason Ferroelectr Freq Control 2017;64:177–191. [DOI] [PMC free article] [PubMed] [Google Scholar]
- Haworth KJ, Raymond JL, Radhakrishnan K, Moody MR, Huang S-L, Peng T, Shekhar H, Klegerman ME, Kim H, McPherson DD, Holland CK. Trans-Stent B-Mode Ultrasound and Passive Cavitation Imaging. Ultrasound Med Biol 2016;42:518–527. [DOI] [PMC free article] [PubMed] [Google Scholar]
- Haworth KJ, Salgaonkar VA, Corregan NM, Holland CK, Mast TD. Using passive cavitation images to classify high-intensity focused ultrasound lesions. Ultrasound Med Biol 2015;41:2420–2434. [DOI] [PMC free article] [PubMed] [Google Scholar]
- Hitchcock KE, Ivancevich NM, Haworth KJ, Stamper DNC, Vela DC, Sutton JT, Pyne-Geithman GJ, Holland CK. Ultrasound-enhanced rt-PA thrombolysis in an ex vivo porcine carotid artery model. Ultrasound Med Biol 2011;37:1240–1251. [DOI] [PMC free article] [PubMed] [Google Scholar]
- Holland CK, Apfel RE. Thresholds for transient cavitation produced by pulsed ultrasound in a controlled nuclei environment. J Acoust Soc Am 1990;88:2059. [DOI] [PubMed] [Google Scholar]
- Huang S-L, Kee PH, Kim H, Moody MR, Chrzanowski SM, Macdonald RC, McPherson DD. Nitric oxide-loaded echogenic liposomes for nitric oxide delivery and inhibition of intimal hyperplasia. J Am Coll Cardiol 2009;54:652–9. [DOI] [PMC free article] [PubMed] [Google Scholar]
- Husseini GA, Diaz de la Rosa MA, Richardson ES, Christensen DA, Pitt WG. The Role of Cavitation in Acoustically Activated Drug Delivery. J Control Release Off J Control Release Soc 2005;107:253–261. [DOI] [PMC free article] [PubMed] [Google Scholar]
- Imai N, Ishigami M, Ishizu Y, Kuzuya T, Honda T, Hayashi K, Hirooka Y, Goto H. Transarterial chemoembolization for hepatocellular carcinoma: A review of techniques. World J Hepatol 2014;6:844. [DOI] [PMC free article] [PubMed] [Google Scholar]
- Istvanic F, Yu GZ, Yu FTH, Powers J, Chen X, Pacella JJ. Sonoreperfusion therapy for microvascular obstruction: A step toward clinical translation. Ultrasound Med Biol 2020;46:712–720. [DOI] [PMC free article] [PubMed] [Google Scholar]
- Johnston K, Tapia-Siles C, Gerold B, Postema M, Cochran S, Cuschieri A, Prentice P. Periodic shock-emission from acoustically driven cavitation clouds: A source of the subharmonic signal. Ultrasonics 2014;54:2151–2158. [DOI] [PubMed] [Google Scholar]
- Jones RM, McMahon D, Hynynen K. Ultrafast three-dimensional microbubble imaging in vivo predicts tissue damage volume distributions during nonthermal brain ablation. Theranostics 2020;10:7211–7230. [DOI] [PMC free article] [PubMed] [Google Scholar]
- Kahn SR. Determinants and Time Course of the Postthrombotic Syndrome after Acute Deep Venous Thrombosis. Ann Intern Med 2008;149:698. [DOI] [PubMed] [Google Scholar]
- Kee PH, Moody MR, Huang S-L, Kim H, Yin X, Peng T, Laing ST, Klegerman ME, Rahbar MH, Vela D, Genstler C, Haworth KJ, Holland CK, McPherson DD. Stabilizing Peri-Stent Restenosis Using a Novel Therapeutic Carrier. JACC Basic Transl Sci 2019;S2452302X19302694 [DOI] [PMC free article] [PubMed] [Google Scholar]
- Kim D-H, Li W, Chen J, Zhang Z, Green RM, Huang S, Larson AC. Multimodal Imaging of Nanocomposite Microspheres for Transcatheter Intra-Arterial Drug Delivery to Liver Tumors. Sci Rep 2016;6:29653. [DOI] [PMC free article] [PubMed] [Google Scholar]
- Kleven RT, Karani KB, Salido NG, Shekhar H, Haworth KJ, Mast TD, Tadesse DG, Holland CK. The effect of 220 kHz insonation scheme on rt-PA thrombolytic efficacy in vitro. Phys Med Biol 2019;64:165015. [DOI] [PMC free article] [PubMed] [Google Scholar]
- Kooiman K, Roovers S, Langeveld SA, Kleven RT, Dewitte H, O’Reilly MA, Escoffre J-M, Bouakaz A, Verweij MD, Hynynen K. Ultrasound-responsive cavitation nuclei for therapy and drug delivery. Ultrasound Med Biol 2020; [DOI] [PMC free article] [PubMed] [Google Scholar]
- Kwan JJ, Myers R, Coviello CM, Graham SM, Shah AR, Stride E, Carlisle RC, Coussios CC. Ultrasound-Propelled Nanocups for Drug Delivery. Small 2015;11:5305–5314. [DOI] [PMC free article] [PubMed] [Google Scholar]
- Lafond M, Shekhar H, Panmanee W, Collins SD, Palaniappan A, McDaniel CT, Hassett DJ, Holland CK. Bactericidal activity of lipid-shelled nitric oxide-loaded microbubbles. Front Pharmacol Frontiers Media SA, 2019;10. [DOI] [PMC free article] [PubMed] [Google Scholar]
- Leighton T. The acoustic bubble. Academic press, 1994. [cited 2014 Jul 28]. Available from: http://books.google.fr/books?hl=fr&lr=&id=tR-8SNimBuEC&oi=fnd&pg=PP1&dq=acoustic+bubble&ots=gWxtvs_kPm&sig=KKKYTzMIfqz6wuZIZ4Rr3eRm5cg [Google Scholar]
- Lewandowski RJ, Sato KT, Atassi B, Ryu RK, Nemcek AA, Kulik L, Geschwind J-F, Murthy R, Rilling W, Liu D. Radioembolization with 90 Y microspheres: angiographic and technical considerations. Cardiovasc Intervent Radiol Springer, 2007;30:571–592. [DOI] [PubMed] [Google Scholar]
- Lin PH, Annambhotla S, Bechara CF, Athamneh H, Weakley SM, Kobayashi K, Kougias P. Comparison of Percutaneous Ultrasound-Accelerated Thrombolysis Versus Catheter-Directed Thrombolysis in Patients with Acute Massive Pulmonary Embolism. Vascular 2009;17:137–147. [DOI] [PubMed] [Google Scholar]
- Löfdahl MG. Multiframe deconvolution with space-variant point-spread functions by use of inverse filtering and fast Fourier transform. Appl Opt 2007;46:4686–4693. [DOI] [PubMed] [Google Scholar]
- Maciulevicius M, Tamosiunas M, Jurkonis R, Venslauskas MS, Satkauskas S. Analysis of Metrics for Molecular Sonotransfer in Vitro. Mol Pharm 2015;12:3620–3627. [DOI] [PubMed] [Google Scholar]
- Marmagkiolis K, Lendel V, Cilingiroglu M. EKOS™ ultrasound–accelerated catheter–directed thrombolysis for acutely occluded femoro-popliteal graft. Cardiovasc Revasc Med 2014;15:43–45. [DOI] [PubMed] [Google Scholar]
- Marmottant P, Hilgenfeldt S. Controlled vesicle deformation and lysis by single oscillating bubbles. Nature 2003;423:153–156. [DOI] [PubMed] [Google Scholar]
- Mast TD, Salgaonkar VA, Karunakaran C, Besse JA, Datta S, Holland CK. Acoustic emissions during 3.1 MHz ultrasound bulk ablation in vitro. Ultrasound Med Biol Elsevier, 2008;34:1434–1448. [DOI] [PMC free article] [PubMed] [Google Scholar]
- Mathias W, Tsutsui JM, Tavares BG, Fava AM, Aguiar MOD, Borges BC, Oliveira MT, Soeiro A, Nicolau JC, Ribeiro HB, Chiang HP, Sbano JCN, Morad A, Goldsweig A, Rochitte CE, Lopes BBC, Ramirez JAF, Kalil Filho R, Porter TR. Sonothrombolysis in ST-Segment Elevation Myocardial Infarction Treated With Primary Percutaneous Coronary Intervention. J Am Coll Cardiol 2019;73:2832–2842. [DOI] [PubMed] [Google Scholar]
- Maxwell AD, Cain CA, Hall TL, Fowlkes JB, Xu Z. Probability of Cavitation for Single Ultrasound Pulses Applied to Tissues and Tissue-Mimicking Materials. Ultrasound Med Biol 2013;39:449–465. [DOI] [PMC free article] [PubMed] [Google Scholar]
- Miao Y-F, Peng T, Moody MR, Klegerman ME, Aronowski J, Grotta J, McPherson DD, Kim H, Huang S-L. Delivery of xenon-containing echogenic liposomes inhibits early brain injury following subarachnoid hemorrhage. Sci Rep 2018;8:1–12. [DOI] [PMC free article] [PubMed] [Google Scholar]
- Mustapha JA, Saab F, Diaz-Sandoval L, Sayers E. ISET Spotlight: Fully Percutaneous Femoropopliteal Bypass: First-of-its-Kind Procedure for Patients With Peripheral Artery Disease.
- Nair A, Kuban BD, Tuzcu EM, Schoenhagen P, Nissen SE, Vince DG. Coronary plaque classification with intravascular ultrasound radiofrequency data analysis. Circulation 2002;106:2200–2206. [DOI] [PubMed] [Google Scholar]
- Nissen SE, Yock P. Intravascular ultrasound: novel pathophysiological insights and current clinical applications. Circulation 2001;103:604–616. [DOI] [PubMed] [Google Scholar]
- Norton SJ, Won IJ. Time exposure acoustics. IEEE Trans Geosci Remote Sens 2000;38:1337–1343. [Google Scholar]
- Nyborg WL. Ultrasonic microstreaming and related phenomena. Br J Cancer Suppl Nature Publishing Group, 1982;5:156. [PMC free article] [PubMed] [Google Scholar]
- Peng T, Britton GL, Kim H, Cattano D, Aronowski J, Grotta J, McPherson DD, Huang S-L. Therapeutic Time Window and Dose Dependence of Xenon Delivered via Echogenic Liposomes for Neuroprotection in Stroke. CNS Neurosci Ther 2013;19:773–784. [DOI] [PMC free article] [PubMed] [Google Scholar]
- Piazza G, Hohlfelder B, Jaff MR, Ouriel K, Engelhardt TC, Sterling KM, Jones NJ, Gurley JC, Bhatheja R, Kennedy RJ, Goswami N, Natarajan K, Rundback J, Sadiq IR, Liu SK, Bhalla N, Raja ML, Weinstock BS, Cynamon J, Elmasri FF, Garcia MJ, Kumar M, Ayerdi J, Soukas P, Kuo W, Liu P-Y, Goldhaber SZ. A Prospective, Single-Arm, Multicenter Trial of Ultrasound-Facilitated, Catheter-Directed, Low-Dose Fibrinolysis for Acute Massive and Submassive Pulmonary Embolism: The SEATTLE II Study. JACC Cardiovasc Interv 2015;8:1382–1392. [DOI] [PubMed] [Google Scholar]
- Postema M, Marmottant P, Lancée CT, Hilgenfeldt S, de Jong N. Ultrasound-induced microbubble coalescence. Ultrasound Med Biol 2004;30:1337–1344. [DOI] [PubMed] [Google Scholar]
- Radhakrishnan K, Bader KB, Haworth KJ, Kopechek JA, Raymond JL, Huang S-L, McPherson DD, Holland CK. Relationship between cavitation and loss of echogenicity from ultrasound contrast agents. Phys Med Biol 2013;58:6541. [DOI] [PMC free article] [PubMed] [Google Scholar]
- Radhakrishnan K, Haworth KJ, Huang S-L, Klegerman ME, McPherson DD, Holland CK. Stability of Echogenic Liposomes as a Blood Pool Ultrasound Contrast Agent in a Physiologic Flow Phantom. Ultrasound Med Biol 2012;38:1970–1981. [DOI] [PMC free article] [PubMed] [Google Scholar]
- Raymond JL, Haworth KJ, Bader KB, Radhakrishnan K, Griffin JK, Huang S-L, McPherson DD, Holland CK. Broadband attenuation measurements of phospholipid-shelled ultrasound contrast agents. Ultrasound Med Biol 2014;40:410–421. [DOI] [PMC free article] [PubMed] [Google Scholar]
- Rhee TK, Omary RA, Gates V, Mounajjed T, Larson AC, Barakat O, Sato KT, Mulcahy M, Gordon S, Lewandowski RJ. The effect of catheter-directed CT angiography on yttrium-90 radioembolization treatment of hepatocellular carcinoma. J Vasc Interv Radiol Elsevier, 2005;16:1085–1091. [DOI] [PubMed] [Google Scholar]
- Rich KT, Holland CK, Rao MB, Mast TD. Characterization of cavitation-radiated acoustic power using diffraction correction. J Acoust Soc Am Acoustical Society of America, 2018;144:3563–3574. [DOI] [PMC free article] [PubMed] [Google Scholar]
- Rich KT, Mast TD. Methods to calibrate the absolute receive sensitivity of single-element, focused transducers. J Acoust Soc Am 2015a;138:EL193–EL198. [DOI] [PMC free article] [PubMed] [Google Scholar]
- Rich KT, Mast TD. Accuracy of a bistatic scattering substitution technique for calibration of focused receivers. J Acoust Soc Am 2015b;138:EL469–EL473. [DOI] [PMC free article] [PubMed] [Google Scholar]
- Saab F, Mustapha JA. A Tactical Approach to Arterial Access for Critical Limb Ischemia. Vasc Dis Manag 2019;16:E11–E14. [Google Scholar]
- Salem R, Lewandowski RJ, Sato KT, Atassi B, Ryu RK, Ibrahim S, Nemcek AA Jr, Omary RA, Madoff DC, Murthy R. Technical aspects of radioembolization with 90Y microspheres. Tech Vasc Interv Radiol Elsevier, 2007;10:12–29. [DOI] [PubMed] [Google Scholar]
- Salido NG, Haworth KJ, Lafond M, Genstler C, Holland CK. Frequency-domain passive cavitation imaging with circular coherence factor. Oral presentation, Internal Symposium on Therapeutic Ultrasound; 2019; [Google Scholar]
- Sharafuddin MJ, Sun S, Hoballah JJ, Youness FM, Sharp WJ, Roh B-S. Endovascular management of venous thrombotic and occlusive diseases of the lower extremities. J Vasc Interv Radiol 2003;14:405–423. [DOI] [PubMed] [Google Scholar]
- Shekhar H, Kleven RT, Peng T, Palaniappan A, Karani KB, Huang S, McPherson DD, Holland CK. In vitro characterization of sonothrombolysis and echocontrast agents to treat ischemic stroke. Sci Rep 2019a;9:1–13. [DOI] [PMC free article] [PubMed] [Google Scholar]
- Shekhar H, Palaniappan A, Peng T, Lafond M, Moody MR, Haworth KJ, Huang S, McPherson DD, Holland CK. Characterization and Imaging of Lipid-Shelled Microbubbles for Ultrasound-Triggered Release of Xenon. Neurotherapeutics 2019b;:1–13. [DOI] [PMC free article] [PubMed] [Google Scholar]
- Shekhar H, Smith NJ, Raymond JL, Holland CK. Effect of Temperature on the Size Distribution, Shell Properties, and Stability of Definity®. Ultrasound Med Biol 2018;44:434–446. [DOI] [PMC free article] [PubMed] [Google Scholar]
- Shi Y, Shi W, Chen L, Gu J. A systematic review of ultrasound-accelerated catheter-directed thrombolysis in the treatment of deep vein thrombosis. J Thromb Thrombolysis 2018;45:440–451. [DOI] [PubMed] [Google Scholar]
- Shlofmitz E, Zhu B, Khalid N. Intravascular Ultrasound (IVUS). 2019. [cited 2020 Mar 19]; Available from: /books/NBK537019/
- Sidhu PS, Cantisani V, Dietrich CF, Gilja OH, Saftoiu A, Bartels E, Bertolotto M, Calliada F, Clevert D-A, Cosgrove D, Deganello A, D’Onofrio M, Drudi FM, Freeman S, Harvey C, Jenssen C, Jung E-M, Klauser AS, Lassau N, Meloni MF, Leen E, Nicolau C, Nolsoe C, Piscaglia F, Prada F, Prosch H, Radzina M, Savelli L, Weskott H-P, Wijkstra H. The EFSUMB Guidelines and Recommendations for the Clinical Practice of Contrast-Enhanced Ultrasound (CEUS) in Non-Hepatic Applications: Update 2017 (Long Version). Ultraschall Med - Eur J Ultrasound 2018;39:e2–e44. [DOI] [PubMed] [Google Scholar]
- Silvani G, Scognamiglio C, Caprini D, Marino L, Chinappi M, Sinibaldi G, Peruzzi G, Kiani MF, Casciola CM. Reversible Cavitation-Induced Junctional Opening in an Artificial Endothelial Layer. Small 2019;15:1905375. [DOI] [PubMed] [Google Scholar]
- Soltani A, Volz KR, Hansmann DR. Effect of modulated ultrasound parameters on ultrasound-induced thrombolysis. Phys Med Biol 2008;53:6837. [DOI] [PubMed] [Google Scholar]
- Sousa-Uva M, Neumann F-J, Ahlsson A, Alfonso F, Banning AP, Benedetto U, Byrne RA, Collet J-P, Falk V, Head SJ. 2018 ESC/EACTS Guidelines on myocardial revascularization. Eur J Cardiothorac Surg Oxford University Press, 2019;55:4–90. [DOI] [PubMed] [Google Scholar]
- Spencer MP. Hemodynamics of Carotid Artery Stenosis. In: Spencer MP, Reid JM, eds. Cerebrovasc Eval Doppler Ultrasound Dordrecht: Springer Netherlands, 1981. [cited 2020 Sep 10]. pp. 113–131. Available from: 10.1007/978-94-009-8204-8_9 [DOI] [Google Scholar]
- Sutton JT, Raymond JL, Verleye MC, Pyne-Geithman GJ, Holland CK. Pulsed ultrasound enhances the delivery of nitric oxide from bubble liposomes to ex vivo porcine carotid tissue. Int J Nanomedicine 2014;9:4671. [DOI] [PMC free article] [PubMed] [Google Scholar]
- Sutton JT, Raymond JL, Verleye MC, Pyne-Geithman GJ, Rubinstein J, Holland CK. Ultrasound-mediated delivery of bioactive nanobubbles to vascular tissue. J Acoust Soc Am 2013;134:4048–4048. [Google Scholar]
- Tachibana K. Enhancement of Fibrinolysis with Ultrasound Energy. J Vasc Interv Radiol 1992;3:299–303. [DOI] [PubMed] [Google Scholar]
- Tachibana K, Tachibana S. Albumin microbubble echo-contrast material as an enhancer for ultrasound accelerated thrombolysis. Circulation 1995;92:1148–1150. [DOI] [PubMed] [Google Scholar]
- Tachibana K, Tachibana S. Prototype therapeutic ultrasound emitting catheter for accelerating thrombolysis. J Ultrasound Med 1997;16:529–535. [DOI] [PubMed] [Google Scholar]
- Talu E, Powell RL, Longo ML, Dayton PA. Needle Size and Injection Rate Impact Microbubble Contrast Agent Population. Ultrasound Med Biol 2008;34:1182–1185. [DOI] [PMC free article] [PubMed] [Google Scholar]
- Tapson VF, Sterling K, Jones N, Elder M, Tripathy U, Brower J, Maholic RL, Ross CB, Natarajan K, Fong P, Greenspon L, Tamaddon H, Piracha AR, Engelhardt T, Katopodis J, Marques V, Sharp ASP, Piazza G, Goldhaber SZ. A Randomized Trial of the Optimum Duration of Acoustic Pulse Thrombolysis Procedure in Acute Intermediate-Risk Pulmonary Embolism: The OPTALYSE PE Trial. JACC Cardiovasc Interv 2018;11:1401–1410. [DOI] [PubMed] [Google Scholar]
- Wu J, Nyborg WL. Ultrasound, cavitation bubbles and their interaction with cells. Adv Drug Deliv Rev 2008;60:1103–1116. [DOI] [PubMed] [Google Scholar]
- Yang Y, Zhang X, Ye D, Laforest R, Williamson J, Liu Y, Chen H. Cavitation dose painting for focused ultrasound-induced blood-brain barrier disruption. Sci Rep Nature Publishing Group, 2019;9:1–10. [DOI] [PMC free article] [PubMed] [Google Scholar]
- Yock PG, Linker DT, Angelsen BA. Two-dimensional intravascular ultrasound: technical development and initial clinical experience. J Am Soc Echocardiogr 1989;2:296–304. [DOI] [PubMed] [Google Scholar]
- Zaghlool DS, Franz RW, Jenkins J. EkoSonic thrombolysis as a therapeutic adjunct in venous occlusive disease. Int J Angiol 2016;25:203–209. [DOI] [PMC free article] [PubMed] [Google Scholar]