Abstract
Background
Although capsule endoscopy (CE) is a crucial tool for diagnosing small bowel diseases, the need to process a vast number of images imposes a significant workload on physicians, leading to a high risk of missed diagnoses. This study aims to develop an artificial intelligence (AI) model and application based on convolutional neural networks that can automatically recognize various lesions in small bowel capsule endoscopy.
Methods
Three small bowel capsule endoscopy datasets were used for AI model training, validation, and testing, encompassing 12 categories of images. The model’s performance was evaluated using metrics such as AUC, sensitivity, specificity, precision, accuracy, and F1 score to select the best model. A human-machine comparison experiment was conducted using the best model and endoscopists with varying levels of experience. Model interpretability was analyzed using Grad-CAM and SHAP techniques. Finally, a clinical application was developed based on the best model using PyQt5 technology.
Results
A total of 34,303 images were included in this study. The best model, MobileNetv3-large, achieved a weighted average sensitivity of 87.17%, specificity of 98.77%, and an AUC of 0.9897 across all categories. The application developed based on this model performed exceptionally well in comparison with endoscopists, achieving an accuracy of 87.17% and a processing speed of 75.04 frames per second, surpassing endoscopists of varying experience levels.
Conclusion
The AI model and application developed based on convolutional neural networks can quickly and accurately identify 12 types of small bowel lesions. With its high sensitivity, this system can effectively assist physicians in interpreting small bowel capsule endoscopy images.Future studies will validate the AI system for video evaluations and real-world clinical integration.
Supplementary Information
The online version contains supplementary material available at 10.1186/s12876-024-03482-7.
Keywords: Capsule endoscopy, Artificial intelligence, Application, Convolutional neural networks, PyQt5
Introduction
With the advancement of medical technology, capsule endoscopy (CE) has revolutionized the diagnostic approach to gastrointestinal diseases. As a non-invasive and anesthesia-free examination method, CE, known for its patient-friendly attributes and high compliance, has become the gold standard for diagnosing small intestinal diseases [1, 2]. Since its first clinical introduction in 2000, CE has proven its effectiveness for various indications, including occult bleeding, erosions, and small intestinal polyps [3]. However, one major challenge of CE is the massive amount of image data it generates, with a single examination producing up to tens of thousands of images. A single examination can produce tens of thousands of images, which puts time pressure on physicians reviewing the images and increases the risk of missed diagnoses due to reading fatigue [4].
The advent of AI technology offers new prospects for the field of capsule endoscopy (CE), presenting a promising solution to its challenges [5]. AI’s integration into gastroenterological diagnostics has already yielded significant achievements, particularly in identifying gastrointestinal lesions within traditional endoscopy [6–8]. In the image-intensive domain of CE, AI’s potential benefits are particularly pronounced. Automated image analysis through AI can enhance lesion detection and assist in the diagnostic process, alleviating physician workload and improving diagnostic efficiency and accuracy [9].
The increasing use of CE in clinical practice has led to the emergence of various CE brands. In China, popular CE brands include PillCam (Medtronic, USA), EndoCapsule (Olympus, Japan), and OMOM (Jinshan Science and Technology, China). The slight variations in color and brightness among different capsule endoscopy systems suggest that AI models developed on images from a single brand may lack universality and generalization capability [10]. Additionally, early AI research in CE mainly focused on identifying individual types of lesions, such as bleeding spots, vascular malformations, and polyps. Even though building models for these conditions is quite simple, there is still limited research on models that can automatically recognise multiple types of lesions to ensure thorough and accurate diagnosis of GI diseases. Some studies have developed AI models capable of recognizing multiple types of small bowel lesions, but the number of identifiable lesion types is limited, which constrains the application of these models in complex clinical scenarios. Clinicians relying on these models for assisted diagnosis may still need to manually identify certain lesions, potentially affecting diagnostic efficiency and accuracy [11, 12]. These models have not yet been developed into user-friendly applications with visual interfaces [13], which restricts their practical use in clinical settings.
This study employs datasets encompassing images from three CE brands, aiming to develop an AI model and application capable of identifying 12 types of small bowel lesions, thereby enhancing the comprehensiveness and accuracy of small bowel disease diagnosis.The innovation and contributions of this study are reflected in the following aspects:
This study is the first to apply convolutional neural networks to the automated recognition of multiple lesions in capsule endoscopy, covering 12 categories of lesion images.
The proposed model exhibited excellent performance on the external validation dataset, achieving an AUC of 0.9897 and a specificity of 98.77%.
This study developed an AI application based on PyQt5, which can recognize and mark lesions in capsule endoscopy videos in real-time.
By using model interpretability techniques (such as Grad-CAM), the study provides transparent decision-making support for clinicians, enhancing the trustworthiness of the AI system.
The study collected image data from multiple medical centers, which enhances the robustness and generalizability of the model.
Methods
Study design and datasets
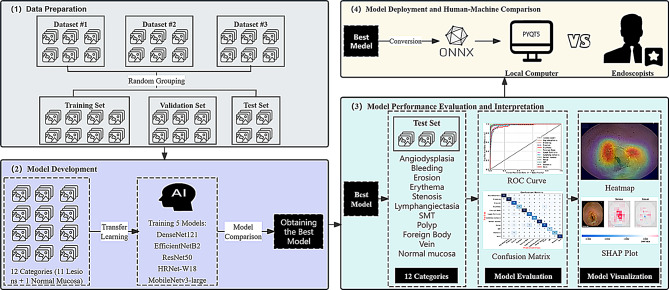
This study utilizes three datasets, totaling 34,303 images: Dataset #1 (SEE-AI), Dataset #2 (Kvasir-Capsule), and Dataset #3 (Changshu Hospital Affiliated to Soochow University). The collected images encompass 12 types of small intestinal lesions captured by CE devices from three different brands: PillCam SB3 (Medtronic, USA), EndoCapsule (Olympus, Japan), and OMOM (Jinshan Technology Co., Ltd., China). These datasets were randomly divided into a training set (n = 26,638), a validation set (n = 6,652), and a test set (n = 1,013). The images in each dataset were assumed to be independent and identically distributed, with the selected samples sufficiently representing the image variability across different CE device brands and real clinical environments. Representative annotated images are provided in Figure S1, reflecting the typical diversity of lesions and normal findings encountered in clinical practice. The SEE-AI public database [14] contains images obtained from the PillCam SB3 small bowel capsule endoscope, manufactured by Medtronic in Minneapolis, USA (https://www.kaggle.com/datasets/capsuleyolo/kyucapsule?resource=download). These images are derived from 523 small bowel capsule endoscopy videos and are accompanied by annotation files in YOLO format. The Kvasir-Capsule public database [15] contains images collected using the EndoCapsule system from Vestre Viken Hospital in Norway (https://osf.io/dv2ag/), extracted from 117 CE videos. The small bowel lesion images collected using the OMOM capsule come from Changshu First People’s Hospital, extracted from 82 videos and classified by three experienced endoscopists based on different types of small bowel lesions. The detailed research process is illustrated in Fig. 1.
Fig. 1.
The flowchart of the study
Image preprocessing
To ensure robust generalization of the model, comprehensive preprocessing and augmentation operations were performed on the image data. Specifically, we employed online data augmentation methods [16], where augmentations are applied in real-time during training without generating new image files, ensuring that the model is exposed to slightly different versions of the images with each training iteration. For the training set, random resizing and cropping to 224 × 224 pixels were first executed. To increase dataset diversity, random horizontal flipping and color jittering were applied, adjusting image brightness, contrast, saturation, and hue to better equip the model to handle varying lighting conditions. Gaussian noise was also introduced to improve the model’s robustness against noise by simulating real-world interference. Images were subsequently converted from PIL Image or numpy.ndarray formats to PyTorch Tensors and normalized to the [0, 1] range. Standardization of the RGB channels was done using the mean [0.485, 0.456, 0.406] and standard deviation [0.229, 0.224, 0.225]. For the validation set, a slightly different strategy was employed. The shorter edge of the images was first resized to 256 pixels, followed by a center crop to a 224 × 224 pixel size. The subsequent conversion and normalization steps were identical to those for the training set, using the corresponding RGB channel standardization parameters. All preprocessing and augmentation steps were implemented using PyTorch’s torchvision library.
Model training configuration
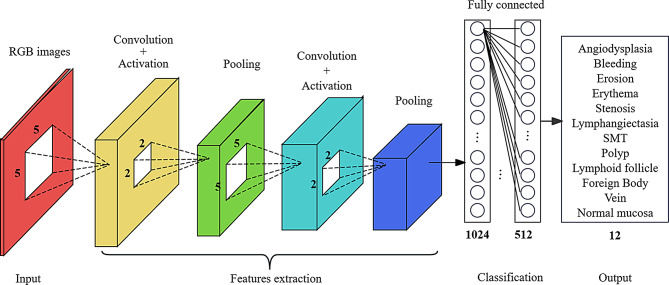
To accomplish the image classification task, pre-trained models based on convolutional neural networks (CNNs) were employed for transfer learning. The selected models include DenseNet121, EfficientNetB2, HRNet-W18, ResNet50, and MobileNetv3-large. These CNN models are composed of convolutional layers, average pooling layers, and fully connected layers with ReLU activation functions. To accommodate a 12-category dataset, two dense layers with ReLU activation functions and an output layer with a Softmax activation function for classification were added to each pre-trained model. The number of nodes in the output layer was set to 12 to match the requirements of the classification task. The model training utilized a cross-entropy loss function and the Adam optimizer, with a set duration of 35 training epochs. To prevent overfitting, an early stopping strategy was implemented, halting training if there was no improvement in validation set performance for six consecutive epochs. Additionally, a learning rate schedule was applied, halving the learning rate every five epochs. All procedures were conducted within the PyTorch framework. For details on the neural network architectures, refer to Fig. 2.
Fig. 2.
Relevant neural network architecture
Model interpretability analysis
The high computational costs, difficulties in data acquisition, and the opacity of deep learning methodologies have constrained the widespread application of computer vision within the medical domain. In response to these challenges, explainable artificial intelligence (XAI) technologies have emerged, aiming to enhance the transparency of models. This study employs Grad-CAM and SHAP interpretability techniques to analyze CNN models [17, 18], with XAI dedicated to addressing the “black box” issue inherent in deep learning, making the model’s decision-making process more comprehensible and interpretable. Grad-CAM elucidates key image regions in the model’s decision-making process by generating heatmaps, whereas SHAP assigns importance scores to each pixel for image classification tasks, clearly indicating their role in the model’s decisions. Together, these techniques significantly deepen the understanding of the automatic classification process for small intestinal lesions.
In this study, deep learning techniques were applied to the automated classification of small intestinal capsule endoscopy images, covering 12 types of lesions, including angiodysplasia, bleeding, erosion, erythema, stenosis, lymphangiectasia, SMT, polyp, lymphoid follicle, foreign body, vein, and normal mucosa. To gain insights into the semantic classification capabilities of the model, intermediate layer outputs were extracted as semantic features from the image classification model. These features were captured by registering forward hooks on the target layers. Subsequently, the t-SNE technique was applied to reduce the high-dimensional features to a two-dimensional space [19], and the plotly library was used for visual analysis of these features.
Application development
To achieve automated diagnosis of capsule endoscopy images, the best-performing CNN model was developed into a portable application using PyQt5 technology [20], allowing it to be easily used on a local computer. PyQt5, developed by Qt, is a library that integrates over 1,000 Qt components into Python modules, supporting efficient development of Qt applications using the Python language. The process involved the following steps: first, the best model was identified through a performance comparison based on multiple metrics. Next, the model developed in the PyTorch framework was converted to the ONNX (Open Neural Network Exchange) format, an open standard designed to ensure model interoperability across different deep learning frameworks and enhance deployment flexibility. Finally, a user-friendly application with a graphical user interface (GUI) was developed using PyQt5, enabling clinical staff to operate the application without needing programming knowledge.
Human-machine comparison
In the human-machine comparison experiment conducted at the Digestive Endoscopy Center of Changshu Hospital Affiliated to Soochow University, two senior endoscopists with more than five years of image-reading experience and two junior endoscopists with less than three years of experience independently assessed a test set of images (n = 1013). Subsequently, the assessments of these endoscopists were compared with the image-reading results of the model. The analysis included a comparison of the accuracy and speed of diagnosis among five different Convolutional Neural Network (CNN) models and the endoscopists of varying experience levels.
Experimental platform and evaluation metrics
This study utilized a computer equipped with an RTX 3090 GPU (25.4GB VRAM), a 5×E5-2680 v4 CPU, and 350GB of hard drive space. The deep learning models were built and trained using PyTorch, with image data processed through OpenCV. Data organization, analysis, and visualization were conducted using Pandas, NumPy, Matplotlib, and Plotly. Model saving and loading were managed using H5py.
This study employs a diverse set of evaluation metrics to comprehensively assess the performance of CE image classification models. The evaluation metrics include the Area Under the Receiver Operating Characteristic Curve (AUC), Sensitivity, Specificity, Precision, Accuracy, F1 Score, Macro Average, and Weighted Average. The calculation formulas are shown in Eq. (1) to (8).
Sensitivity or True Positive Rate (TPR):
 . The proportion of actual positive samples that the model correctly predicts as positive. It measures the model’s sensitivity in detecting a particular class, making it suitable for scenarios where missing important lesions is undesirable.
Specificity or True Negative Rate (TNR):
 . The proportion of actual normal images that the model correctly predicts as normal. It reflects the model’s ability to exclude non-pathological cases, making it suitable for reducing misdiagnosis.
Precision or Positive Predictive Value (PPV):
 . The proportion of actual positives among the samples predicted as positive by the model. It measures the model’s accuracy when predicting a certain class, making it suitable for scenarios where the issue of false positives is of particular concern.
 . It refers to the proportion of correctly classified samples, measuring the overall accuracy of the model.
F1 Score
 . The harmonic mean of precision and recall. It strikes a balance between precision and recall, making it ideal for scenarios where a trade-off between false positives and missed detections is required.
AUC: Area Under the Receiver Operating Characteristic Curve, measures the model’s performance across different thresholds. It is particularly well-suited for assessing the model’s effectiveness in scenarios with class imbalances.
Macro Average:
 . It involves calculating the metric for each class (such as accuracy, recall, etc.) separately, and then taking the arithmetic mean of these metrics across all classes, without considering differences in class sample sizes.
Weighted Average:
 . The metric for each class is calculated using a weighted average, with the weight determined by the number of samples in each class.
TP(True Positives)signifies the number of samples accurately identified as positive, TN (True Negatives) denotes the number of samples correctly identified as negative, FP (False Positives) refers to the number of samples erroneously predicted as positive, and FN (False Negatives) indicates the number of samples mistakenly predicted as negative. Categorical data were expressed as n (%), and comparisons between groups were conducted using the χ² test. A P-value of < 0.05 (two-sided) was considered statistically significant.
Results
Constructing neural network
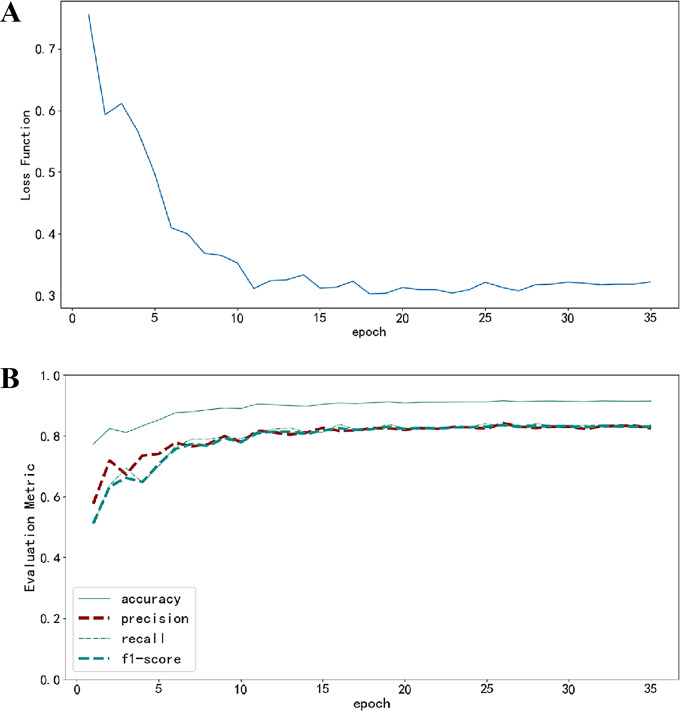
The model development utilized 33,290 capsule endoscopy images (including both training and validation sets), encompassing 12 types of small intestinal lesions. The distribution of these CE image categories is detailed in Figure S2. During the initial stages of model training, a rapid decline in the loss function indicated the model’s swift capture of data characteristics. As training epochs progressed, the rate of loss reduction slowed and eventually stabilized, signifying that the model reached a saturation point in its learning process. Performance metrics, after an initial improvement, remained stable without showing any decline or significant fluctuations, suggesting that the model avoided the risk of overfitting the data. Details of the training dynamics can be seen in Fig. 3.
Fig. 3.
Changes in Loss Function and Performance Metrics During Training. (A) Changes in the loss function as the number of training epochs increases; (B) Changes in evaluation metrics as the number of training epochs increases, where each evaluation metric is represented by different line styles and colors
Comparison of CE image diagnostic performance across different models
Table 1 presents a comparison of five different models trained through transfer learning: DenseNet121, EfficientNetB2, ResNet50, HRNet-w18, and MobileNetv3-large on a validation set containing 6,652 CE images for a 12-class classification task. Among these models, MobileNetv3-large demonstrated the best performance across all metrics, achieving an accuracy of 92.44%, precision of 86.78%, recall of 84.53%, and an f1-score of 85.55%. This surpasses the next-best model, EfficientNetB2, which achieved an accuracy of 91.55%, precision of 84.14%, recall of 83.14%, and an f1-score of 83.57%.
Table 1.
Performance comparison of different models on the validation set
| Model name | Accuracy | Precision | Recall | f1-score |
|---|---|---|---|---|
| DenseNet121 | 84.92% | 73.36% | 73.21% | 72.65% |
| EfficientNetB2 | 91.55% | 84.14% | 83.14% | 83.57% |
| ResNet50 | 87.13% | 76.72% | 72.61% | 74.05% |
| HRNet-w18 | 90.60% | 82.60% | 80.97% | 81.63% |
| MobileNetv3-large | 92.44% | 86.78% | 84.53% | 85.55% |
Performance evaluation of the optimal model on the test set
Table 2 provides a detailed evaluation of the performance of the optimal model, MobileNetv3-large, on a test set containing 1,013 capsule endoscopy (CE) images. This table offers a comprehensive metric analysis of the model’s recognition performance across 12 image categories, including Precision, Sensitivity (also known as Recall), Specificity, F1-Score, Accuracy, Average Precision (AP), Area Under the Receiver Operating Characteristic Curve (AUC), Matthews Correlation Coefficient (MCC), and Cohen’s Kappa coefficient. Additionally, the table includes summary statistical metrics such as Macro Average and Weighted Average, providing a quantified perspective on the overall performance of the model.
Table 2.
Performance evaluation metrics of the MobileNetv3-large model on the test set
| Category | Precision | Sensitivity | Specificity | f1-score | Accuracy | AP | AUC | MCC | Cohen’s kappa |
|---|---|---|---|---|---|---|---|---|---|
| Angiodysplasia | 0.9279 | 0.9115 | 0.9911 | 0.9196 | 0.9115 | 0.9664 | 0.9885 | 0.9097 | 0.9097 |
| Bleeding | 0.9808 | 0.9027 | 0.9978 | 0.9401 | 0.9027 | 0.9851 | 0.9977 | 0.9339 | 0.9329 |
| Erosion | 0.646 | 0.8902 | 0.957 | 0.7487 | 0.8902 | 0.8396 | 0.9791 | 0.7341 | 0.7227 |
| Erythema | 0.8431 | 0.7679 | 0.9916 | 0.8037 | 0.7679 | 0.8676 | 0.9796 | 0.7938 | 0.7928 |
| Foreign Body | 0.9717 | 1 | 0.9967 | 0.9856 | 1 | 0.9998 | 1 | 0.9841 | 0.984 |
| Lymph Follicle | 0.859 | 0.8072 | 0.9882 | 0.8323 | 0.8072 | 0.9224 | 0.99 | 0.8183 | 0.8178 |
| Lymphangiectasia | 0.8615 | 1 | 0.9906 | 0.9256 | 1 | 0.9977 | 0.9999 | 0.9238 | 0.9209 |
| Normal mucosa | 0.7731 | 0.9293 | 0.9705 | 0.844 | 0.9293 | 0.9483 | 0.9895 | 0.8298 | 0.8254 |
| Polyp | 0.8788 | 0.7436 | 0.9866 | 0.8056 | 0.7436 | 0.8584 | 0.9766 | 0.786 | 0.7825 |
| SMT | 0.9667 | 0.725 | 0.999 | 0.8286 | 0.725 | 0.9511 | 0.997 | 0.8317 | 0.8226 |
| Stenosis | 0.925 | 0.7115 | 0.9969 | 0.8043 | 0.7115 | 0.9202 | 0.9912 | 0.8027 | 0.7952 |
| Vein | 0.9381 | 0.9192 | 0.9934 | 0.9286 | 0.9192 | 0.9566 | 0.9923 | 0.921 | 0.9209 |
| macro avg | 0.881 | 0.859 | 0.9883 | 0.8639 | 0.859 | 0.9344 | 0.9901 | 0.8557 | 0.8523 |
| weighted avg | 0.883 | 0.8717 | 0.9877 | 0.8724 | 0.8717 | 0.9361 | 0.9897 | 0.8631 | 0.8602 |
Note The macro average metric treats all categories equally, ensuring that even categories with smaller sample sizes contribute equally to the model’s performance evaluation. In contrast, the weighted average metric considers the sample size of each category, assigning greater weight to categories with larger sample sizes
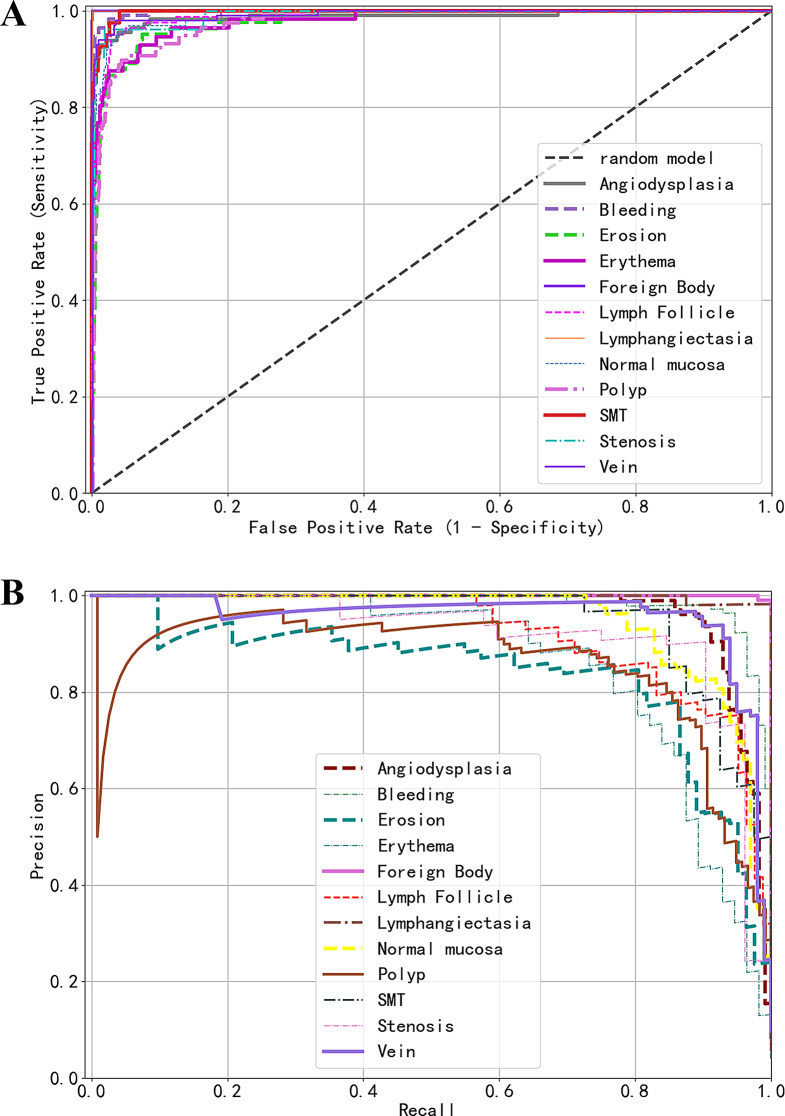
Figure 4 displays two key evaluation curves of the model’s predictive performance across different categories on the test set: (A) the Receiver Operating Characteristic (ROC) curves and (B) the Precision-Recall (PR) curves. In the ROC curve diagram, curves for categories like “Lymphangiectasia” and “Foreign Body” that approach the upper left corner of the chart indicate the model’s excellent performance in these categories. Similarly, in the PR curve diagram, curves trending towards the upper right corner denote equally strong performance in these categories. Conversely, curves in the ROC diagram that are distant from the upper left corner, such as those for “Polyp” and “Erosion,” and curves in the PR diagram that are far from the upper right corner, signify relatively poorer performance by the model in these categories.
Fig. 4.
Predictive performance of the model on an external test set. (A) Receiver operating characteristic (ROC) Curves; (B) Precision-recall (PR) curves
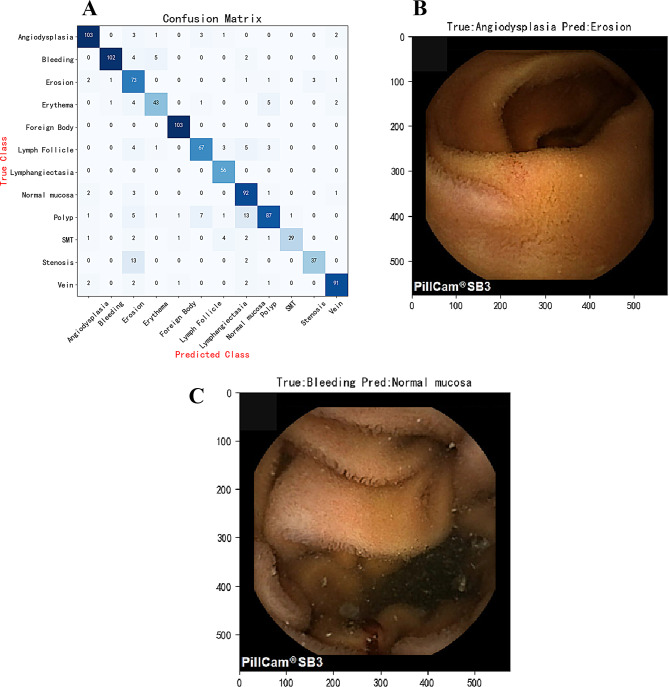
The effectiveness of the model’s classification was analyzed using a confusion matrix to verify its accuracy and robustness across different categories, with detailed results displayed in Fig. 5A. The study indicates that the AI model performs excellently in most cases. However, there are some classification errors, as shown in the misdiagnosed cases in Fig. 5B and C. These classification errors could be caused by overlapping features between image categories, unexpected light reflections, excessive shooting distances, and image blurriness, among other factors.
Fig. 5.
Performance of the Model on the Test Set. (A) Confusion Matrix: Displays the model’s classification accuracy. (B) Examples of Misclassified Images: The model incorrectly classifies images with true labels of angiodysplasia as erosion. (C) Image Examples: True label is bleeding, mistakenly classified as normal mucosa
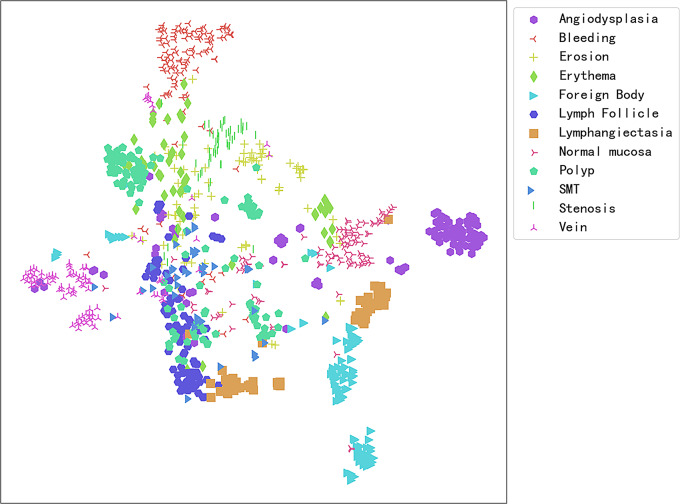
To analyze the reasons behind the misclassification of CE images by the model, the t-Distributed Stochastic Neighbor Embedding (t-SNE) technique was employed to effectively map high-dimensional data to a two-dimensional plane. This allows for the intuitive display of the separation degree between different categories, as detailed in Fig. 6. This visualization method helps identify which categories of images are easily distinguishable and which may require more complex feature extraction techniques or detailed analysis to improve classification accuracy. For example, the figure shows a slight overlap between vascular malformations and erosions, explaining some of the reasons for the model’s misclassification. Further, an interactive semantic feature map in two-dimensional space was constructed using the plotly library. This approach allows users to click on any point within the map to view its corresponding test set image and its position within the semantic feature space (Link: https://pan.baidu.com/s/1eOQ2DDvdoqda0BMVu0vaYA?pwd=8k8l, Access Code: 8k8l).
Fig. 6.
Two-Dimensional Semantic Feature Map of CE Images from the Test Set. Each color and shape represents a different CE image category, with image categories having similar features tending to cluster together in the graphical space. On the other hand, if the boundaries between some clusters are unclear, this may indicate that the model’s classification performance in these areas may overlap, leading to classification difficulties
Comparison of AI model and endoscopist diagnostic performance
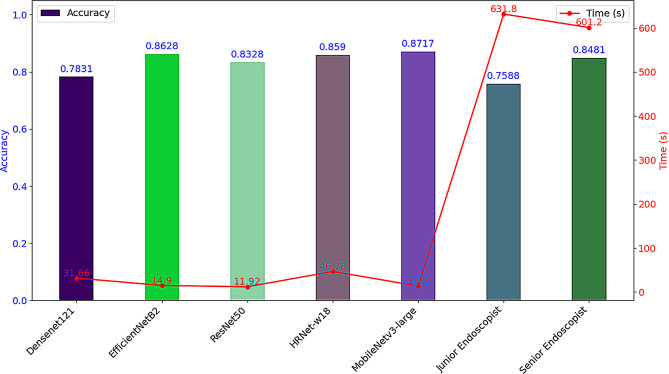
A performance comparison between five AI models and endoscopists with varying levels of experience was conducted on a test set containing 1,013 capsule endoscopy images, focusing primarily on diagnostic accuracy and diagnostic speed (measured in seconds). Among all the models, MobileNetv3-large demonstrated the best performance, achieving a diagnostic accuracy of 87.17%, surpassing that of junior endoscopists (75.88%) and senior endoscopists (84.81%). A χ² test showed that the differences in diagnostic accuracy among MobileNetv3-large, junior, and senior endoscopists were statistically significant (χ² = 48.98, P < 0.05). In terms of diagnostic speed, the AI model took only 13.5 s to analyze the 1,013 CE images (equivalent to 75.04 frames per second), significantly outpacing both junior and senior endoscopists (Fig. 7). The AI model’s diagnostic speed was approximately 46.8 times faster than that of junior endoscopists and about 44.53 times faster than that of senior endoscopists.
Fig. 7.
Comparison of diagnostic accuracy and speed between AI model and endoscopists of different experience levels. The bar graph represents a comparison of accuracy, while the line graph compares time; the left vertical axis indicates the accuracy rate, and the right vertical axis represents the diagnostic time (seconds)
Analysis of model interpretability
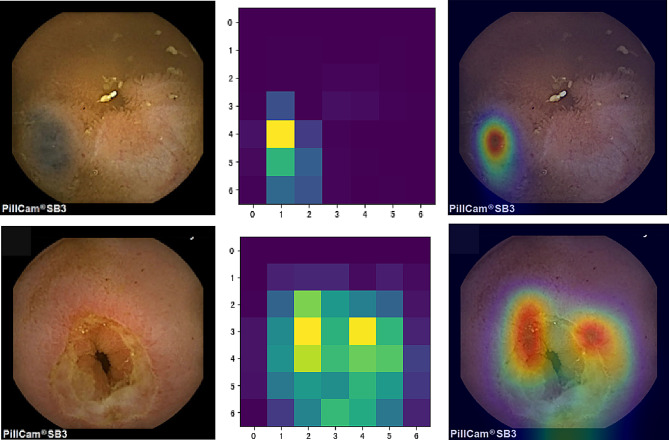
Figure 8 demonstrates the application of the Gradient-weighted Class Activation Mapping (Grad-CAM) technique for visualizing the decision-making process of the AI model. Column A presents the original endoscopy images; Column B showcases the pixel activation heatmaps generated based on the MobileNetv3-large model’s feature extraction, highlighting the key areas in the model’s decision-making process; Column C displays the overlay of the activation heatmaps on the original images, where the warm-toned areas, such as red and yellow, indicate the crucial lesion areas identified by the model.
Fig. 8.
Grad-CAM Visualization of the AI Model’s Decision-Making Process. Column A: Original endoscopic images; Column B: Pixel activation heatmaps using Grad-CAM; Column C: Combination of original images and activation heatmaps
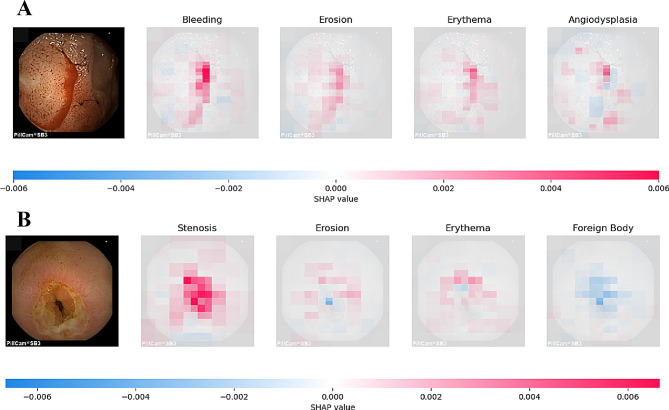
Figure 9 illustrates the internal mechanics of the model’s predictive logic using SHapley Additive exPlanations (SHAP) analysis. In the two sub-figures, the model’s predictions correspond to two true classifications: bleeding and stenosis. The depth of pixel color within the images indicates the level of contribution to the model’s prediction: red signifies a positive contribution towards the predicted outcome, while blue indicates a negative contribution. In sub-figure A, the red areas are more pronounced compared to erosions, erythema, and vascular malformations, enabling the model to accurately classify it as bleeding. Similarly, the features in sub-figure B allow the model to correctly diagnose stenosis.
Fig. 9.
Interpretability Analysis Using SHAP Technology. (A) CE images with the “Bleeding” label correctly predicted by the model using SHAP values; (B) CE images with the “Stenosis” label correctly predicted by the model using SHAP values
Real-time prediction of the model on video
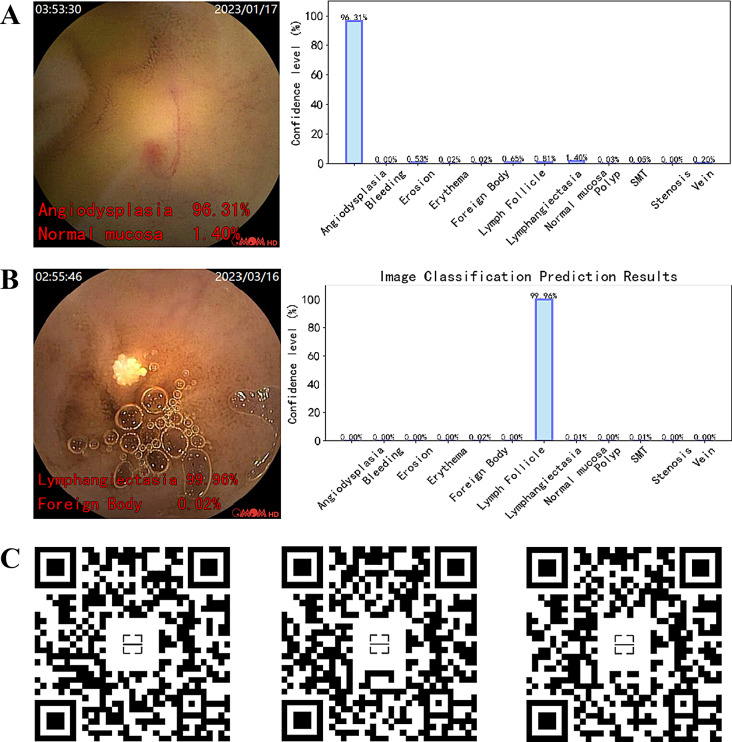
In this study, the best-performing AI model (MobileNetv3-large) was converted to the ONNX format within the PyTorch framework. Figure 10 demonstrates the real-time prediction capability of the ONNX model on capsule endoscopy video frames, implemented using OpenCV. Sections A and B display the model’s prediction results for two types of lesions, vascular malformations and lymphangiectasia, within a single frame image. The left image is the original, with the model’s top two most probable categories and their confidence levels annotated in red font at the bottom left corner, while the right image represents the confidence levels of different categories in a bar graph. Section C provides QR codes for real-time prediction links for three different lesion categories in CE videos. The model’s predicted categories and confidence levels are displayed in real-time at the bottom left corner of the video, allowing users to scan the QR codes to view the prediction effects within the videos.
Fig. 10.
Prediction Results of the Model on Single Frame Images and Video after Deployment. (A) & (B) Prediction of the model on single-frame CE images, with the original image on the left, where the red font in the bottom left corner displays the model’s prediction for the top two categories and their corresponding confidence levels. Correspondingly, the image on the right shows a histogram representation of the confidence levels for each category. (C) The real-time prediction effect of the model on video, displaying predictions for 3 different categories of small intestinal lesions
Model deployment with GUI for clinical use
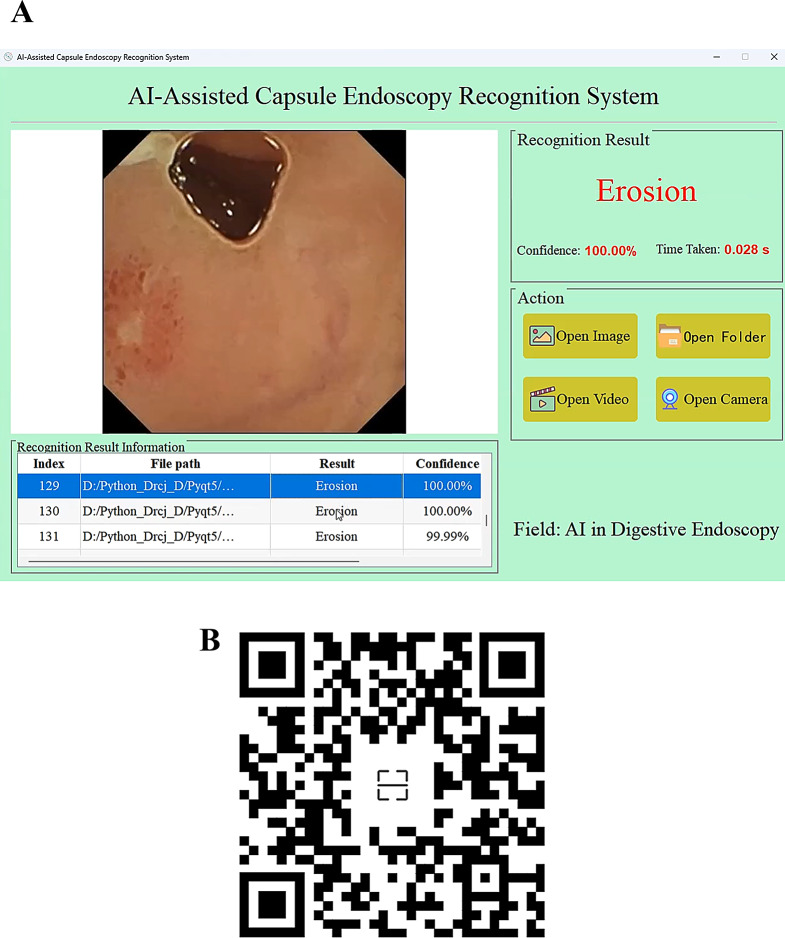
To enable medical professionals without programming knowledge to easily utilize the developed AI model in clinical practice, this study converted the model from the PyTorch framework to the ONNX format and developed a visual graphical user interface (GUI) application using PyQt5 technology (Fig. 11A). By scanning the QR code in Fig. 11B, one can view a demonstration of an endoscopist using the application to batch predict 179 CE images. The results indicate that the AI’s recognition speed is both efficient and accurate.
Fig. 11.
Desktop application built on the best-performing model. (A) An application with a visual operational interface. (B) Prediction results for batch images using the application
Discussion
This study established a CE image dataset comprising 12 types of lesions, including erosion, bleeding, polyps, and foreign bodies, involving three different brands of capsule endoscopy devices. Based on this dataset, five AI models with CNN architectures were developed using transfer learning methods, aimed at automating the diagnosis of multiple types of small bowel lesions. The MobileNetv3-large model demonstrated the best performance during validation and testing and exhibited its generalization capability and reliability in human-machine comparison experiments. This model was then converted to the ONNX format and developed into an application using PyQt5 technology, making it convenient for gastroenterologists to use in clinical practice.
The research on artificial intelligence systems for capsule endoscopy has predominantly been based on image datasets from single-brand capsule endoscopes, thus training the models. Specifically, the studies by Yokote A and de Maissin, A [14, 21]utilized images captured by the PillCam SB3 device from the United States, the research by Smedsrud PH [15]employed images obtained from the Japanese EndoCapsule device, and the study by Xie X [11]was founded on image data from the Chinese OMOM brand. This approach might lead to a bias in the model towards the specific image acquisition methods, image quality, and optical characteristics of particular brands, as capsule endoscopes from different manufacturers may vary in aspects such as image resolution, contrast, and color saturation. However, the research by Urban et al. [22] demonstrated that models trained on datasets incorporating a variety of image enhancement techniques outperform those trained on datasets using a single technique, due to the rich training data and synergistic effect of knowledge from the mixed dataset. Drawing on this insight, the MobileNetv3-large model developed in this study was trained using images captured by three different brands of capsule endoscopy devices. This approach effectively leveraged the diversity of the data, resulting in a model that not only demonstrated higher brand generalization but also exhibited outstanding performance.
Early research in the field of capsule endoscopy AI primarily focused on identifying single lesion types, such as bleeding [23] and elevated lesion [24]. These models, due to their singular focus, were structurally simpler and easier to construct. However, developing models capable of recognizing multiple types of lesions not only significantly enhances the models’ universality but also improves the comprehensiveness of small bowel lesion diagnosis. The MobileNetv3-large model developed in this study is capable of identifying 12 common types of small bowel lesions, including vascular malformations, bleeding, erosions, and polyps. It exhibited outstanding performance in the comprehensive evaluation across all categories, with a weighted average AUC and accuracy of 0.9897 and 87.17%, respectively. This model can assist radiologists in efficiently screening and diagnosing small bowel lesions, thereby enhancing the efficiency of medical services.
Over the past decade, various computer-based AI-assisted systems have been developed specifically for analyzing CE images. A systematic review and meta-analysis verified the efficacy of the Suspected Blood Indicator (SBI) software in CE applications, revealing an overall sensitivity of 55.3% and specificity of 57.8% [25] for identifying bleeding or potentially bleeding lesions. Furthermore, a multicenter prospective study using the “Quick View” reading mode of the Intromedic capsule system demonstrated that this mode significantly improved reading efficiency while maintaining a sensitivity of 82.2%, reducing the average reading time from 39.7 min to 19.7 min [26]. In contrast, the MobileNetv3-large model developed in this study demonstrated a weighted average sensitivity of 90.27% and specificity of 99.78% on the test set, particularly achieving a sensitivity of 89.4% and specificity of 99.4% in the bleeding category. It can complete the diagnosis of 1013 CE images in just 13.5 s, making its speed 46.8 times faster than that of less experienced endoscopists.
Among the 12 lesion categories identified by the MobileNetv3-large model, the detection of “polyp” and “erosion” poses challenges, as evidenced by lower sensitivity and precision metrics for these two categories compared to others. Differentiating between intestinal peristalsis-induced mucosal folds and actual polyps presents a significant challenge for “polyp”; for “erosion,” lighting conditions and the movement of the capsule can cause blurring of erosion areas in images, thus complicating predictions. We employed the t-SNE technique to reduce high-dimensional data for visual analysis, offering a more intuitive understanding of the causes behind model misclassifications. Based on these insights, targeted data collection, improved data annotation methods, and adjusted model training strategies were implemented to optimize and enhance model performance.
One of the key strengths of this study is the use of image datasets from three different capsule endoscopy brands, which effectively enhances the model’s generalization ability and addresses the bias issues seen in previous studies based on single-brand devices. Additionally, the model is capable of recognizing 12 types of lesions, significantly improving diagnostic comprehensiveness, and demonstrated excellent performance in testing, with an AUC of 0.9897 and weighted average sensitivity and specificity of 90.27% and 99.78%, respectively, providing reliable assistance for clinical practice. Furthermore, the developed graphical user interface (GUI) allows medical personnel to use the system conveniently without any programming knowledge, further enhancing its clinical utility. However, this study also has some limitations. First, the current model primarily focuses on the identification of small intestine lesions. Future work could expand its scope to cover multiple gastrointestinal regions (such as the stomach, small intestine, and colon) or even achieve recognition across the entire gastrointestinal tract for more comprehensive screening. Moreover, linking the image information with lesion location, pathology, etiological diagnosis, and disease prognosis could help track gastrointestinal lesions, assess malignancy levels, develop treatment plans, and conduct prognostic evaluations, thereby providing better support for clinical decision-making.
Conclusions
This study utilized a dataset comprising images from three different brands of capsule endoscopes to construct an AI model and application capable of automatically diagnosing 12 types of small bowel lesions. The development process encompassed the full pipeline, from training, validation, testing, and visual interpretability to terminal deployment. The model demonstrated significant clinical application potential through comparisons with endoscopists of varying experience levels, particularly in diagnostic accuracy and speed. However, larger-scale multicenter prospective studies are still necessary to fully validate the clinical effectiveness and practical feasibility of artificial intelligence in detecting small intestine lesions.
Electronic Supplementary Material
Below is the link to the electronic supplementary material.
Supplementary Material 1: Figure S1. Examples of representative annotated images. The annotated images and the distribution of annotation labels within the dataset encompass a wide array of lesions and normal structures. These annotations include Angiodysplasia (areas of erythema suspected of capillary malformation), Bleeding (clear bleeding areas, excluding dark areas distant from the bleeding source), Erosion (mucosal damage areas, such as erosions, ulcers, and notches), Erythema (areas of redness and swelling possibly related to inflammation), Stenosis (contracted and stiff areas), Lymphangiectasia (areas containing lymphatic vessels larger than one point), SMT (areas resembling submucosal tumors), Polyp (elevated lesions with a base or areas suspected of adenoma), Lymphoid follicle (areas containing normal follicles and areas suspected of lymphoid follicles), Foreign Body (objects other than food), Vein (areas with venous structures), and Normal mucosa (normal mucosal areas without the aforementioned lesions).
Supplementary Material 2: Figure S2. Distribution of the 12 types of CE images used in model development.
Acknowledgements
Not applicable.
Author contributions
JC and KX contributed equally to this work. CJ and XXD worked on the study design. WGH and DY worked on data collection. ZZH, XKJ, DY, and CJ worked on data analysis. DY worked on manuscript preparation. XXD, CJ, and XKJ provided administrative, technical, or material support. XXD supervised the study. All authors have made a significant contribution to this study and have approved the final manuscript.
Funding
This study received financial support from the Suzhou Clinical Key Disease Diagnosis and Treatment Technology Special Project (LCZX202334); The Changshu Key Laboratory Capacity Enhancement Project for Medical Artificial Intelligence and Big Data (CYZ202301); the Changshu Medical and Health Science and Technology Plan Project (CSWS202316); and the Changshu Science and Technology Development Plan Project (CS202019).
No funding body had any role in the design of the study and collection, analysis, interpretation of data, or in writing the manuscript.
Data availability
The datasets analysed during the current study are available from the corresponding author on reasonable request.
Declarations
Ethics approval and consent to participate
This study has obtained approval from the Ethics Committee of Changshu Hospital Affiliated to Soochow University (the IRB approval number L2024003). This study was performed in accordance with the Declaration of Helsinki, and written informed consent was obtained from all participants.
Consent for publication
Not applicable.
Competing interests
The authors declare no competing interests.
Footnotes
Publisher’s note
Springer Nature remains neutral with regard to jurisdictional claims in published maps and institutional affiliations.
Jian Chen and Kaijian Xia have contributed equally to this work and share first authorship.
Contributor Information
Ganhong Wang, Email: 651943259@qq.com.
Xiaodan Xu, Email: xxddocter@gmail.com.
References
- 1.Wang A, Banerjee S, Barth BA, Bhat YM, Chauhan S, Gottlieb KT, Konda V, Maple JT, Murad F, Pfau PR, et al. Wireless capsule endoscopy. Gastrointest Endosc. 2013;78(6):805–15. [DOI] [PubMed] [Google Scholar]
- 2.Hosoe N, Takabayashi K, Ogata H, Kanai T. Capsule endoscopy for small-intestinal disorders: Current status. Dig endoscopy: official J Japan Gastroenterological Endoscopy Soc. 2019;31(5):498–507. [DOI] [PubMed] [Google Scholar]
- 3.Takada K, Yabuuchi Y, Kakushima N. Evaluation of current status and near future perspectives of capsule endoscopy: Summary of Japan Digestive Disease Week 2019. Dig endoscopy: official J Japan Gastroenterological Endoscopy Soc. 2020;32(4):529–31. [DOI] [PubMed] [Google Scholar]
- 4.Beg S, Card T, Sidhu R, Wronska E, Ragunath K. The impact of reader fatigue on the accuracy of capsule endoscopy interpretation. Digest Liver Dis. 2021;53(8):1028–33. [DOI] [PubMed]
- 5.Dray X, Iakovidis D, Houdeville C, Jover R, Diamantis D, Histace A, Koulaouzidis A. Artificial intelligence in small bowel capsule endoscopy - current status, challenges and future promise. J Gastroen Hepatol. 2021;36(1):12–9. [DOI] [PubMed] [Google Scholar]
- 6.Sinonquel P, Eelbode T, Bossuyt P, Maes F, Bisschops R. Artificial intelligence and its impact on quality improvement in upper and lower gastrointestinal endoscopy. Dig endoscopy: official J Japan Gastroenterological Endoscopy Soc. 2021;33(2):242–53. [DOI] [PubMed] [Google Scholar]
- 7.Yu H, Singh R, Shin SH, Ho KY. Artificial intelligence in upper GI endoscopy - current status, challenges and future promise. J Gastroen Hepatol. 2021;36(1):20–4. [DOI] [PubMed] [Google Scholar]
- 8.Chen J, Wang G, Zhou J, Zhang Z, Ding Y, Xia K, Xu X. AI support for colonoscopy quality control using CNN and transformer architectures. BMC Gastroenterol. 2024;24(1):257. [DOI] [PMC free article] [PubMed] [Google Scholar]
- 9.Vasilakakis MD, Koulaouzidis A, Marlicz W, Iakovidis DK. The future of capsule endoscopy in clinical practice: from diagnostic to therapeutic experimental prototype capsules. Przeglad gastroenterologiczny. 2020;15(3):179–93. [DOI] [PMC free article] [PubMed] [Google Scholar]
- 10.Leenhardt R, Koulaouzidis A, Histace A, Baatrup G, Beg S, Bourreille A, de Lange T, Eliakim R, Iakovidis D, Dam Jensen M, et al. Key research questions for implementation of artificial intelligence in capsule endoscopy. Ther Adv Gastroenter. 2022;15:1098315659. [DOI] [PMC free article] [PubMed] [Google Scholar]
- 11.Xie X, Xiao Y, Zhao X, Li J, Yang Q, Peng X, Nie X, Zhou J, Zhao Y, Yang H, et al. Development and Validation of an Artificial Intelligence Model for Small Bowel Capsule Endoscopy Video Review. Jama Netw Open. 2022;5(7):e2221992. [DOI] [PMC free article] [PubMed] [Google Scholar]
- 12.Ding Z, Shi H, Zhang H, Zhang H, Tian S, Zhang K, Cai S, Ming F, Xie X, Liu J, et al. Artificial intelligence-based diagnosis of abnormalities in small-bowel capsule endoscopy. Endoscopy. 2023;55(1):44–51. [DOI] [PubMed] [Google Scholar]
- 13.Ding Z, Shi H, Zhang H, Meng L, Fan M, Han C, Zhang K, Ming F, Xie X, Liu H, et al. Gastroenterologist-Level Identification of Small-Bowel Diseases and Normal Variants by Capsule Endoscopy Using a Deep-Learning Model. Gastroenterology. 2019;157(4):1044–54. [DOI] [PubMed] [Google Scholar]
- 14.Yokote A, Umeno J, Kawasaki K, Fujioka S, Fuyuno Y, Matsuno Y, Yoshida Y, Imazu N, Miyazono S, Moriyama T et al. Small bowel capsule endoscopy examination and open access database with artificial intelligence: The SEE-artificial intelligence project. Den Open 2024, 4(1). [DOI] [PMC free article] [PubMed]
- 15.Smedsrud PH, Thambawita V, Hicks SA, Gjestang H, Nedrejord OO, Næss E, Borgli H, Jha D, Berstad TJD, Eskeland SL, et al. Kvasir-Capsule, a video capsule endoscopy dataset. SCI DATA. 2021;8(1):142. [DOI] [PMC free article] [PubMed] [Google Scholar]
- 16.Athalye C, Arnaout R. Domain-guided data augmentation for deep learning on medical imaging. PLoS ONE. 2023;18(3):e282532. [DOI] [PMC free article] [PubMed] [Google Scholar]
- 17.Zhang Y, Hong D, McClement D, Oladosu O, Pridham G, Slaney G. Grad-CAM helps interpret the deep learning models trained to classify multiple sclerosis types using clinical brain magnetic resonance imaging. J Neurosci Meth. 2021;353:109098. [DOI] [PubMed] [Google Scholar]
- 18.Kikutsuji T, Mori Y, Okazaki K, Mori T, Kim K, Matubayasi N. Explaining reaction coordinates of alanine dipeptide isomerization obtained from deep neural networks using Explainable Artificial Intelligence (XAI). J Chem Phys. 2022;156(15):154108. [DOI] [PubMed] [Google Scholar]
- 19.Linderman GC, Steinerberger S. Clustering with t-SNE, provably. Siam J Math Data Sci. 2019;1(2):313–32. [DOI] [PMC free article] [PubMed] [Google Scholar]
- 20.Kirsan AS, Takano K, Zebada Mansurina ST. EksPy: a new Python framework for developing graphical user interface based PyQt5. Int J Electr Comput Eng (IJECE). 2024;14(1):520–31. [Google Scholar]
- 21.de Maissin A, Vallée R, Flamant M, Fondain-Bossiere M, Berre CL, Coutrot A, Normand N, Mouchère H, Coudol S, Trang C, et al. Multi-expert annotation of Crohn’s disease images of the small bowel for automatic detection using a convolutional recurrent attention neural network. Endosc Int Open. 2021;9(7):E1136–44. [DOI] [PMC free article] [PubMed] [Google Scholar]
- 22.Urban G, Tripathi P, Alkayali T, Mittal M, Jalali F, Karnes W, Baldi P. Deep Learning Localizes and Identifies Polyps in Real Time With 96% Accuracy in Screening Colonoscopy. Gastroenterology. 2018;155(4):1069–78. [DOI] [PMC free article] [PubMed] [Google Scholar]
- 23.Musha A, Hasnat R, Mamun AA, Ping EP, Ghosh T. Computer-Aided Bleeding Detection Algorithms for Capsule Endoscopy: A Systematic Review. Sensors 2023, 23(16). [DOI] [PMC free article] [PubMed]
- 24.Kim HJ, Gong EJ, Bang CS, Lee JJ, Suk KT, Baik GH. Computer-Aided Diagnosis of Gastrointestinal Protruded Lesions Using Wireless Capsule Endoscopy: A Systematic Review and Diagnostic Test Accuracy Meta-Analysis. J Pers Med 2022, 12(4). [DOI] [PMC free article] [PubMed]
- 25.Yung DE, Sykes C, Koulaouzidis A. The validity of suspected blood indicator software in capsule endoscopy: a systematic review and meta-analysis. Expert Rev Gastroent. 2017;11(1):43–51. [DOI] [PubMed] [Google Scholar]
- 26.Saurin J, Jacob P, Heyries L, Pesanti C, Cholet F, Fassler I, Boulant J, Bramli S, De Leusse A, Rahmi G. Multicenter prospective evaluation of the express view reading mode for small-bowel capsule endoscopy studies. Endosc Int Open. 2018;6(5):E616–21. [DOI] [PMC free article] [PubMed] [Google Scholar]
Associated Data
This section collects any data citations, data availability statements, or supplementary materials included in this article.
Supplementary Materials
Supplementary Material 1: Figure S1. Examples of representative annotated images. The annotated images and the distribution of annotation labels within the dataset encompass a wide array of lesions and normal structures. These annotations include Angiodysplasia (areas of erythema suspected of capillary malformation), Bleeding (clear bleeding areas, excluding dark areas distant from the bleeding source), Erosion (mucosal damage areas, such as erosions, ulcers, and notches), Erythema (areas of redness and swelling possibly related to inflammation), Stenosis (contracted and stiff areas), Lymphangiectasia (areas containing lymphatic vessels larger than one point), SMT (areas resembling submucosal tumors), Polyp (elevated lesions with a base or areas suspected of adenoma), Lymphoid follicle (areas containing normal follicles and areas suspected of lymphoid follicles), Foreign Body (objects other than food), Vein (areas with venous structures), and Normal mucosa (normal mucosal areas without the aforementioned lesions).
Supplementary Material 2: Figure S2. Distribution of the 12 types of CE images used in model development.
Data Availability Statement
The datasets analysed during the current study are available from the corresponding author on reasonable request.


