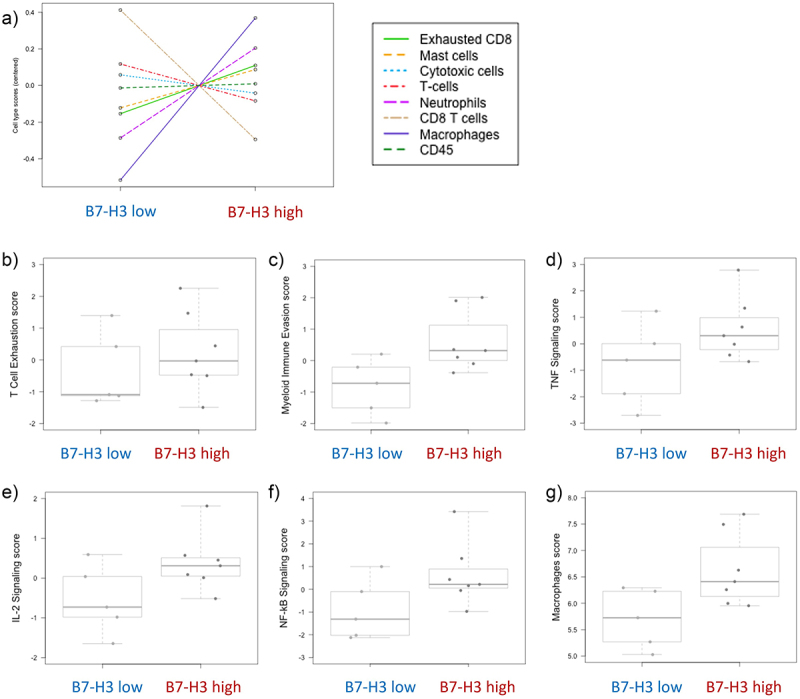
Figure 5.

Molecular immune exhaustion panel analysis of ccRCC patients according to B7-H3 expression.
a) Relative cell type measurements vs. B7-H3. Plots show the relative cell type abundance measurements against B7-H3 expression. Pathway analysis of the different cell types: b) T cell exhaustion, c) myeloid immune evasion, d) TNF signaling, e) IL-2 signaling, f) NF-κΒ signaling, and g) macrophages scores. Data are represented in a logarithmic scale (Log2) and obtained from 12 ccRCC tumor samples. Plots pathway scores are represented against B7-H3 expression.
