Figure 6.

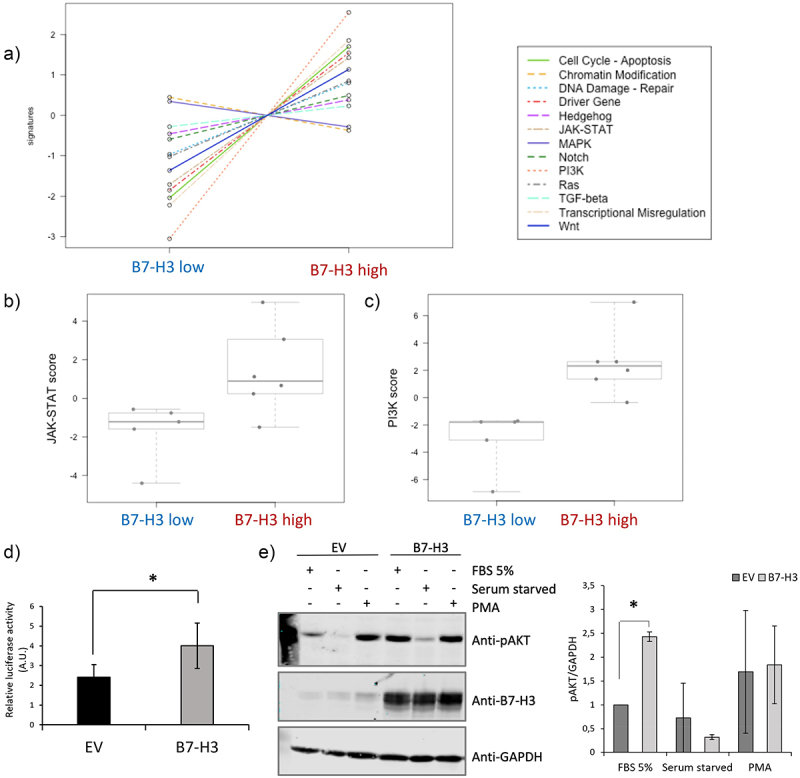
Molecular pan cancer pathway panel analysis of ccRCC tumor samples according to B7-H3 expression.
a) PanCancer Pathway signature in ccRCC tumor samples. b, c) Pan Cancer pathway analysis JAK/STAT and PI3K signaling score. Box plots of the JAK/STAT and PI3K pathway score are shown in high B7-H3 protein expression vs low B7-H3 protein expression tumors. d) B7-H3-dependent STAT3 functional activity in kidney cells. B7-H3 and STAT3 luciferase-based activation assay reporter were co-transfected, and luminescence is shown in arbitrary units (A.U.) from three independent experiments. Statistically significant results (p < 0.05) are marked with *. EV, empty vector. e) B7-H3-dependent AKT functional activity in kidney cells. HEK293 cells were co-transfected with plasmids encoding B7-H3 and HA-AKT1, and the phosphorylation of AKT was monitored by immunoblotting using the anti-pAKT (Ser473) antibody. The expression of B7-H3 and GAPDH (as a loading control) was also monitored using specific antibodies. Cells were either left untreated, serum-starved, or treated with PMA (100 nΜ for 30 min). Quantifications of pAKT/GAPDH are shown in the right panel.
