

Abstract
Motion is unavoidable in dynamic [18F]-MK6240 Positron Emission Tomography (PET) imaging, especially in Alzheimer’s disease (AD) research requiring long scan duration. To understand how motion correction affects quantitative analysis, we investigated two approaches: II-MC, which corrects for both inter-frame and intra-frame motion, and IO-MC, which only corrects for inter-frame motion. These methods were applied to 83 scans from 34 subjects, and we calculated distribution volume ratios (DVR) using the multilinear reference tissue model with two parameters (MRTM2) in tau-rich brain regions. Most of the studies yielded similar DVR results for both II-MC and IO-MC. However, in one scan of an AD subject, the inferior temporal region showed 14% higher DVR with II-MC compared to IO-MC. This difference was reasonable given the AD diagnosis, although similar results were not observed in other regions. Although discrepancies between IO-MC and II-MC results were rare, they underscore the importance of incorporating intra-frame motion correction for more accurate and dependable PET quantitation, particularly in the context of dynamic imaging. These findings suggest that while the overall impact of intra-frame motion correction may be subtle, it can improve the reliability of longitudinal PET data, ultimately enhancing our understanding of tau protein distribution in AD pathology.
Index Terms—: Alzheimer’s Disease, [18F]-MK6240, List-mode-based Reconstruction, Motion Correction
I. INTRODUCTION
The accumulation of hyperphosphorylated tau protein is one of the key biomarkers in Alzheimer’s disease (AD) [1]. The rate of tau accumulation is a measurement of interest for AD researchers since it correlates with cognitive decline [2]. The Positron Emission Tomography (PET) tracer [18F]-MK6240 has emerged as a powerful tool for tau protein quantification in vivo [3] and therefore for estimating its deposition rate through longitudinal studies [4]. Research studies investigating [18]F-MK6240 often involve dynamic acquisitions since it allows for more accurate quantitative measurements via kinetic modeling of estimated parameters [5]. However, the extended scan duration necessary for a full dynamic acquisition makes head motion more probable.
The subject of head motion correction in PET imaging has been extensively investigated [6–11]. In dynamic imaging, where the acquisition is partitioned into multiple frames, image registration between the frames is a commonly used motion correction technique [9, 12]. Additional image registration between the frames and the CT scan can detect any potential misalignment between the PET data and the attenuation map [10, 11]. However, the intra-frame motion is still unaccounted for. Real-time motion tracking [13] can detect such motion but it requires an external motion tracking device. This method is not always easy to implement and poses challenges for multi-center trials and longitudinal PET scans. Moreover, this method cannot be applied to previously acquired data. Data-driven techniques such as center-of-mass [14–16] or principal component analysis [17] have been proposed as an alternative to external tracking to detect head motion occurring during the scan. Motion-free frames are then extracted and reconstructed, thus achieving intra-frame motion correction. However, these approaches require rebinning the list-mode data, which is not desirable when dynamic frames are fixed. A new approach for intra-frame motion detection has been made possible by the development of ultra-fast list-mode reconstruction, allowing for image reconstruction for very short snapshots of the data (less than one second) in near real time [18]: it consists of registering the short snaps to estimate motion and applying event-by-event motion correction in a final list-mode reconstruction. We have previously used this approach in static imaging [19] and shown that it improved the quantification of normalized activity measurements (between 90–110 min post-tracer injection) in [18F]-MK6240 studies.
Although the data used in this work were acquired on a PET/CT scanner, it is worth noting that many studies have been previously published about head motion correction utilizing the Magnetic Resonance (MR) modality in simultaneous PET/MR scanners [20–25]. Both conventional MR navigator methods [21, 22] and advanced cloverleaf navigators [23] can be utilized for head motion tracking. Other motion-tracking methods include wired [24] and wireless micro-coil [25]. These methods can achieve a spatial resolution of less than 1 mm and a temporal resolution of less than 20 ms, which are sufficient for PET motion corrections. However, they require dedicated motion-tracking MR sequences to be performed simultaneously with PET acquisition. In a PET/MR brain scan, where dynamic PET data is acquired, PET events are recorded throughout the entire imaging session, while multiple brain MR sequences, such as T1, T2-weighted, and proton density, need to be acquired. Therefore, it is impractical to run a dedicated MR head motion tracking sequence continuously during the imaging session. Although integrating motion-tracking MR sequence modules, such as navigators, into these brain MR sequences is theoretically possible, it requires significant sequence development. Even if such implementation is achieved, there are still time gaps before and after each brain MR sequence where no motion tracking information from MR is available. PET list-mode-based motion correction, on the other hand, is independent of MR acquisition. It can be applied at any time except during the very early frames of dynamic scans, when PET tracers are not yet distributed in the brain, making image registration difficult. A dedicated MR motion tracking sequence offers a solution to the motion problem during these early dynamic frames.
In this work, we examine the specific impact of incorporating intra-frame motion correction in combination with inter-frame registration in PET dynamic imaging. We utilize a dataset of [18F]-MK6240 studies acquired on a PET/CT scanner from a cohort recruited to investigate the longitudinal uptake of tau protein in normal aging and AD. We focus on the distribution volume ratio (DVR), which is a standard quantitative metric to measure tau burden in key brain regions associated with AD. To do so, we obtain motion fields by using ultra-fast list-mode reconstruction for motion detection, generate the intra-motion-corrected frames, and register them to achieve inter-frame motion correction. Then, we extract regional time activity curves (TACs) and apply the graphical method based on the multilinear reference tissue model 2 (MRTM2) [26] to estimate the DVR values [5]. We compare our results to those obtained without intra-frame motion correction to determine the effect solely from such correction.
II. Methods
A. Data summary
In this work, we processed 83 dynamic PET studies spanning 34 subjects (28 cognitively normal (CN), 5 with Mild Cognitive Impairment (MCI), and 1 with AD), aged 67 ± 11 (mean ± standard deviation). Table I summarizes the participants’ information. The dynamic PET scans were acquired on a GE Discovery MI PET/CT scanner according to the following protocol: after positioning the subject in the scanner, a low-dose head CT was acquired for attenuation correction; a single bolus injection of [18F]-MK6240 (183 ± 9 MBq) was performed; and list-mode emission data were collected for 120 minutes following tracer injection. Thirty-two subjects were scanned a second time 437 ± 325 days after their first scan, and 15 subjects returned for a third study 517 ± 253 days after their second scan. Two subjects underwent a fourth scan 365 and 617 days after their third one. At their initial visits, all subjects underwent an MRI scan using a standard Magnetization-Prepared Rapid Gradient-Echo (MPRAGE) sequence on a Siemens 3T system. The MR images were processed using FreeSurfer [27] to generate high-resolution anatomical regions of interest (ROI) for volumetric analyses [28]. All subjects provided informed consent, and the study was approved by the institutional review board at Massachusetts General Hospital.
TABLE I.
SUMMARY OF THE SUBJECTS INFORMATION
| Diagnosis | CN | MCI | AD |
|---|---|---|---|
| Number of subjects | 28 | 5 | 1 |
| Age (mean ± std) | 66 ± 11 | 70 ± 10 | 65 |
| Sex (Male / Female) | 15/13 | 3/2 | 0/1 |
| Number of longitudinal scans (t 1 /t 2 /t 3 /t 4 ) | 28/26/12/1 | 5/5/3/0 | 1/1/0/0 |
B. Motion correction
For each PET study, the list-mode data was partitioned into 54 frames as follows: 6×10s, 8×15s, 6×30s, 8×60s, 8×120s, and 18×300s [5]. In each frame, we applied intra-frame motion correction using ultra-fast list-mode reconstruction [18] for motion measurement, followed by another list-mode reconstruction to obtain the intra-frame-motion-corrected image. The processing was performed using the PET reconstruction toolbox provided by GE HealthCare. Specifically, the frame is partitioned into very short intervals (with the total number of detected events set to 500k) that are reconstructed into low-resolution images, also called “snaps”. The registration of these images was performed by fixing the middle of the frame as the reference with a set duration of 10% of the frame’s length. As such, the time elapsed between two snaps to be registered was always less than 2.5 minutes. A least-squares-based cost function was used for the snap-to-snap rigid registrations, as it had been found to be more robust than the mutual information cost function for low-resolution images [29]. Once all the snaps had been registered to their reference snap (the middle of the frame), the mean image spanning the entire frame was in turn registered to the CT through minimizing a mutual-information-based cost function [30]. The composition of the transformations was incorporated into a second list-mode reconstruction, described below, thus ensuring both intra-frame motion correction and accurate attenuation correction.
The endpoints of the events included in each snap are transformed according to the obtained transformation matrix and then fed into the list-mode reconstruction framework with all relevant PET corrections including normalizations, attenuation, scatter, and random corrections. The motion-corrected image is computed using an iterative procedure based on the ordered-subsets-expectation-maximization (OSEM) algorithm. Instead of explicitly defining the number of iterations and the number of subsets, the GE toolbox input parameters were the number of events to be processed in each subset (fixed to 10M) and the total number of updates (i.e. the number of times the image was updated during the reconstruction, this number was fixed to 80, equivalent to 5 iterations and 16 subsets). The determination of the number of subsets arises from dividing the total number of events within the frame by the predetermined number of events per subset. Then the number of iterations is given by the division of the desired number of total updates by the calculated number of subsets.
Once all the frames had been processed through the intra-frame motion correction framework, inter-frame motion correction was achieved using rigid registration with the SimpleITK package [31]. The middle frame served as the fixed reference and mutual information [30] was the cost function. The registration employed a Conjugate Gradient Line Search optimizer and a multi-resolution strategy to enhance accuracy. To account for activity distribution change, especially at the end of the acquisition, a second registration was performed on the last 9 frames with the fixed frame set at 70 minutes (i.e. frame #45).
The final generated 4D volume of dynamic PET images had a matrix size of 256×256×89×54 and a voxel size of 1.17×1.17×2.8 mm3. We refer to these images as the result of the II-MC method, since they are Intra- and Inter- frame Motion Corrected. To focus on the effect of intra-frame motion correction in this study, we repeated the above processing while disabling the intra-frame motion correction by setting all the registration matrices between the snaps to the identity matrix. As such, any mismatch between the PET data and the CT for attenuation correction was corrected. We refer to the obtained images as the product of the IO-MC method, since Only Inter-frame Motion Correction has been applied. Additionally, we also generated images using the ‘standard’ processing method employed in [5], which consists of frame-to-frame registration of reconstructed images without intra-frame motion correction or registration between the PET and the attenuation map. We refer to these images as being from the ‘standard’ method when discussing our results.
C. Image processing and data analysis
The frames corresponding to the PET data acquired between 2–12 min post-injection were summed and rigidly co-registered to the subject’s structural MR image. The registration was performed using ANTs software [32] as a rigid transformation (6 parameters) with the cost function driven by the mutual information metric. The same transformation was applied to the FreeSurfer parcellations thus transforming the masks of the regions of interest into the PET space.
The regional brain TACs were extracted from the motion-corrected dynamic PET images. In this work, we focused on four relevant brain regions known to accumulate tau and therefore [18F]-MK6240 uptake in the relatively early stages of the disease: the entorhinal cortex, the inferior temporal gyrus, the precuneus, and the amygdala. In addition, we also evaluated the method in four “cold” regions (i.e. devoid of specific binding): the cerebellum gray matter, the lateral, the third and the fourth ventricles.
We used the non-eroded cerebellum gray matter as the reference region in kinetic modeling. For each scan, we first fit an MRTM model to the TACs in high-binding regions to estimate the clearance rate constant from the reference region to plasma () [26]. Since this process provided a different estimate of the rate constant per high binding region, we used the median to set the scan-specific . When a scan showed low uptake in all regions (which is common in our dataset of mostly CN subjects), the parameter was fixed to a population-based value [5]. After the rate constant has been determined, we conducted the MRTM2 graphical method to estimate regional DVR values [5]. For both MRTM and MRTM2 fitting, we set the cut-off time for the assumption of data linearity to . DVR values for the ‘standard’, IO-MC, and II-MC were calculated in 15 AD’s key brain regions for all 83 scans from the 34 included subjects.
In the absence of a gold standard for the DVR estimates, we conducted a paired t-test to determine if the DVR values after applying II-MC are different from the DVR values obtained using IO-MC. We performed this test separately for CN (68 scans from 28 subjects) and MCI/AD subjects (15 scans from 6 subjects). The null hypothesis for the t-test is: “the mean IO-MC DVR is equal to the mean II-MC DVR”. We assumed that DVR values are normally distributed for each group of subjects.
III. Results
A. Case studies
We first present results from one subject (a 55-year-old man, CN). He underwent four scans separated by 177, 188, and 617 days. We show the time activity curves obtained after applying ‘standard’, IO-MC, and II-MC methods for the fourth acquisition, in which substantial motion happened in the frame 60–65 min, affecting the TACs in both hot and cold regions (Fig. 1). The TACs produced from the ‘standard’ images show a clear discontinuity starting at the one-hour mark, resulting in the curve being divided into two separate segments in the entorhinal, the amygdala, the cerebellum, and the ventricles. Two different segments are also visible in the precuneus TAC, although subtly. IO-MC TACs showed a small, localized, discontinuity at the same one-hour mark for the cerebellum gray matter, lateral ventricle, and the third ventricle regions. The rest of the time points and the regions show almost the same results for the IO- and II- MC methods. We also show the registration parameters of the short snaps to the CT reference as a function of time for the two hours post-injection in Fig. 2. The temporal evolution of these parameters confirms that there was indeed a large-scale movement in the 60–65 min frame. This also led to a notable mismatch between the PET data and the attenuation map derived from the CT acquired at the beginning of the scan. Even if the motion subsided in the second part of the scan, the registration mismatch between the PET and the CT remained present, leading to two segments in the TACs generated from the ‘standard’ processing, seen in Fig. 1. Since both IO- and II- MC correct for motion between PET and CT, the TACs are similar except for the frame with meaningful intra-frame motion. The images obtained for ‘standard’, IO-MC, and II- MC (between 55 and 70 minutes) are shown in Fig. 3. The middle frame (60–65 min) when motion occurred was very blurry in the image from the ‘standard’ method because the subject held two different positions for similar durations (based on the motion parameters in Fig. 2). Correcting the misregistration between PET and CT improved the image quality as seen in the image from the IO-MC method, although a shadow from the intra-frame motion remains. All artifacts had disappeared in the II-MC image. In the subsequent motion-free frame (65–70 min), both IO-, and II- MC images look as expected, whereas the ‘standard’ image has significant artifacts due to the inaccurate attenuation correction. We computed the DVR in the entorhinal, inferior temporal, precuneus, and amygdala regions for the three methods. Once again, both IO- and II- MC values show tremendous improvement compared to the ‘standard’ results in the entorhinal, inferior temporal, and amygdala regions. The MRTM2 model fit failed completely for the amygdala ‘standard’ TAC. The ‘standard’ DVR was 349% and 83% higher than II-MC in the entorhinal and the inferior temporal region. The obtained DVR values for the ‘standard’ method are much higher than the normal range for a 55-year-old cognitively normal individual. They are undoubtedly the product of motion. In Fig. 4, we show the longitudinal DVR from the 4 scans acquired on this subject for IO- and II- MC methods. The DVR values for the fourth time point are similar, which was expected from the similar TACs shown in Fig. 1. Although the fourth scan exhibited important intra-frame motion, it only happened in one frame, thus influencing only one point in the TACs leading to a negligible difference in the DVR. We noted a 4% increase in the entorhinal DVR of the first scan after adding intra-frame motion correction. The inferior temporal, precuneus, and amygdala regions registered a 2%, 2%, and 1% increases, respectively. These small differences are attributed to intra-frame motion since the subject moved frequently during the first scan, as well: up to 6 mm in translation and 8° in rotation.
Fig. 1.

Time activity curves for a clinically normal subject in four “hot” regions where tau accumulation is high in early AD (a), and four “cold” regions where there is no specific binding (b).
Fig. 2.

The rotation (a) and translation (b) parameters for the two-hour scan presented in Fig. 1, relative to the CT scan acquired at the beginning of the study.
Fig. 3.
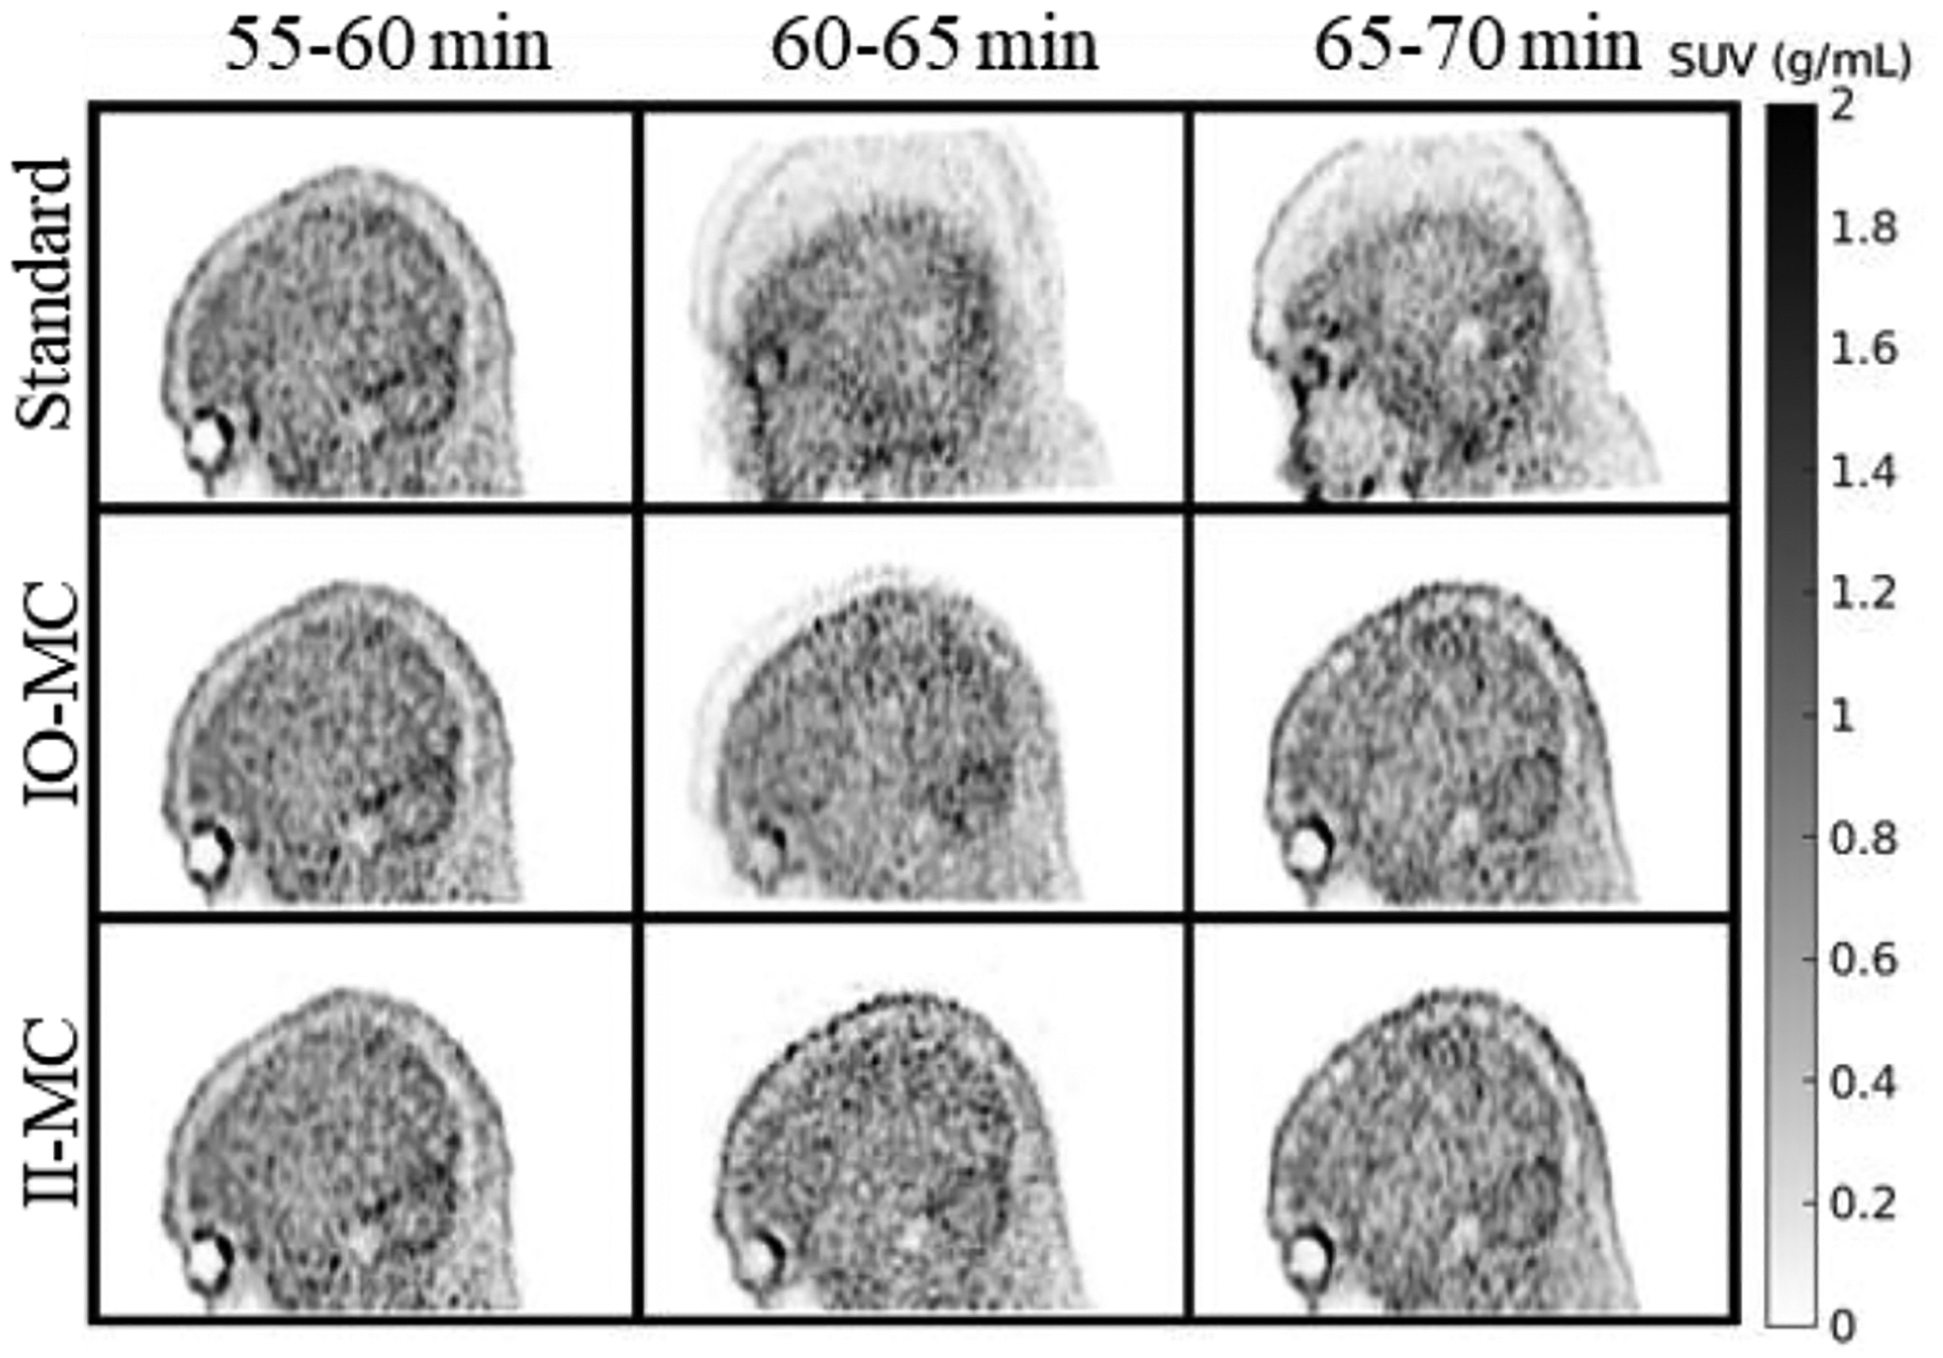
‘Standard’, IO-MC, and II-MC reconstructed images for frames between 55 and 70 minutes from the same scan presented in Fig. 1.
Fig 4.

Longitudinal DVR for the subject presented in Fig 1.
The second case study, presented in Fig. 5, concerns a 65-year-old woman with an AD diagnosis. The motion parameters for the two-hour acquisition are plotted on the left panel of the figure. They show important motion in the last 20 minutes of the scan. The frame between 100 and 105 min was particularly ridden with a large translation on the Z-axis. On the right panel of the figure, we show a slice from this frame after IO-MC (top) and II-MC (bottom) with a zoom on a high intensity region. The image from the II-MC method seems to reveal more structural details of the brain regions, suggesting that II-MC makes the signal more concentrated within the regions of interest. This leads to better quantification compared to the IO-MC image, which has blurred region edges due to intra-frame motion. The DVR for IO-MC in the inferior temporal region was 3.6 compared to the II-MC DVR of 4.1, which translated to an increase of ~14% by applying intra-frame motion correction. Although the ground truth of DVR in the region is unknown, the high deposition of tau protein in the regions, aided by the subject’s diagnosis, in addition to the important motion revealed by the registration parameters, all seem to indicate that the higher II-MC DVR is a better estimate.
Fig. 5.

(a) The rotation and translation parameters for the scan from the second case study. (b) Images from IO- (top) and II-(bottom) reconstruction of the frame 100–105 min of the same scan and a zoom on a high tau deposition region.
B. Statistical analysis
In the scatter plots shown in Fig. 6, we compare the DVR values computed for IO-MC and II-MC methods for all 83 scans across 34 subjects in four brain regions: entorhinal, inferior temporal, precuneus, and amygdala. Overall, both approaches yielded comparable results.
Fig. 6.

DVR values for all scans with and without intra-frame motion correction (II-MC/IO-MC).
Tables II and III summarize the results of the paired t-tests comparing the DVR from the IO-MC and II-MC methods in the CN and MCI/AD groups, respectively.
TABLE II.
T-TEST RESULTS SUMMARY (CN GROUP)
| Region | DVR IO-MC (mean ± std) |
DVR II-MC (mean ± std) |
p-value |
|---|---|---|---|
| Entorhinal | 1.19 ± 0.61 | 1.19 ± 0.60 | 1.00 |
| Hippocampus | 0.83 ± 0.25 | 0.83 ± 0.24 | 0.92 |
| Fusiform | 1.20 ± 0.72 | 1.19 ± 0.69 | 0.29 |
| Inferior Temporal | 1.35 ± 1.05 | 1.34 ± 0.99 | 0.50 |
| Parahippocampal | 1.13 ± 0.56 | 1.12 ± 0.54 | 0.52 |
| Lateral Occipital | 1.24 ± 0.44 | 1.23 ± 0.42 | 0.02* |
| Inferior Parietal | 1.35 ± 1.42 | 1.31 ± 1.22 | 0.10 |
| Cuneus | 1.04 ± 0.18 | 1.03 ± 0.17 | 0.28 |
| Lingual | 1.03 ± 0.19 | 1.02 ± 0.18 | 0.43 |
| Precuneus | 1.06 ± 0.67 | 1.05 ± 0.63 | 0.18 |
| Rostral middle frontal | 0.95 ± 0.35 | 0.94 ± 0.34 | 0.17 |
| Precentral | 0.89 ± 0.22 | 0.88 ± 0.19 | 0.32 |
| Pericalcarine | 0.97 ± 0.13 | 0.97 ± 0.12 | 0.33 |
| Insula | 0.80 ± 0.15 | 0.80 ± 0.15 | 0.93 |
| Amygdala | 0.91 ± 0.55 | 0.91 ± 0.53 | 0.83 |
TABLE III.
T-TEST RESULTS SUMMARY (MCI/AD GROUP)
| Region | DVR IO-MC (mean ± std) |
DVR II-MC (mean ± std) |
p-value |
|---|---|---|---|
| Entorhinal | 1.97 ± 1.05 | 2.00 ± 1.10 | 0.39 |
| Hippocampus | 1.38 ± 0.69 | 1.38 ± 0.69 | 0.56 |
| Fusiform | 2.29 ± 1.40 | 2.38 ± 1.48 | 0.19 |
| Inferior Temporal | 2.81 ± 2.07 | 2.89 ± 2.13 | 0.22 |
| Parahippocampal | 1.71 ± 0.73 | 1.74 ± 0.75 | 0.10 |
| Lateral Occipital | 2.57 ± 2.07 | 2.61 ± 2.13 | 0.35 |
| Inferior Parietal | 2.99 ± 2.94 | 3.05 ± 3.00 | 0.05* |
| Cuneus | 1.67 ± 1.12 | 1.79 ± 1.34 | 0.39 |
| Lingual | 1.79 ± 1.10 | 1.83 ± 1.14 | 0.45 |
| Precuneus | 2.59 ± 2.82 | 2.60 ± 2.81 | 0.34 |
| Rostral middle frontal | 2.12 ± 1.78 | 2.18 ± 1.85 | 0.30 |
| Precentral | 1.40 ± 0.86 | 1.43 ± 0.91 | 0.30 |
| Pericalcarine | 1.12 ± 0.18 | 1.12 ± 0.18 | 0.78 |
| Insula | 1.16 ± 0.42 | 1.18 ± 0.44 | 0.17 |
| Amygdala | 1.76 ± 1.16 | 1.78 ± 1.21 | 0.41 |
For the CN group, the t-test indicated a significant difference between the two methods in the lateral occipital region (p < 0.05). For the MCI/AD group, the t-test indicated a significant difference between the two methods in the inferior parietal region (p < 0.05). No other statistically significant differences were observed.
C. Computational Resources
The processing was performed on a 24-core Intel® Xeon® Gold 6342 CPU, with Intel® hyper-threading technology leading to 48 available threads. The computing was distributed on 12 parallel threads, so that 4 scans were reconstructed at the same time. We noted the computational time needed for each approach for one subject using 12 parallel threads on one CPU: it took about 13 and 36 hours for the IO-MC and II-MC reconstructions, respectively. In the II-MC method, the motion estimation step took less than 90 minutes to process 2 hours of PET data. The bulk of the computation happened in the motion correction step, where the sensitivity image needed to be produced for each frame, requiring multiple calculations based on the automatic grouping of the different poses in the frame. The number of sensitivity image calculations increased with the motion level detected in the frame.
IV. Discussion
We investigated the effect of intra-frame motion correction on DVR quantification in a large dataset of [18F]-MK6240 PET studies. We applied the ultra-fast list-mode reconstruction for intra-frame motion estimation in each frame, followed by another list-mode reconstruction accounting for the estimated motion fields. Moreover, inter-frame motion correction was achieved by registering the frames to a common reference. The ultra-fast list-mode-based motion correction method has been previously validated in static phantom imaging, where motion was artificially introduced and then measured with optical tracking [19]. In this work, we demonstrated the feasibility of applying the same method to dynamic imaging with the following strategy. First, motion estimation has been performed in each frame separately to ensure that the snaps are similar regarding the tracer distribution. Second, the reference snap was set to the middle of each frame, as such, the maximum time elapsed between any snap to be registered and the reference was less than 1 minute in the first 30 minutes and 2.5 minutes in the remaining 90 minutes, where the tracer distribution changed more slowly. Finally, the motion correction was not applied to the very early frames (between 0 and 90 seconds) because they did not always exhibit enough signal for image registration (for both intra- and inter- frame registration). Our criterion for the frame to be included in the processing was based on the number of detected events in that frame: if the number of events was under 1.5M, then the frame is ignored. This overall strategy worked for estimating motion in a dynamic acquisition since the registration yielded good results in both early and later frames across all scans.
We chose to estimate the clearance rate constant from the reference region to plasma () for each scan by applying the MRTM model and focusing on high-binding regions. When the population-based estimate was used for all the scans, inaccurate DVR values were obtained for two MCI subjects with high tau burden (SUVR > 3 in most hot regions). A better estimate for these subjects was found at . One drawback of using a scan-specific estimate for the clearance rate constant is that the estimate can be different for IO- and II-MC methods because it is based on the TACs. Since the DVR depends on this estimate, any differences in DVR between the two methods could be in part caused by the different estimates of the clearance rate constant. In the case study presented in Fig. 5, the DVR in the inferior temporal region was estimated at 3.6 and 4.1 with IO-MC (with ) and II-MC (with ), respectively, i.e. an increase of 14% after applying intra-frame motion correction. However, when estimating the DVR using the same population-based value for both methods, the results barely change: a 13% increase from IO-MC DVR of 4.39 to II-MC DVR of 4.95 in the inferior temporal region. In this case, the difference in DVR values is indeed due to the intra-frame motion. It was not caused by the two differing estimates for the clearance rate constant used in the MRTM2 model.
In this work, we wanted to focus on the effect of intra-frame motion correction. To do so, we proposed the II-MC method where both inter- and intra- frame motion corrections are performed. The latter was achieved by incorporating the registration parameters between ultra-short snaps in the frame. We then disabled the registration between the snaps during image reconstruction to generate inter-frame motion-corrected images (IO-MC) for comparison to our proposed method. As such, in this implementation, IO-MC still corrects for any potential mismatch between the attenuation map derived from the CT scan and the PET data of each frame. By choosing this implementation for IO-MC and comparing it to our proposed II-MC, we truly isolate the effect of intra-frame motion correction since both mismatches among the frames and between the frames and the CT are already corrected.
As stated in the Results section, intra-frame motion correction did not change the DVR quantification in most cases. Out of the 15 regions surveyed, only 1 showed significantly lower DVR (p < 0.05) in scans of CN individuals after applying intra-frame motion correction. The same result was observed in the MCI/AD group, albeit for a different region. Our results suggest that inter-frame motion correction alone can provide accurate DVR estimates in most cases. In Fig. 1–4, we showed a case with important intra-frame motion that led to blurring in the IO-MC image where two positions of the subject’s head were visible. It was still possible to get a reasonable estimate of the SUV in the surveyed regions: the bias introduced by motion was not large enough to cause a drastically different DVR value. Indeed, the DVR, our measured outcome, is a regional measure based on all 54 frames and robust to noisy SUV estimates. Even if motion affects a few frames, leading to slightly different SUVs and therefore TACs, a global fit on all frames can still yield almost the same value for DVR. Additionally, motion can be present in the frames without changing the SUV’s estimates. Considering that the SUV is determined by averaging the PET signal in regions, the effect of a displacement of 3–4mm (2–3 voxels) can easily vanish for a region of over 4000 voxels such as the inferior temporal region. Finally, given the fact that PET quantitation is weighted by counts, only specific motion patterns can greatly degrade the IO-MC image quality. To cause noticeable blurring in the frame, the motion needed to be important (displacement caused by the motion several times the voxel size) and sustained (at least two different positions in the frame, each lasting several seconds). Often, the motion magnitude was small (only a few millimeters), so there was no visible difference in the image and no quantified difference in region-wise values such as SUV or DVR. Also, when motion was very brief (the new position was held for a few seconds before the subject went back to their initial position), the motion artifacts were negligible because the number of events acquired when motion occurred is a small fraction of the total number of events in the frame. When intra-frame motion is brief or small in magnitude, inter-frame motion correction is enough to yield accurate quantification.
Considering the similar results obtained for IO- and II- MC reconstruction, it is worth noting that II-MC requires 279% of the computational time of IO-MC. Potential optimization strategies include the allocation of more resources to simultaneously process more scans and the implementation of GPU-based parallel computation for the iterative reconstruction process, namely the forward-projection and back-projection steps. While the reconstructions presented here took a few weeks to complete on a 24-core Intel® Xeon® Gold 6342 CPU, they involved pre-existing 83 datasets acquired over 4 years. The added benefit of more accurate quantitation eclipses the computation cost, especially when considering the overall cost of the data acquisition. In longitudinal studies, which are even more expensive to obtain, the chance of motion negatively affecting the outcome increases with the number of scans. II-MC is therefore as a highly valuable processing method since it offers confidence in PET quantitation for all the images acquired at different time points, and consequently confidence in the measurement of the longitudinal outcome.
V. Conclusion
Motion is an inevitable part of dynamic [18F]-MK6240 PET imaging. In this work, we applied an intra- and inter- frame motion correction (II-MC) approach to each frame of the dynamic acquisitions in 83 scans across 34 subjects. To focus on the effect of intra-frame motion correction, we also implemented inter-frame only motion correction (IO-MC) and measured the obtained DVR for both methods. Similar DVR results were obtained for the majority of the studies, but not all. For one scan of an AD subject, the inferior temporal region exhibited significantly higher DVR with II-MC compared to IO-MC, which was reasonable considering the AD diagnosis, although similar results were not obtained for other regions. Our research demonstrated the feasibility of intra-frame motion correction in dynamic PET imaging. However, its impact was not consistently discernible given that the DVR, a region-based measure, is determined by the contribution of 54 frames, rendering it very robust to noise in the SUV estimates introduced by intra-frame motion in one or a few frames. Even in the absence of dramatic differences when applying II-MC, it is a valuable tool as it ensures accurate PET quantitation with only added computation cost that remains negligible considering the high value of the acquired datasets, especially for longitudinal studies.
Acknowledgments
This work was supported in part by grants P41EB022544, R01AG076153, R01EB035093, T32EB013180, and P01AG036694 from NIH.
Footnotes
Conflict of Interest Statement
The authors have no conflict of interest to report.
This work involved human subjects in its research. The human studies were approved by the institutional review board at Massachusetts General Hospital (Protocol number: 2021P003519) and all subjects provided informed consent. The research was conducted in accordance with the principles embodied in the Declaration of Helsinki and in accordance with local statutory requirements.
Contributor Information
Amal Tiss, Gordon Center for Medical Imaging, Department of Radiology, Massachusetts General Hospital, Boston, MA 02114 USA..
Yanis Chemli, Gordon Center for Medical Imaging, Department of Radiology, Massachusetts General Hospital, Boston, MA 02114 USA.; Department of Radiology and Biomedical Imaging, Yale University, New Haven, CT 06520 USA.
Nicolas Guehl, Gordon Center for Medical Imaging, Department of Radiology, Massachusetts General Hospital, Boston, MA 02114 USA.; Department of Radiology and Biomedical Imaging, Yale University, New Haven, CT 06520 USA.
Thibault Marin, Gordon Center for Medical Imaging, Department of Radiology, Massachusetts General Hospital, Boston, MA 02114 USA.; Department of Radiology and Biomedical Imaging, Yale University, New Haven, CT 06520 USA.
Keith Johnson, Gordon Center for Medical Imaging, Department of Radiology, Massachusetts General Hospital, Boston, MA 02114 USA..
Georges El Fakhri, Gordon Center for Medical Imaging, Department of Radiology, Massachusetts General Hospital, Boston, MA 02114 USA.; Department of Radiology and Biomedical Imaging, Yale University, New Haven, CT 06520 USA.
Jinsong Ouyang, Gordon Center for Medical Imaging, Department of Radiology, Massachusetts General Hospital, Boston, MA 02114 USA.; Department of Radiology and Biomedical Imaging, Yale University, New Haven, CT 06520 USA.
References
- [1].Hyman BT et al. , “National Institute on Aging-Alzheimer’s Association guidelines for the neuropathologic assessment of Alzheimer’s disease,” Alzheimers Dement., vol. 8, no. 1, pp. 1–13, Jan. 2012, doi: 10.1016/j.jalz.2011.10.007. [DOI] [PMC free article] [PubMed] [Google Scholar]
- [2].Jack CR et al. , “Hypothetical model of dynamic biomarkers of the Alzheimer’s pathological cascade,” Lancet Neurol., vol.9, no. 1, pp. 119–128, Jan. 2010, doi: 10.1016/S1474-4422(09)70299-6. [DOI] [PMC free article] [PubMed] [Google Scholar]
- [3].Hostetler ED et al. , “Preclinical Characterization of 18F-MK-6240, a Promising PET Tracer for In Vivo Quantification of Human Neurofibrillary Tangles,” J. Nucl. Med, vol. 57, no. 10, pp. 1599–1606, Oct. 2016, doi: 10.2967/jnumed.115.171678. [DOI] [PubMed] [Google Scholar]
- [4].Pascoal TA et al. , ”Longitudinal 18F-MK-6240 tau tangles accumulation follows Braak stages,” Brain, vol. 144, no. 11, pp. 3517–3528, Dec. 2021, doi: 10.1093/brain/awab248. [DOI] [PMC free article] [PubMed] [Google Scholar]
- [5].Guehl NJ et al. , “Evaluation of pharmacokinetic modeling strategies for in-vivo quantification of tau with the radiotracer [18F]MK6240 in human subjects,” Eur. J. Nucl. Med. Mol. Imaging, vol. 46, no. 10, pp. 2099–2111, Sep. 2019, doi: 10.1007/s00259-019-04419-z. [DOI] [PMC free article] [PubMed] [Google Scholar]
- [6].Kyme AZ and Fulton RR, “Motion estimation and correction in SPECT, PET and CT,” Phys. Med. Biol, vol. 66, no. 18, Sep. 2021, Art. no. 18TR02. doi: 10.1088/1361-6560/ac093b. [DOI] [PubMed] [Google Scholar]
- [7].Rahmim A, Rousset O, and Zaidi H, “Strategies for Motion Tracking and Correction in PET,” PET clinics, vol. 2, no. 2, pp.251–266, Apr. 2007, doi: 10.1016/j.cpet.2007.08.002. [DOI] [PubMed] [Google Scholar]
- [8].Ikari Y et al. , “Head motion evaluation and correction for PET scans with 18F-FDG in the Japanese Alzheimer’s disease neuroimaging initiative (J-ADNI) multi-center study”, Annals of nuclear medicine, vol. 26, no. 7, pp 535–544, Aug. 2012, doi: 10.1007/s12149-012-0605-4. [DOI] [PubMed] [Google Scholar]
- [9].Costes N, Dagher A, Larcher K, Evans AC, Collins DL, and Reilhac A, “Motion correction of multi-frame PET data in neuroreceptor mapping: simulation based validation,” Neuroimage, vol. 47, no. 4, pp. 1496–1505, Oct. 2009, doi: 10.1016/j.neuroimage.2009.05.052. [DOI] [PubMed] [Google Scholar]
- [10].Andersson JL, Vagnhammar BE, and Schneider H, “Accurate attenuation correction despite movement during PET imaging,” J. Nucl. Med, vol. 36, no. 4, pp. 670–678, Apr. 1995. [PubMed] [Google Scholar]
- [11].Ye H et al. , ”Automated movement correction for dynamic PET/CT images: evaluation with phantom and patient data,” PLoS One, vol. 9, no. 8, Aug 2014, Art. no. e103745, doi: 10.1371/journal.pone.0103745. [DOI] [PMC free article] [PubMed] [Google Scholar]
- [12].Woo J et al. , “Automatic 3D registration of dynamic stress and rest (82)Rb and flurpiridaz F 18 myocardial perfusion PET data for patient motion detection and correction,” Med. Phys, vol. 38, no. 11, pp. 6313–6326, Nov. 2011, doi: 10.1118/1.3656951. [DOI] [PMC free article] [PubMed] [Google Scholar]
- [13].Bloomfiled PM et al. , “The design and implementation of a motion correction scheme for neurological PET,” Phys. Med. Biol, vol. 48, no. 8, pp. 959–978, Apr. 2003, doi: 10.1088/0031-9155/48/8/301. [DOI] [PubMed] [Google Scholar]
- [14].Markiewicz PJ et al. , “Rapid processing of PET list-mode data for efficient uncertainty estimation and data analysis,” Phys. Med. Biol, vol. 61, no. 13, pp. N322–N336, Jul. 2016, doi: 10.1088/0031-9155/61/13/N322. [DOI] [PubMed] [Google Scholar]
- [15].Lu Y et al. , “Data-Driven Motion Detection and Event-by-Event Correction for Brain PET: Comparison with Vicra,” J. Nucl. Med, vol. 61, no. 9, pp. 1397–1403, Sep. 2020, doi: 10.2967/jnumed.119.235515. [DOI] [PMC free article] [PubMed] [Google Scholar]
- [16].Sun T et al. , “Body motion detection and correction in cardiac PET: Phantom and human studies,” Med. Phys, vol. 46, no. 11, pp. 4898–4906, Nov. 2019, doi: 10.1002/mp.13815. [DOI] [PMC free article] [PubMed] [Google Scholar]
- [17].Thielemans K, Schleyer P, Dunn J, Marsden PK, and Manjeshwar RM. “Using PCA to detect head motion from PET list mode data,” in IEEE NSS/MIC, Seoul, South Korea, 2013, doi: 10.1109/NSSMIC.2013.6829254. [DOI] [Google Scholar]
- [18].Spangler-Bickell MG, Deller TW, Bettinardi V, and Jansen F. “Ultra-Fast List-Mode Reconstruction of Short PET Frames and Example Applications,” J. Nucl. Med, vol. 62, no. 2, pp. 287–292, Feb. 2021, doi: 10.2967/jnumed.120.245597. [DOI] [PubMed] [Google Scholar]
- [19].Tiss A et al. , “Impact of motion correction on [18F]-MK6240 tau PET imaging,” Phys. Med. Biol, vol. 68, no. 10, May 2023, Art. no. 105015, doi: 10.1088/1361-6560/acd161. [DOI] [PMC free article] [PubMed] [Google Scholar]
- [20].Chen KT et al. , ”MR-assisted PET motion correction in simultaneous PET/MRI studies of dementia subjects,” J Magn Reson Imaging, vol. 48, no. 5, pp 1288–1296, Nov. 2018, doi: 10.1002/jmri.26000. [DOI] [PMC free article] [PubMed] [Google Scholar]
- [21].Ehman RL and Felmlee JP, “Adaptive technique for high-definition MR imaging of moving structures,” Radiology, vol. 173, no. 1, pp. 255–263, Oct. 1989, doi: 10.1148/radiology.173.1.2781017. [DOI] [PubMed] [Google Scholar]
- [22].Wang Y, Grimm RC, Felmlee JP, Riederer SJ, and Ehman RL, “Algorithms for extracting motion information from navigator echoes,” Magn Reson Med., vol. 36, no. 1, pp 117–123, Jul. 1996, doi: 10.1002/mrm.1910360120. [DOI] [PubMed] [Google Scholar]
- [23].van der Kouwe AJ, Benner T, and Dale AM, “Real-time rigid body motion correction and shimming using cloverleaf navigators,” Magn. Reson. Med, vol. 56, no. 5, pp 1019–1032, Nov. 2006, doi: 10.1002/mrm.21038. [DOI] [PubMed] [Google Scholar]
- [24].Huang C, Ackerman JL, Petibon Y, Brady TJ, El Fakhri G, and Ouyang J. “MR-based motion correction for PET imaging using wired active MR microcoils in simultaneous PET-MR: Phantom study,” Med Phys, vol. 41, no. 4, Apr. 2014, Art. no. 041910, doi: 10.1118/1.4868457. [DOI] [PMC free article] [PubMed] [Google Scholar]
- [25].Huang C et al. , ”Motion compensation for brain PET imaging using wireless MR active markers in simultaneous PET-MR: Phantom and non-human primate studies,” Neuroimage, vol. 91, pp 129–137, May 2014, doi: 10.1016/j.neuroimage.2013.12.061. [DOI] [PMC free article] [PubMed] [Google Scholar]
- [26].Ichise M et al. , “Linearized reference tissue parametric imaging methods: application to [11C]DASB positron emission tomography studies of the serotonin transporter in human brain,” J. Cereb. Blood Flow Metab, vol. 23, no. 9, pp. 1096–1112, Sep. 2003, doi: 10.1097/01.WCB.0000085441.37552.CA. [DOI] [PubMed] [Google Scholar]
- [27].Fischl B, “FreeSurfer,” Neuroimage, vol. 62, no. 2, pp. 774–781, Aug. 2012, doi: 10.1016/j.neuroimage.2012.01.021. [DOI] [PMC free article] [PubMed] [Google Scholar]
- [28].Becker JA et al. , “Amyloid-β associated cortical thinning in clinically normal elderly,” Ann. Neurol, vol. 69, no. 6, pp. 1032–1042, Jun. 2011, doi: 10.1002/ana.22333. [DOI] [PMC free article] [PubMed] [Google Scholar]
- [29].Spangler-Bickell MG et al. , “Optimizing the frame duration for data-driven rigid motion estimation in brain PET imaging,” Med. Phys, vol. 48, no. 6, pp. 3031–3041, Jun. 2021, doi: 10.1002/mp.14889. [DOI] [PMC free article] [PubMed] [Google Scholar]
- [30].Mattes D, Haynor DR, Vesselle H, Lewellyn TK, and Eubank W, “Nonrigid multimodality image registration,” in Proc. SPIE Medical Imaging 2001, San Diego, CA, USA, 2001, doi: 10.1117/12.431046. [DOI] [Google Scholar]
- [31].Lowekamp BC, Chen DT, Ibáñez L, and Blezek D, “The design of SimpleITK,” Front. Neuroinform, vol. 7, Dec. 2013, Art. no. 45, doi: 10.3389/fninf.2013.00045. [DOI] [PMC free article] [PubMed] [Google Scholar]
- [32].Avants BB, Tustison NJ, Song G, Cook PA, Klein A, and Gee JC, “A reproducible evaluation of ANTs similarity metric performance in brain image registration,” Neuroimage, vol. 54, no. 3, pp. 2033–2044, Feb. 2011, doi: 10.1016/j.neuroimage.2010.09.025. [DOI] [PMC free article] [PubMed] [Google Scholar]