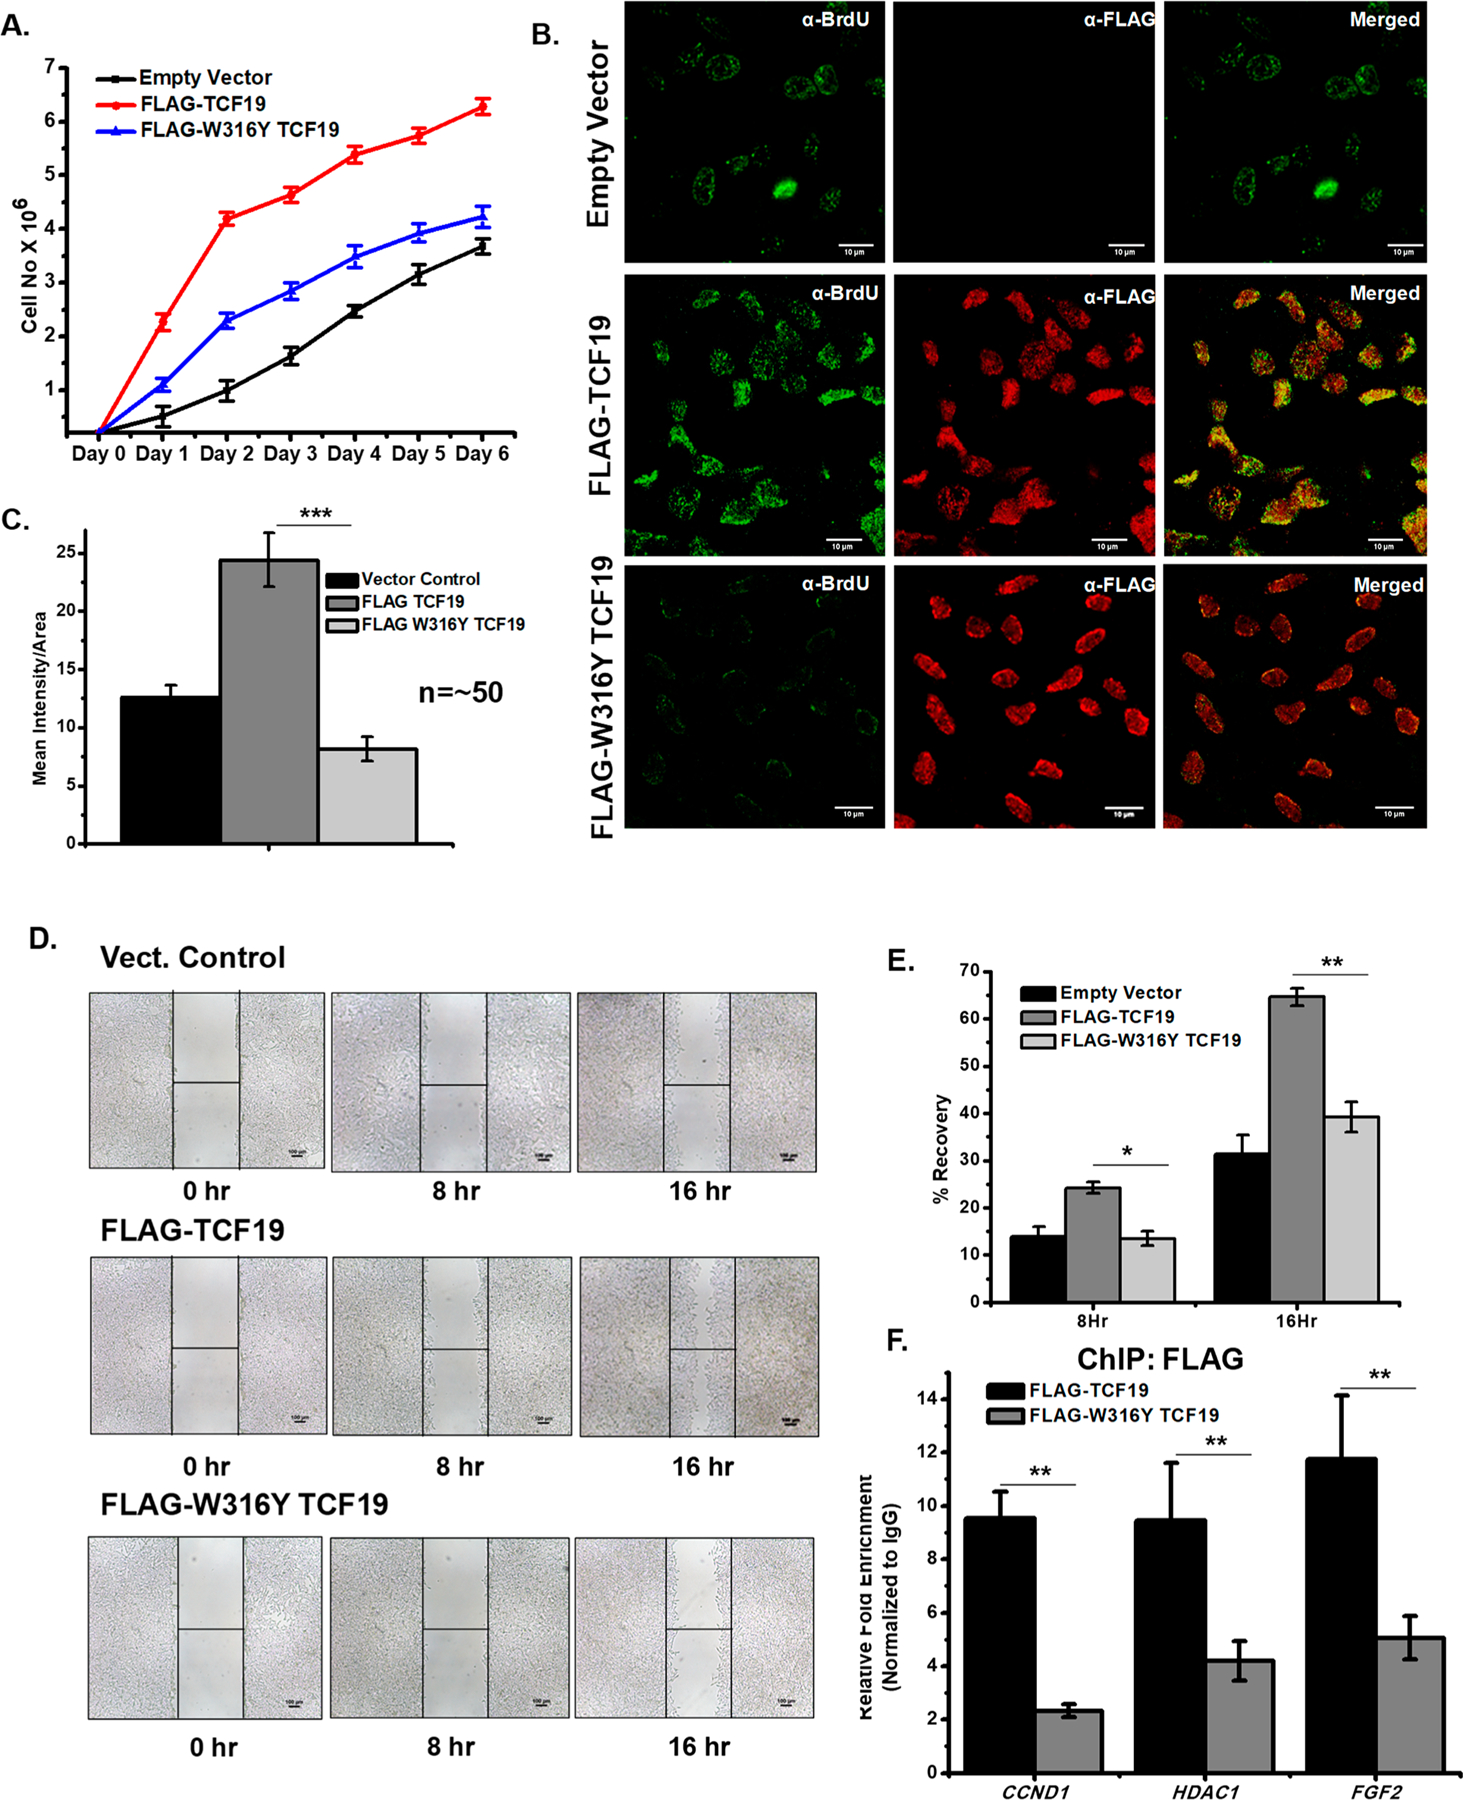
Figure 5.

(A) Cell proliferation assay by the cell number counting technique. FLAG-TCF19 overexpressed cells (red) proliferate at a rate higher than those of FLAG-W316Y TCF19 (blue) overexpressed and control (black) cells. (B) BrdU incorporation assay by confocal microscopy measurement also showed a lower rate of proliferation in FLAG-W316Y TCF19 overexpressed cells compared to WT FLAG-TCF19 overexpressed cells. (C) Quantification of the microscopy data (n ∼ 50). (D) Wound healing assay showing decreases in the rate of proliferation in the case of FLAG-W316Y TCF19 overexpressed cells compared to FL FLAG-TCF19 overexpressed cells. (E) Quantification of recovery by wound healing. (F) ChIP qRT-PCR analysis shows a high occupancy of TCF19 on cell proliferation genes, while the W316Y mutation in TCF19 reduces its occupancy on the same targets.
