
Fig. 1. Differentiation between Hardy and Ubiquitous strains is localized in the genome.
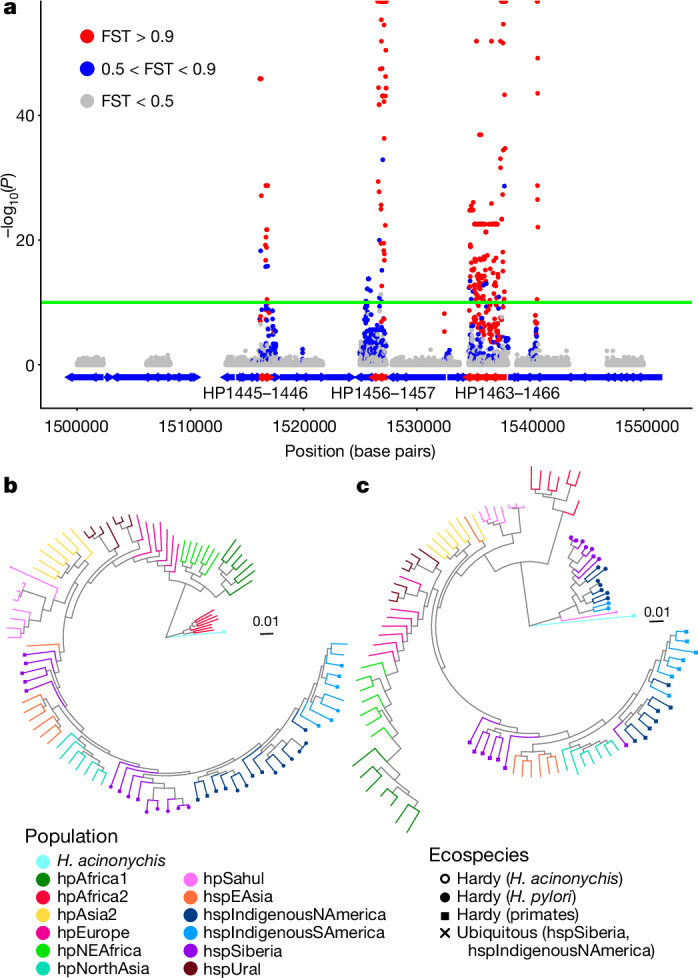
a, Manhattan plot from GWAS analysis of Hardy versus Ubiquitous strains from hspSiberia and hspIndigenousNAmerica (zoomed in between 1.50 and 1.55 megabase pairs; full plot shown in Extended Data Fig. 5). Genes are indicated by blue and red (differentiated genes) arrows. Green line indicates significance threshold (−log10(P) = 10, which is based on a Bayesian Wald test with a Bonferroni correction for multiple testing, using a significance threshold before correction of 3 × 10⁻⁵, and 285,792 tested SNPs). Points are coloured based on FST (fixation index) values; half-points at the top of the plot indicate estimated P = 0 and FST = 1. HP1445 and so on are H. pylori genes based on the annotation of the 26695 strain. b,c, Phylogenetic trees for undifferentiated (b) and differentiated (c) genes from a representative subset of strains (see Extended Data Fig. 2b,c for trees of the whole dataset). Branches are coloured based on population. Strains from the Hardy clade are indicated by a filled circle at the end of the branch.