

Abstract

Liver 3D cell models are regularly employed as a screening platform for predicting the metabolic safety of drugs, by monitoring the physiological responses of the spheroids, through the measurement of relevant markers of normal liver physiology, notably glucose. Measuring glucose levels within the spheroids and their surroundings provides insight into the metabolic homeostasis of liver cells and may be employed as an indication of potential drug-induced toxicity. Several ortho-aminomethyl phenylboronic acid (PDBA) glucose sensors have been developed. Most recently, Mc-CDBA ((((((2-(methoxycarbonyl)anthracene-9,10-diyl)bis(methylene)) bis(methylazanediyl))bis(methylene))bis(4-cyano-2,1-phenylene))diboronic acid) was reported. Although Mc-CDBA exhibits good water solubility and sensitivity toward glucose, its ability for intra- and extracellular glucose monitoring in spheroids has not been determined. Here, we present a set of Mc-CDBA derivatives: carboxylic (BA) and amide (BA 5)-based Mc-CDBA sensors for extra- and intracellular glucose monitoring, respectively. Both sensors exhibit superior spectroscopic features. BA 5 showed selective intracellular accumulation in liver spheroids and exhibited more than 3-fold higher basal fluorescence sensitivity compared to Mc-CDBA. These observations led to the development of an extracellular hydrogel-embedded sensor (HG-BA 21) to monitor extracellular glucose levels under persistent solution flow mimicking physiological conditions. We have therefore demonstrated that the sensors developed by our team are suitable for a variety of assays, notably with liver spheroids, and provide powerful new tools for organ-on-a-chip applications predicting drug-induced liver injury in the early stages of drug development.
Introduction
In recent years, human hepatocytes grown in a 3D culture, in plates or microfluidic devices, have emerged as suitable replacements for animal models for testing drug toxicity and safety. Moreover, testing human cells that are arranged in spheroids may reduce animal-to-human variability.1,2 Unlike 2D cultures, 3D spheroids enable the growth of primary hepatocytes together with other types of liver cells to better reflect their native surroundings. They can be grown for several weeks, allowing for continuous evaluation of oxidation and metabolism of various drugs over time.3,4 A 3D liver culture can also sustain progressive cellular damage instigated directly by exposure to drugs or degradation products. Such cellular damage can manifest at the organ level, often denoted as drug-induced liver injury (DILI), and is the primary reason for both the failure of drugs to reach the market and the withdrawal of approved drugs.5,6
Mitochondria are often the target of drug-induced cellular damage and the leading cause of DILI, likely due to their pivotal role in cellular metabolism, energy production, and apoptosis.7,8 The mechanisms of drug-induced mitochondrial damage include nonselective membrane permeabilization, impaired oxidative phosphorylation, inhibition of fatty acid oxidation, and mitochondrial DNA depletion.8,9 Therefore, careful monitoring of mitochondrial activity, integrity, and dysfunction in 3D liver systems may help to identify DILI-inducing candidates during the early stages of drug development. One reliable indicator of mitochondrial damage is the switch in cellular energy production from oxidative phosphorylation to less efficient glycolysis, resulting in the depletion of glucose levels. Hence, continuous monitoring of cellular glucose concentrations might indicate mitochondrial dysfunction instigated by drug toxicity.
The liver is also involved in de novo glucose synthesis in the body (gluconeogenesis),10 and abnormalities in glucose synthesis within cells can also be employed as an indirect measure of drug-induced toxicity.11 As such, reliable, continuous, and noninvasive monitoring of glucose levels within hepatocytes remains a highly sought-after feature.
To date, several in vitro glucose-sensing technologies have been developed, such as enzyme-based electrodes,12,13 amperometric sensors,14 colorimetric assays,15 and microfabricated sensors.16 However, emerging intensiometric optical probes, which are small organic dyes that exhibit changes in fluorescence emission as a function of glucose levels,17 appear to be more desirable. This is due to their ability to be applied directly to cells, enabling continuous monitoring of changes in glucose levels at high spatiotemporal resolutions. Moreover, these probes do not require dedicated microfluidic devices, careful calibrations, or persistent maintenance. Fluorescent sensors are also more stable compared with enzymatic electrodes and can be easily monitored by fluorescence microscopy and plate readers, as opposed to more dedicated and specialized instruments.
The most commonly used fluorescent sensors in the detection of saccharides, and other diols, are typically based on a phenylboronic acid moiety that reversibly binds to 1,2 or 1,3-dihydroxyl compounds to form borate esters.18−20 The presence of an aminomethyl group in the ortho position to the boronic acid moiety provides increased sensing capability through improved binding affinity.21 Many research studies have shown that the incorporation of ortho-aminomethyl phenylboronic acid moieties into different chemical sensors improves selectivity, affinity, the growth of the quantum yield, as well as red-shifted emissions.19,22−29
Based on a previously designed glucose sensor denoted Mc-CDBA,30,31 we developed diboronic acid derivatives BA, BA 5, and HG-BA 21 in an effort to generate fluorescent probes that can be used for continuous glucose monitoring in both intra- and extracellular environments. Moreover, hydrogel embedment provides a supportive environment that maintains the sensor’s functionality and enhances its biocompatibility, allowing glucose sensing under flow, making it a reliable tool for continuous monitoring in dynamic biological systems, e.g., organ-on-a-chip platforms.
Experimental Section
Synthetic Procedures for Diboronic Acid Probe Derivatives
For details regarding the specific synthetic procedures and materials used in generating boronic acid-based probes 3,3′-((anthracene-9,10-diylbis(methylene))bis((2-borono-5-(trifluoromethyl)benzyl)azanediyl))dipropionic acid (BA), ((((anthracene-9,10-diylbis(methylene))bis(methylazanediyl))bis(methylene))bis(4-(trifluoromethyl)-2,1-phenylene))diboronic acid (BA 2), ((((anthracene-9,10-diylbis(methylene))bis((3-methoxy-3-oxopropyl)azanediyl))bis(methylene))bis(4-(trifluoromethyl)-2,1-phenylene))diboronic acid (BA 3), 3,3′-((anthracene-9,10-diylbis(methylene))bis((2-borono-5-nitrobenzyl) azanediyl))dipropionic acid (BA 4), ((((anthracene-9,10-diylbis(methylene))bis((3-amino-3-oxopropyl)azanediyl)) bis(methylene))bis(4-(trifluoromethyl)-2,1-phenylene))diboronic acid (BA 5), ((((anthracene-9,10-diylbis (methylene))bis((7-aminoheptyl)azanediyl))bis(methylene)) bis(4-(trifluoromethyl)-2,1-phenylene))diboronic acid w or w/o hydrogel BA 21 (HG-BA 21), and (((((2-(methoxycarbonyl)anthracene-9,10-diyl) bis(methylene))bis(methylazanediyl))bis(methylene))bis(4-cyano-2,1-phenylene))diboronic acid (Mc-CDBA), refer to the companion manuscript to this work (Goldberg et al., ACS Omega).
Extracellular Glucose Sensing
Fresh probe solutions were made by adding known concentrations of glucose in InSight TOX Liver Medium w/o glucose (TLM) (pH 7.4, Catalog# CS-07–001a, InSphero AG) or PBS. Prepared solutions containing 0–100 mM glucose were added to a 96-well, half-area black plate with a clear, flat bottom (Cat. no. 3880, Corning Incorporated Life Sciences) at a final volume of 100 μL/well in quadruplets. A stock solution of 10 μL/well of 10 mM BA probe was added and mixed three times. After 30 min at room temperature (RT), the fluorescence intensity was recorded using a Cytation5 plate reader (excitation: 370 nm; emission: 430 nm).
Glucose Selectivity Assay
TLM with or without glucose was used to prepare 0–10 mM glucose, xylose, mannose, galactose, and sucrose media solutions, which were added (100 μL/well in quadruplicate per condition) to a 96-well, half-area black plate with a clear, flat bottom. BA probe (10 μL/well of 10 mM stock solution) was then added, and the mixture was mixed three times. After 30 min at RT, the fluorescence intensity was recorded using a Cytation5 plate reader.
pH-Dependent Glucose Recognition Assay
Solutions of TLM, w and w/o glucose, at pH 2–12, were prepared by adding 37% HCl and NaOH 1N solution (100 μL/well in quadruplicate per pH condition) to a 96-well, half-area black plate with a clear, flat bottom. Stock solutions of BA, BA 5, and Mc-CDBA probes (10 mM, 10 μL/well) were added and mixed three times. Following a 30-min incubation at RT, the fluorescence intensities were recorded by using a Cytation5 plate reader as described above.
Intracellular Glucose Sensing
Liver spheroid culture: 3D InSight Human Liver Microtissues containing primary human hepatocyte (PHH) and human Kupffer cell (HKC) (PHH:HKC ratio of 10:2) were provided by InSphero (InSphero AG). The human microtissues were incubated in an Akura 96 Spheroid Microplate with 70 μL 3D InSight Human Liver Maintenance Medium—AF per well at 37 °C and 5% CO2.
Liver Spheroid Probe Penetration Assay
BA 5 and Mc-CDBA probe solutions were freshly prepared by diluting the 20 mM DMSO stock solution in TLM w/o glucose to a 20 μM final probe concentration. The liver spheroids were washed three times with TLM w/o glucose and incubated with the BA 5 and Mc-CDBA probes at 20 μM for 2 h. The spheroids were then washed with TLM with glucose, and images were acquired daily for up to 5 days using a Thorlabs Widefield Microscope (Monochrome CMOS Camera, New Jersey, United States) and processed using ImageJ.
Cell Starvation Assay
Liver spheroids were cultured in Akura 96 Spheroid Microplates, stained with BA 5 (20 μM), and then cultured in glucose-free TLM or regular TLM for 5 days. The spheroids were imaged daily using a Laser Scanning Confocal Microscope (LSM-900-Meta detector, Zeiss, Germany) with 0.5% of a 405 nm laser.
Nefazodone Treatment Experiment
Liver spheroids were cultured in Akura 96 Spheroid Microplates and stained with BA 5 (20 μM) and MitoTracker CMTMRos (1 μM) for 2 h, washed, and treated w and w/o (32 μM) for 24 h. Spheroids (n = 3 from each group) were imaged by confocal microscopy using 0.8% of 405 nm and 0.8% of 561 nm for BA 5 and MitoTracker, respectively.
Confocal Imaging
Imaging was performed using a Zeiss Laser Scanning Confocal Microscope equipped with a spectrally resolved 32-pixel GaAsP detector array (LSM-900-Meta detector, Zeiss, Germany). The imaging was performed by bidirectional laser scanning, in a frame of 512/512 pixels with a zoom of 0.7, using a water immersion objective lens 20× [a water Plan-Apochromat objective lens; 20×/1.0 DIC, D = 0.17 (UV) VIS-IR M27 75 mm] with a focal spot diameter of 0.5 μm (D = 1.2 PC5 × λ/NA). Spheroids were imaged in PBS with a low-intensity laser to avoid bleaching. Images were taken using Z-stack mode (about 350 stacks) with intervals of 0.5 microns and represented as maximum intensity projection for all stacks. The fluorescence intensity was calculated using ZEN software, Zeiss (black edition).
Hydrogel-Embedded Glucose Recognition Assay
Solutions of 5 μL/well pre-UV-treated BA 21 hydrogel were placed in a 96-well, half-area black plate with a clear, flat bottom and UV-illuminated for 5 min. TLM w/o glucose was added at 100 μL/well for 24 h. Once the hydrogels were acclimated, solutions of TLM containing 0–100 mM glucose were added for 30 min at RT. Fluorescence intensity was recorded using a Cytation5 plate reader as described above. Similarly, hydrogel drops were exposed to TLM w and w/o glucose at pH from 2 to 12, and after 30 min, the samples were monitored using a Cytation5 plate reader.
Data Analysis
The fluorescence intensity (F) of confocal images was calculated and measured (in arbitrary units [a.u.]) by averaging ∼350 Z-stacks using the Zen software (Zeiss, black edition). Data are displayed as mean ± SEM (n = 4) unless otherwise indicated in the figure legends. Statistical analysis was carried out using GraphPad software. Significance was tested using multiple t tests and two-tailed t tests along with the Mann–Whitney test and normality test. Levels of significance were set at no significant difference (n.s.), *p < 0.05, **p < 0.01, ***p < 0.001, and ****p < 0.0001.
Results and Discussion
The BA probe was designed to improve water solubility by incorporating double carboxylic moieties to such an extent that they prevent the membrane permeability of the molecules. Thus, to engineer a membrane-permeable intracellular glucose probe, we introduced lipophilic amide residues onto BA (denoted BA 5). Finally, BA 21 was synthesized as an acrylate-based derivative for hydrogel embedding and immobilization of the water-soluble probe.
An Extracellular Glucose Probe
The mechanism of glucose recognition by our BA probes is based on the reversible interaction between 2-aminomethyl phenylboronic acid subunits and glucose. The tertiary amine is highly engaged in emission modulations via N–B interactions. The N–B bond is weak in the free boronic acid subunits, but the bond becomes stronger in the presence of the boronated ester formed upon binding to glucose. After the interaction, the nitrogen atom is more involved in the dative bond and the lone electron pair cannot participate in photoinduced electron transfer (PET) quenching.32 Consequently, the probe transitions from a dark to a fluorescent state following glucose binding (Figure 1A).
Figure 1.

Photophysical properties of the extracellular glucose probe (BA). (A) Schematic representation of the sensing mechanism of BA for glucose. (B) Linear relationship of the fluorescence intensity of BA (800 μM) vs different glucose concentrations in TLM (pH 7.4). (C) Fluorescence response of BA (100 μM) in response to glucose, xylose, mannose, galactose, and sucrose (0–10 mM). (D) pH-dependent (pH from 2 to 12) fluorescence emission intensity of BA (100 μM) in TLM ± glucose. Schematic representation of the proposed mechanism of the fluorescence sensing of BA for the turn-on detection of glucose. Data are presented as the mean ± SD (n = 4).
We first evaluated the analytical performance over the 0–10 mM glucose concentration range using a Benesi–Hildebrand plot, revealing a linear relationship between glucose concentrations and BA fluorescence intensity (Figure 1B). BA demonstrated a rapid and measurable signal even at low glucose concentrations (e.g., 0.2 mM). Overall, these findings indicate the suitability of BA adjustments to detect physiologically relevant glucose concentrations vs nonstandard concentrations. BA concentration must be adjusted to match the glucose concentration in the system; if the probe concentration is too low, the system may quickly reach saturation, limiting the accuracy of glucose detection. By adjusting the affinity and selectivity of the probe, we can precisely tailor it to meet the specific needs of diverse biological applications, ensuring accurate and reliable glucose detection across a wide spectrum of concentrations. Next, we assessed the affinity and selectivity of BA for glucose and other saccharides at a constant concentration (100 μM) across a broad range of analyte concentrations (0–10 mM saccharide concentration in PBS). BA exhibited strong selectivity and affinity for glucose (Figure 1C), with signal saturation at ∼2.5 mM, showcasing its wide dynamic range. Additionally, BA exhibited a notable response to xylose (similarly saturating at ∼2.5 mM), with minimal responsivity toward mannose, sucrose, and galactose. These findings were expected given the five-membered ring structure of xylose, simulating the furanose form of glucose, which is the favorable binding form to the boronic acid unit, whereas mannose and galactose act as C-2 and C-4 epimers of glucose, and sucrose is a disaccharide. Moreover, xylose concentrations in cells are generally negligible compared to glucose, ensuring that any potential interference from xylose is minimal, as its concentration is far lower than that of glucose. The binding affinity between two boronic acid subunits and saccharide is strongly dependent on the orientation and relative position of hydroxyl groups, allowing differentiation between similar saccharide molecules.33−36 The design of a glucose-selective diboronic acid binding lies in a structural arrangement of two boronic acid moieties in the same covalent framework that fits both cis-1,2-dihydroxyl and cis-3,5,6-trihydroxyl furanose forms. Therefore, the establishment of diboronic acid derivatives with two recognition sites can achieve selective recognition of glucose over other saccharides.37
The known pH dependency of boronic acid–diol interaction is expected to alter the affinity of BA to glucose. Indeed, the highest fluorescence of BA in the presence of glucose was obtained in the pH range of 6.5–9 (Figure 1D). The Lewis acidity of the 2-aminomethyl phenylboronic acid scaffold was markedly increased upon complexation with glucose, which resulted in the formation of anionic tetrahedral boron. This boronic acid form, with an adjacent amine center, is often referred to as ″Wulff-type″.21 Concomitantly, the engagement of the amino group in the N–B interaction masked its lone pair of electrons, reducing fluorescence quenching via a PET effect.19,24 As a result, the fluorescence intensity of BA increased in a pH range of 6.5–9.38 In strong acidic conditions (pH 2–3), the fluorescence intensity of BA is glucose-independent due to the boronic acid group undergoing sp2 hybridization and planar geometry that prevents binding with glucose. In addition, the amino group is protonated, which masks the nitrogen lone electron pair and suppresses fluorescence quenching. At pH 3.5–4.5, the amino group is deprotonated, which results in fluorescence quenching owing to the nitrogen lone electron pair engagement with the anthracene fluorophore. However, once a glucose molecule is recognized, the nitrogen lone electron pair will no longer be engaged with anthracene. Instead, the N–B bond forms, leading to the suppression of fluorescence quenching.19,39 In strong alkaline conditions (pH > 10), deprotonation of the amine group initiates the PET effect, irrespective of glucose binding.
An Intracellular Glucose Probe
To produce an intracellular glucose probe, we introduced an amide substitution to BA, as this substitution is well recognized for increasing membrane permeability compared to carboxylic acid moieties. In general, amide derivatives are more cell-permeable than carboxylic acid derivatives, owing to reduced polarity.40 We denote this probe as BA 5. The glucose-sensing mechanism of BA 5 is expected to resemble that of BA (Figure 2A). Unlike BA, BA 5 exhibited a much larger dynamic range in sensing glucose. At a constant concentration of the probe (100 μM), we noted that the probe reached saturation at 200 mM glucose (in PBS) (Figure 2B). Moreover, we noted that the probe displayed moderate linearity between 0 and 75 mM (R2 = 0.956), whereas a higher regression (R2 = 0.995) was obtained for the lower range of 0–10 mM.
Figure 2.
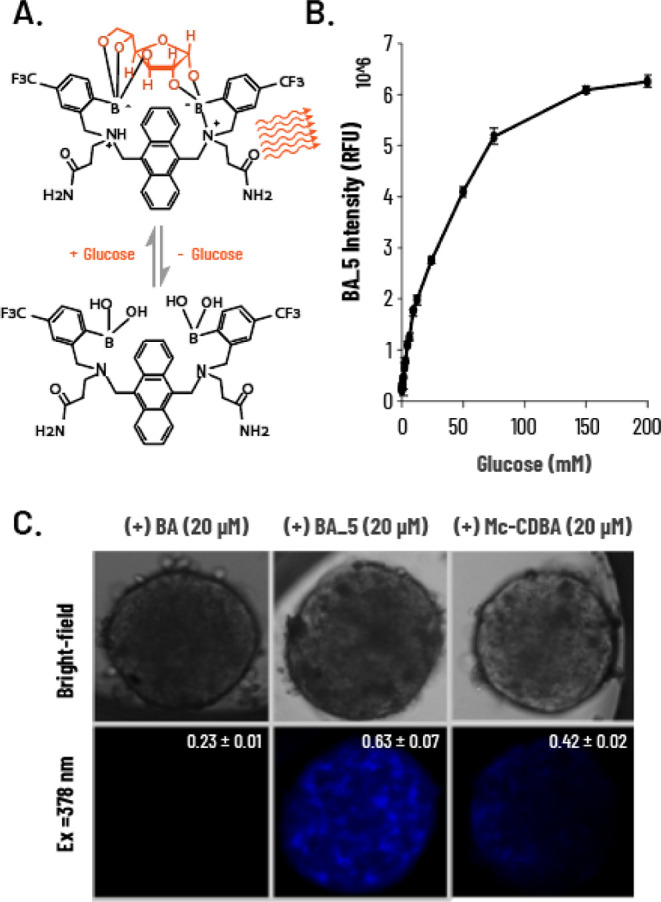
Photophysical properties of the intracellular glucose probe BA 5. (A) Schematic representation of the sensing mechanism of BA 5 for glucose. (B) Fluorescence intensity of BA 5 (100 μM) upon the addition of glucose (0–200 mM) in PBS (λex = 378 nm, λem = 430 nm). (C) Microscopy imaging and intensity quantification of cellular permeability of BA 5 vs BA and Mc-CDBA. 3D human liver spheroids incubated with BA, BA 5, and Mc-CDBA (20 μM in 0.1% DMSO) for 2 h in glucose-free TLM and imaged 24 h later. Data are presented as the mean ± SD (n = 4).
Kd value calculation of both sensors provided intriguing results: BA displayed Kd = 65.0 ± 8.4 μM and BA 5 exhibited Kd = 33.2 mM ± 0.6 mM. The dissociation constants were calculated by fitting eq 1 to the experimental glucose binding data using a custom MATLAB script and the MATLAB fmincon built-in function.
| 1 |
We assume that such significant differences in Kd might be explained by the different solvent accessibilities of both sensors in PBS. BA 5 has lower water solubility than BA, due to the presence of two amide moieties compared to dicarboxylic moieties in BA. Overall, BA 5 exhibited better glucose sensitivity in physiologically relevant conditions, as well as an extended dynamic range.39 Under physiological conditions, negatively charged carboxylic groups limit the diffusion of BA through biological membranes, restricting access to the cell interior for selective media-based glucose detection. Conversely, amidated derivative BA 5 and cyano-substituted Mc-CDBA are expected to permeate cells more effectively. To explore the latter, we incubated 3D human liver spheroids with 20 μM BA, BA 5, and Mc-CDBA for 2 h and imaged the spheroids after 48 h. Basal fluorescence (i.e., preglucose addition) was only detected in spheroids treated with Mc-CDBA and BA 5. Notably, BA 5-treated spheroids showed more noticeable fluorescence, which enabled imaging of single cells within the spheroid likely due to a combination of improved cellular penetration and higher basal fluorescence of BA 5 (Figure 2C). We also compared the cell permeability of other derivatives previously developed by our team (BA, BA 2, BA 3, BA 5, and BA 5; Scheme S1 and Table S2), in which case we noted that spheroids exposed to BA and BA 4 had no intracellular signal (note the excessive fluorescence of the solution in the presence of BA). In contrast, BA 2 and BA 3 showed high intracellular signals, although we also noticed extracellular aggregation of the probes, likely the result of their poor water solubility. As expected, BA 5 also displayed strong pH dependence (Figure 3A), as did the previously reported intracellular glucose sensor Mc-CDBA (Figure 3B). However, at acidic conditions (pH < 4.5), BA 5 showed higher fluorescence intensity compared to Mc-CDBA (∼1.5 RFU vs 0.5 RFU, respectively), likely owing to its superior water solubility. At high pH, the intensity of the probe was glucose-independent, as seen for BA (Figure 1D). Moreover, BA 5 exhibited higher fluorescence at pH 4.5–9 compared to Mc-CDBA having more than 3-fold higher basal fluorescence. Mechanistically, both probes exhibit sp2 boron hybridization under strong acidity, hindering binding to glucose. At higher pH, the probes engage in multivalent recognition of glucose under sp3 hybridization, accompanied by N–B bond formation that unmasks the nitrogen lone electron pair, allowing PET to occur. These thereby translate to sensitive and stable fluorescence responses. A further increase in pH results in deprotonation of the amine group, and the nitrogen lone electron pair triggers the PET effect, quenching both probes.
Figure 3.

pH-dependent photophysical properties of the intracellular glucose probe (BA 5). (A, B) pH-dependent (pH from 2 to 12) fluorescence emission intensity of BA 5 (100 μM) in TLM ± glucose. Schematic representation of the proposed fluorescence BA 5 sensing mechanism vs Mc-CDBA for the turn-on detection of glucose. Data are presented as the mean ± SD (n = 4).
To explore the stability of BA 5 within the spheroids, intracellular glucose dynamics were visualized over the course of several days. 3D human liver spheroids were grown in a glucose-free medium for 5 days and were compared to spheroids maintained at normal glucose levels (Figure 4). Confocal images were acquired daily to assess changes in the morphology, viability, and spheroid glucose levels. In the first three days, spheroids did not change intracellular glucose levels, whether cultured in the presence or absence of glucose (Figure 4B). However, on days 4 and 5, spheroids that were grown w/o glucose demonstrated a significant reduction in cellular fluorescence compared to control spheroids. These data suggest that the BA 5 reagent is relatively stable over 5 days, allowing continuous monitoring without the need to add any additional probe during measurements. Moreover, glucose storage in spheroids can last for up to 3 days, followed by reductions in glucose concentrations, which may result in oxidative stress and cell death.41
Figure 4.

Glucose starvation of human liver spheroids. (A) Representative images of human liver spheroids stained with BA 5 at 20 μM (blue) for 2 h and incubated for 5 days ± glucose. Confocal images were taken every 0, 24, 48, and 72 h using 0.5% of the 405 nm laser. The images are represented as maximum intensity projection of ∼350 Z-stacks for each. (B) Fluorescence intensity quantification of confocal images represented as calculated mean and SEM (n = 3/5). Statistical analysis: multiple t test with Mann–Whitney test and normality test. *p < 0.05, ***p < 0.001.
To better understand the local distribution of BA 5 from a bioprocess perspective, we explored the cellular uptake of BA 5 and conducted a cell starvation experiment on a more simplified cell system using 2D Human Embryonic Kidney (HEK) cells (Figure S1). HEK cells are not able to conduct glycogenesis, which is the process of converting glucose to glycogen for storage. Therefore, we selected HEK cells as a control system in which the uptake and metabolism of glucose are mainly regulated by the cycle of Krebs. The probe successfully monitored the physiological behavior of the glucose: after 12 h of glucose deprivation, the intracellular glucose level was significantly decreased.
Both gluconeogenesis and glycogenolysis pathways control the rate of glucose release from the liver.42 The need to store or release glucose is primarily signaled by hormones, such as insulin and glucagon. Insulin inhibits gluconeogenesis and causes glucose deposition in the liver as glycogen, whereas glucagon stimulates gluconeogenesis and activates glycogen-metabolizing enzymes. These two mechanisms enable the liver to act as a glucose sensor, to store or degrade glycogen, and to produce glucose according to peripheral needs.43 When drugs or xenobiotics reach the liver, the drug-induced stress response may cause shifts in cellular metabolism, potentially impacting glucose utilization and production.44,45 Mitochondrial function may also be affected, influencing reactive oxygen species (ROS) and ATP production and cellular energy balance, impacting glucose metabolism.46,47
Aware that liver drug toxicity can induce changes in extra- and intracellular glucose levels,42,48,49 we examined the potential of BA 5 to serve as a glucose sensor in a DILI spheroidic model. The drug nefazodone, an antidepressant that has been withdrawn from the market in various countries due to concerns of liver toxicity, was chosen as a hepatotoxic drug in our spheroid model.50 While its DILI mechanism is not fully understood, it has been linked to mitochondrial damage.51−53 Here, human liver spheroids were cotreated with BA 5 (20 μM) and a fluorescent mitochondrial marker for probing mitochondrial membrane potential (Δψm) associated with ROS accumulation.54 Spheroids were exposed to nefazodone (32 μM) for 24 h. Following five additional days in culture, fluorescence signals were acquired (Figure 5A). Mitochondrial membrane activity was significantly elevated after treatment with the drug compared to treatment with the vehicle (DMSO) (Figure 5B), likely due to the collapse of the mitochondrial membrane potential and induction of oxidative stress (which is expected to be accompanied by simultaneous acceleration of glycolysis.54 It is important to note, however, that ROS not only impacts mitochondrial function and membrane potential but may also influence the fluorescence intensity of CMTMRos, potentially altering the interpretation of experimental results.55,56 As an internal control, we also demonstrated that nefazodone has no reactivity to top BA 5 by combining BA 5 and nefazodone and comparing BA 5 intensity with and without nefazodone upon the addition of glucose concentrations (0–200 mM) in PBS (Figure 5C). As anticipated, we observed an increase in BA 5 signal in spheroids treated with the drug, indicative of an elevation in intracellular glucose levels. These data suggest that the BA 5 glucose probe can be employed for the evaluation of DILI in human liver spheroids and can be multiplexed with additional sensors of varying colors.
Figure 5.

Human liver spheroids cotreated with nefazodone, BA 5, and a mitochondrial marker. (A) Representative confocal images of 3D human liver spheroids stained with BA 5 glucose probe (20 μM, blue) and MitoTracker (1 μM, orange) for 2 h and incubated ± nefazodone (32 μM) for 24 h. Images were taken on day 5 using 0.8% of 405 nm and 0.5% of 561 nm laser for BA 5 and MitoTracker, respectively, and represented as maximum intensity projection of ∼300 Z-stacks for each. (B) Fluorescence intensity quantification represented as calculated mean and SEM (n = 3). (C) Fluorescence intensity of BA 5 (100 μM) upon the addition of glucose concentrations (0–200 mM) in PBS, in the presence of DMSO or nefazodone (32 μM) (λex = 378 nm, λem = 430 nm). Statistical analysis: two-tailed t test. **p < 0.001.
A Hydrogel-Based Glucose Probe
Hydrogels are three-dimensional, biocompatible, water-swollen polymer networks that can be readily implemented within microfluidic devices, cell wells, or other perfusion chambers in which cells and spheroids can be cultured.57,58
Sensors immobilized within these hydrogels can thereby afford continuous measurement of the extracellular environment w/o being washed away by perfusion.59−61 We therefore developed the BA 21 probe to irreversibly (covalently) bind to a polymeric hydrogel network (Figure 6A). BA 21-embedded hydrogels (HG-BA 21) exposed to increasing glucose concentrations exhibited dose-dependent increases in fluorescence (Figure 6B).
Figure 6.
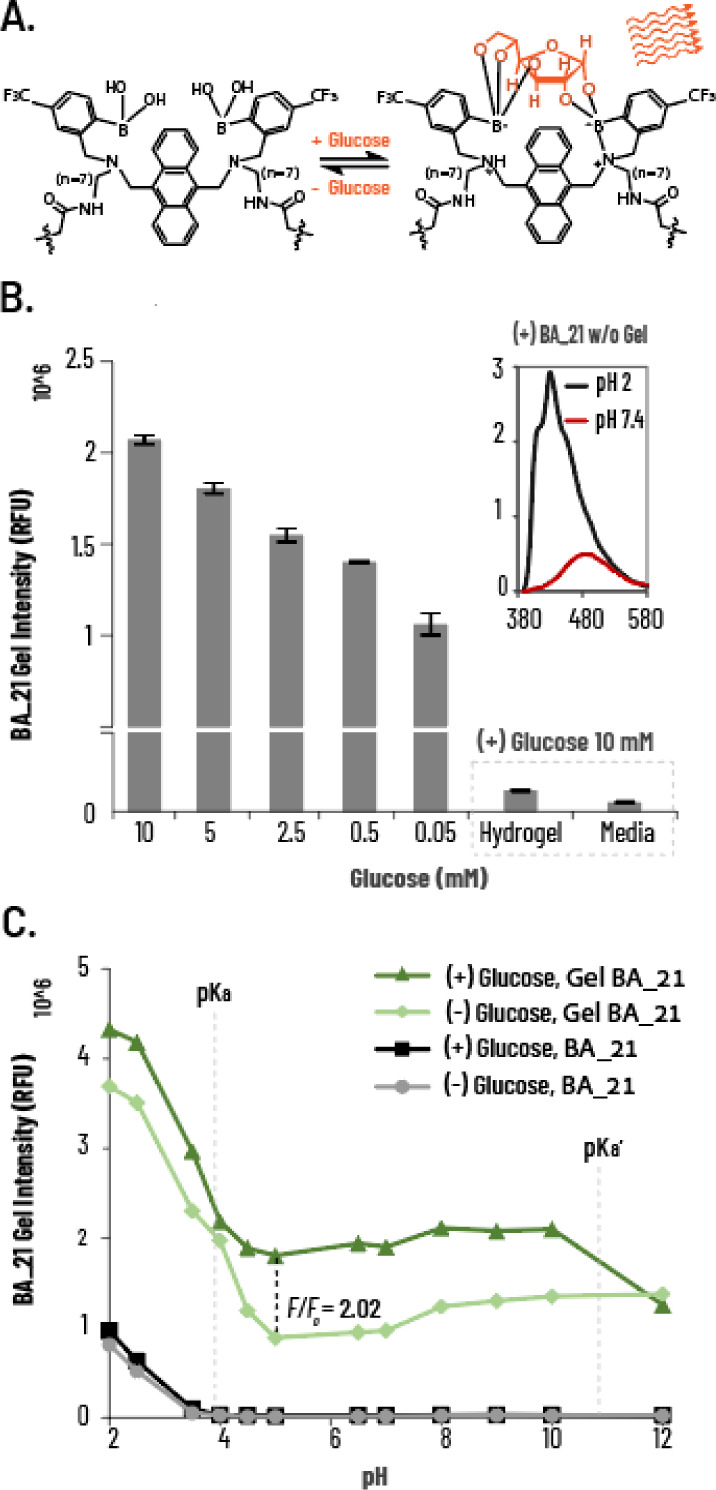
Application and photophysical properties of the hydrogel-based glucose probe HG-BA 21. (A) Schematic representation of the sensing mechanism of BA 21 for glucose. (B) HG-BA 21 fluorescent intensity at 10, 5, 2.5, 0.5, and 0.05 mM glucose concentrations in TLM (λex = 370 nm, λem = 430 nm), hydrogel only exposed to 10 mM glucose, and media transferred from HG-BA 21 exposure as system controls for leakage of BA 21. Inserted spectra: BA 21 w/o hydrogel embedment emission spectra at pH 2 and 7.4. (C) pH-dependent (pH from 2 to 12) fluorescence emission intensity of HG-BA 21 ± glucose. Data are presented as mean ± SD (n = 4).
To assess the incorporation of the covalent probe into the hydrogel, we measured the fluorescence intensity of HG-BA 21 in conditioned media in response to glucose. HG-BA 21 was coated onto 96-well plates and exposed to varying concentrations of glucose. Free hydrogel and HG-BA 21 exposed and transferred to an empty well medium served as negative controls. As expected, dose-dependent fluorescence changes were identified only within HG-BA 21 with no fluorescence signal detected in the transferred media or hydrogel without BA 21, highlighting a significant advantage of this method for extracellular glucose sensing. This suggests that probe incorporation into the hydrogel enhances its photosensitivity, allowing the implementation of a nonphoto active probe in a physiologically relevant system.
We examined the emission spectra of the free version of the BA 21 probe in physiologically relevant pH (pH 7.4) or acidic (pH 2) conditions, showing that the probe had diminished intensity at physiological pH, associated with its low water solubility (Figure 6B inset). Next, we further examined the behavior of BA 21, free and hydrogel-embedded, at different pH levels (Figure 6C). BA 21 probes that were not embedded within the hydrogel showed no fluorescence at pH 4–12, regardless of the presence of glucose. In contrast, HG-BA 21 probes exhibited the expected pH-dependent fluorescence changes, with 2-fold increases in fluorescence in the presence of glucose. This observation indicates that hydrogel incorporation restored the fluorescence, likely by facilitating better solvent insertion, allowing the sp3 hybridization of the boron atom necessary for glucose incorporation.39
Conclusions
Taken together, we present a set of modular boronic acid-based fluorescent probes for measuring changes in glucose levels. Specifically, we present three probes, BA, BA 5, and BA 21, for the detection of glucose in extracellular, intracellular, and hydrogel environments, respectively. Diboronic acid probes, unlike enzymatic glucose probes, offer a direct readout of glucose through reversible, real-time, continuous, and in situ changes in glucose levels. Compared with previously reported boronic acid glucose probes, the probes developed in this study provide peripheral chemical substitutions suitable for diverse applications with improved biocompatibility. Importantly, we showed the compatibility of the various probes for assessing glucose dynamics in liver spheroids under the DILI conditions. These compounds are easy to synthesize sensitive, selective, and stable glucose sensors, suitable for a variety of assays, notably with spheroids, and provide powerful new tools for organ-on-a-chip applications predicting DILI in the early stages of drug development.
Acknowledgments
This work was supported by the Israel Innovation Authority (IIA) (No. 80325). We would like to thank Prof. Arie Gruzman from the Deptartment of Chemistry, Bar-Ilan University, Ramat-Gan, Israel, and Prof. Shai Berlin from the Faculty of Medicine, Technion, Haifa, Israel, for their assistance and critical review of the manuscript. Additionally, we would like to thank Yuval Abraham of YuvalDesign for graphic design and JetPub Scientific Communications, LLC, for editorial assistance to authors during the preparation of this manuscript.
Glossary
Abbreviations
- Mc-CDBA
((((((2-(methoxycarbonyl)anthracene-9,10-diyl)bis(methylene))bis(methylazanediyl)) bis(methylene))bis(4-cyano-2,1-phenylene))diboronic acid)
- BA
3,3′-((anthracene-9,10-diylbis(methylene))bis((2-borono-5-(trifluoromethyl)benzyl)azanediyl))dipropionic acid
- BA 5
((((anthracene-9,10-diylbis(methylene))bis((3-amino-3-oxopropyl)azanediyl))bis(methylene))bis(4-(trifluoromethyl)-2,1-phenylene))diboronic acid
- BA 21
((((anthracene-9,10-diylbis(methylene))bis((7-aminoheptyl)azanediyl))bis(methylene))bis(4-(trifluoromethyl)-2,1-phenylene))diboronic acid
- DILI
denoted drug-induced liver injury
- PHH
primary human hepatocyte
- HKC
human Kupffer cell
- PET
photoinduced electron transfer
- ROS
reactive oxygen species
Supporting Information Available
The Supporting Information is available free of charge at https://pubs.acs.org/doi/10.1021/acsomega.4c04101.
Details on experimental materials; experimental protocols: BA derivative spheroid penetration assay, HEK cell culture, HEK cell glucose uptake assay, and HEK cell starvation experiment; chemical derivative structures: chemical representation of compounds BA, BA 2, BA 3, BA 4, BA 5, and Mc-CDBA; biocompatibility properties: microscopy imaging of cellular permeability of BA, BA 2, BA 3, BA 4, BA 5, and Mc-CDBA, confocal images of glucose uptake in HEK-293 cells, and confocal images of glucose starvation in HEK-293 cells (PDF)
Author Contributions
W.H., D.G., and G.T. contributed to study design and performed the experiments, probe analysis, data interpretation, and drafting of the manuscript. G.T. performed the experiments. I.B. and Y.H. contributed to data interpretation and drafting of the manuscript.
The authors declare no competing financial interest.
Supplementary Material
References
- Deguchi S.; Takayama K. State-of-the-Art Liver Disease Research Using Liver-on-a-Chip. Inflamm. Regen. 2022, 42, 62. 10.1186/s41232-022-00248-0. [DOI] [PMC free article] [PubMed] [Google Scholar]
- Kammerer S. Three-Dimensional Liver Culture Systems to Maintain Primary Hepatic Properties for Toxicological Analysis In Vitro. Int. J. Mol. Sci. 2021, 22 (19), 10214. 10.3390/ijms221910214. [DOI] [PMC free article] [PubMed] [Google Scholar]
- Deng J.; Wei W.; Chen Z.; Lin B.; Zhao W.; Luo Y.; Zhang X. Engineered Liver-on-a-Chip Platform to Mimic Liver Functions and Its Biomedical Applications: A Review. Micromachines 2019, 10 (10), 676. 10.3390/mi10100676. [DOI] [PMC free article] [PubMed] [Google Scholar]
- Kostadinova R.; Boess F.; Applegate D.; Suter L.; Weiser T.; Singer T.; Naughton B.; Roth A. A Long-Term Three Dimensional Liver Co-Culture System for Improved Prediction of Clinically Relevant Drug-Induced Hepatotoxicity. Toxicol. Appl. Pharmacol. 2013, 268 (1), 1–16. 10.1016/j.taap.2013.01.012. [DOI] [PubMed] [Google Scholar]
- Weber S.; Gerbes A. L. Challenges and Future of Drug-Induced Liver Injury Research-Laboratory Tests. Int. J. Mol. Sci. 2022, 23 (11), 6049. 10.3390/ijms23116049. [DOI] [PMC free article] [PubMed] [Google Scholar]
- Hosack T.; Damry D.; Biswas S. Drug-Induced Liver Injury: A Comprehensive Review. Ther. Adv. Gastroenterol. 2023, 16, 17562848231163410. 10.1177/17562848231163410. [DOI] [PMC free article] [PubMed] [Google Scholar]
- Boelsterli U. A.; Lim P. L. K. Mitochondrial Abnormalities--a Link to Idiosyncratic Drug Hepatotoxicity? Toxicol. Appl. Pharmacol. 2007, 220 (1), 92–107. 10.1016/j.taap.2006.12.013. [DOI] [PubMed] [Google Scholar]
- Begriche K.; Massart J.; Robin M.-A.; Borgne-Sanchez A.; Fromenty B. Drug-Induced Toxicity on Mitochondria and Lipid Metabolism: Mechanistic Diversity and Deleterious Consequences for the Liver. J. Hepatol. 2011, 54 (4), 773–794. 10.1016/j.jhep.2010.11.006. [DOI] [PubMed] [Google Scholar]
- Ramachandran A.; Duan L.; Akakpo J. Y.; Jaeschke H. Mitochondrial Dysfunction as a Mechanism of Drug-Induced Hepatotoxicity: Current Understanding and Future Perspectives. J. Clin. Transl. Res. 2018, 4 (1), 75–100. 10.18053/jctres.04.201801.005. [DOI] [PMC free article] [PubMed] [Google Scholar]
- Rui L. Energy Metabolism in the Liver. Compr. Physiol. 2014, 4 (1), 177–197. 10.1002/cphy.c130024. [DOI] [PMC free article] [PubMed] [Google Scholar]
- Chan J. C.; Cockram C. S.; Critchley J. A. Drug-Induced Disorders of Glucose Metabolism. Mechanisms And Management. Drug Saf. 1996, 15 (2), 135–157. 10.2165/00002018-199615020-00005. [DOI] [PubMed] [Google Scholar]
- Amor-Gutiérrez O.; Costa-Rama E.; Fernández-Abedul M. T. Paper-Based Enzymatic Electrochemical Sensors for Glucose Determination. Sensors 2022, 22 (16), 6232. 10.3390/s22166232. [DOI] [PMC free article] [PubMed] [Google Scholar]
- Updike S. J.; Shults M. C.; Rhodes R. K.; Gilligan B. J.; Luebow J. O.; Heimburg D. V. Enzymatic Glucose Sensors. Improved Long-Term Performance in Vitro and in Vivo. ASAIO J. 1994, 40 (2), 157–163. [PubMed] [Google Scholar]
- Gorton L.; Bremle G.; Csöregi E.; Jönsson-Pettersson G.; Persson B. Amperometric Glucose Sensors Based on Immobilized Glucose-Oxidizing Enzymes and Chemically Modified Electrodes. Anal. Chim. Acta. 1991, 249 (1), 43–54. 10.1016/0003-2670(91)87006-S. [DOI] [Google Scholar]
- Zhu A.; Romero R.; Petty H. R. An Enzymatic Colorimetric Assay for Glucose-6-Phosphate. Anal. Biochem. 2011, 419 (2), 266–270. 10.1016/j.ab.2011.08.037. [DOI] [PMC free article] [PubMed] [Google Scholar]
- Tajeddin A.; Mustafaoglu N. Design and Fabrication of Organ-on-Chips: Promises and Challenges. Micromachines 2021, 12 (12), 1443. 10.3390/mi12121443. [DOI] [PMC free article] [PubMed] [Google Scholar]
- Klonoff D. C. Overview of Fluorescence Glucose Sensing: A Technology with a Bright Future. J. Diabetes Sci. Technol. 2012, 6 (6), 1242–1250. 10.1177/193229681200600602. [DOI] [PMC free article] [PubMed] [Google Scholar]
- Li D.; Chen Y.; Liu Z. Boronate Affinity Materials for Separation and Molecular Recognition: Structure, Properties and Applications. Chem. Soc. Rev. 2015, 44 (22), 8097–8123. 10.1039/C5CS00013K. [DOI] [PubMed] [Google Scholar]
- Ni W.; Kaur G.; Springsteen G.; Wang B.; Franzen S. Regulating the Fluorescence Intensity of an Anthracene Boronic Acid System: A B-N Bond or a Hydrolysis Mechanism?. Bioorganic Chem. 2004, 32 (6), 571–581. 10.1016/j.bioorg.2004.06.004. [DOI] [PubMed] [Google Scholar]
- Sun X.; Chapin B. M.; Metola P.; Collins B.; Wang B.; James T. D.; Anslyn E. V. The Mechanisms of Boronate Ester Formation and Fluorescent Turn-on in Ortho-Aminomethylphenylboronic Acids. Nat. Chem. 2019, 11 (9), 768–778. 10.1038/s41557-019-0314-x. [DOI] [PMC free article] [PubMed] [Google Scholar]
- Wulff G.; Lauer M.; Böhnke H. Rapid Proton Transfer as Cause of an Unusually Large Neighboring Group Effect. Angew. Chem., Int. Ed. 1984, 23 (9), 741–742. 10.1002/anie.198407411. [DOI] [Google Scholar]
- Sasaki Y.; Zhang Z.; Minami T. A Saccharide Chemosensor Array Developed Based on an Indicator Displacement Assay Using a Combination of Commercially Available Reagents. Front. Chem. 2019, 7, 49. 10.3389/fchem.2019.00049. [DOI] [PMC free article] [PubMed] [Google Scholar]
- Jin S.; Wang J.; Li M.; Wang B. Evaluation, and Computational Studies of Naphthalimide-Based Long-Wavelength Fluorescent Boronic Acid Reporters. Chem. - Eur. J. 2008, 14 (9), 2795–2804. 10.1002/chem.200701785. [DOI] [PubMed] [Google Scholar]
- Zhu L.; Shabbir S. H.; Gray M.; Lynch V. M.; Sorey S.; Anslyn E. V. A Structural Investigation of the N-B Interaction in an o-(N,N-Dialkylaminomethyl)Arylboronate System. J. Am. Chem. Soc. 2006, 128 (4), 1222–1232. 10.1021/ja055817c. [DOI] [PubMed] [Google Scholar]
- Zhai W.; Sun X.; James T. D.; Fossey J. S. Boronic Acid-Based Carbohydrate Sensing. Chem. -Asian J. 2015, 10 (9), 1836–1848. 10.1002/asia.201500444. [DOI] [PubMed] [Google Scholar]
- James T. D.; Sandanayake K. R. A. S.; Shinkai S. Novel Photoinduced Electron-Transfer Sensor for Saccharides Based on the Interaction of Boronic Acid and Amine. J. Chem. Soc., Chem. Commun. 1994, (4), 477–478. 10.1039/c39940000477. [DOI] [Google Scholar]
- James T. D.; Sandanakaye K. R. A. S.; Shinkai S. A Glucose-Selective Molecular Fluorescence Sensor. Angew. Chem.-Int. Ed. 1994, 33 (21), 2207–2209. 10.1002/anie.199422071. [DOI] [Google Scholar]
- Franzen S.; Ni W.; Wang B. Study of the Mechanism of Electron-Transfer Quenching by Boron–Nitrogen Adducts in Fluorescent Sensors. J. Phys. Chem. B 2003, 107 (47), 12942–12948. 10.1021/jp027457a. [DOI] [Google Scholar]
- Chapin B. M.; Metola P.; Vankayala S. L.; Woodcock H. L.; Mooibroek T. J.; Lynch V. M.; Larkin J. D.; Anslyn E. V. Disaggregation Is a Mechanism for Emission Turn-On of Ortho-Aminomethylphenylboronic Acid-Based Saccharide Sensors. J. Am. Chem. Soc. 2017, 139 (15), 5568–5578. 10.1021/jacs.7b01755. [DOI] [PubMed] [Google Scholar]
- Wang K.; Zhang R.; Zhao X.; Ma Y.; Ren L.; Ren Y.; Chen G.; Ye D.; Wu J.; Hu X.; Guo Y.; Xi R.; Meng M.; Yao Q.; Li P.; Chen Q.; James T. D. Reversible Recognition-Based Boronic Acid Probes for Glucose Detection in Live Cells and Zebrafish. J. Am. Chem. Soc. 2023, 145 (15), 8408–8416. 10.1021/jacs.2c13694. [DOI] [PMC free article] [PubMed] [Google Scholar]
- Wang K.; Zhang R.; Yue X.; Zhou Z.; Bai L.; Tong Y.; Wang B.; Gu D.; Wang S.; Qiao Y.; Liu Q.; Xue X.; Yin Y.; Xi R.; Meng M. Synthesis of Diboronic Acid-Based Fluorescent Probes for the Sensitive Detection of Glucose in Aqueous Media and Biological Matrices. ACS Sens. 2021, 6 (4), 1543–1551. 10.1021/acssensors.0c02217. [DOI] [PubMed] [Google Scholar]
- James T. D.; Linnane P.; Shinkai S. Fluorescent Saccharide Receptors: A Sweet Solution to the Design, Assembly and Evaluation of Boronic Acid Derived PET Sensors. Chem. Commun. 1996, (3), 281–288. 10.1039/CC9960000281. [DOI] [Google Scholar]
- Lorand J. P.; Edwards J. O. Polyol Complexes and Structure of the Benzeneboronate Ion. J. Org. Chem. 1959, 24 (6), 769–774. 10.1021/jo01088a011. [DOI] [Google Scholar]
- Egawa Y.; Miki R.; Seki T. Colorimetric Sugar Sensing Using Boronic Acid-Substituted Azobenzenes. Mater. Basel Switz. 2014, 7 (2), 1201–1220. 10.3390/ma7021201. [DOI] [PMC free article] [PubMed] [Google Scholar]
- Norrild J. C.; Eggert H. Evidence for Mono- and Bisdentate Boronate Complexes of Glucose in the Furanose Form. Application of 1JC-C Coupling Constants as a Structural Probe. J. Am. Chem. Soc. 1995, 117 (5), 1479–1484. 10.1021/ja00110a003. [DOI] [Google Scholar]
- Juhl K.; Hazell R. G.; Jørgensen K. A. Catalytic Enantioselective Formation of Aziridines from α-Imino Esters. J. Chem. Soc. Perkin 1 1999, (16), 2293–2297. 10.1039/a903521d. [DOI] [Google Scholar]
- Wu X.; Li Z.; Chen X.-X.; Fossey J. S.; James T. D.; Jiang Y.-B. Selective Sensing of Saccharides Using Simple Boronic Acids and Their Aggregates. Chem. Soc. Rev. 2013, 42 (20), 8032–8048. 10.1039/c3cs60148j. [DOI] [PubMed] [Google Scholar]
- Yamamoto M.; Takeuchi M.; Shinkai S. Chirality Control of a Cu(I) Complex of Boronic-Acid-Appended Phenanthrolines by Sugars. A Preliminary Step toward the Total Chain Helicity Control by a Chain-End Sugar-Binding. Tetrahedron Lett. 1998, 39 (10), 1189–1192. 10.1016/S0040-4039(97)10806-1. [DOI] [Google Scholar]
- Collins B. E.; Metola P.; Anslyn E. V. On the Rate of Boronate Ester Formation in Ortho-Aminomethyl Functionalized Phenyl Boronic Acids. Supramol. Chem. 2013, 25 (2), 79–86. 10.1080/10610278.2012.740044. [DOI] [PMC free article] [PubMed] [Google Scholar]
- Frallicciardi J.; Gabba M.; Poolman B. Determining Small-Molecule Permeation through Lipid Membranes. Nat. Protoc. 2022, 17, 2620–2646. 10.1038/s41596-022-00734-2. [DOI] [PubMed] [Google Scholar]
- Graham N. A.; Tahmasian M.; Kohli B.; Komisopoulou E.; Zhu M.; Vivanco I.; Teitell M. A.; Wu H.; Ribas A.; Lo R. S.; Mellinghoff I. K.; Mischel P. S.; Graeber T. G. Glucose Deprivation Activates a Metabolic and Signaling Amplification Loop Leading to Cell Death. Mol. Syst. Biol. 2012, 8, 589. 10.1038/msb.2012.20. [DOI] [PMC free article] [PubMed] [Google Scholar]
- Sharabi K.; Tavares C. D. J.; Rines A. K.; Puigserver P. Molecular Pathophysiology of Hepatic Glucose Production. Mol. Aspects Med. 2015, 46, 21–33. 10.1016/j.mam.2015.09.003. [DOI] [PMC free article] [PubMed] [Google Scholar]
- Bollen M.; Keppens S.; Stalmans W. Specific Features of Glycogen Metabolism in the Liver. Biochem. J. 1998, 336 (1), 19–31. 10.1042/bj3360019. [DOI] [PMC free article] [PubMed] [Google Scholar]
- Wellen K. E.; Thompson C. B. Cellular Metabolic Stress: Considering How Cells Respond to Nutrient Excess. Mol. Cell 2010, 40 (2), 323–332. 10.1016/j.molcel.2010.10.004. [DOI] [PMC free article] [PubMed] [Google Scholar]
- Sharma K.; Akre S.; Chakole S.; Wanjari M. B. Stress-Induced Diabetes. A Review. Cureus 2022, 14 (9), e29142 10.7759/cureus.29142. [DOI] [PMC free article] [PubMed] [Google Scholar]
- Kim J.-A.; Wei Y.; Sowers J. R. Role of Mitochondrial Dysfunction in Insulin Resistance. Circ. Res. 2008, 102 (4), 401–414. 10.1161/CIRCRESAHA.107.165472. [DOI] [PMC free article] [PubMed] [Google Scholar]
- San-Millán I. The Key Role of Mitochondrial Function in Health and Disease. Antioxid. Basel Switz 2023, 12 (4), 782. 10.3390/antiox12040782. [DOI] [PMC free article] [PubMed] [Google Scholar]
- Han H.-S.; Kang G.; Kim J. S.; Choi B. H.; Koo S.-H. Regulation of Glucose Metabolism from a Liver-Centric Perspective. Exp. Mol. Med. 2016, 48 (3), e218 10.1038/emm.2015.122. [DOI] [PMC free article] [PubMed] [Google Scholar]
- Guerra S.; Gastaldelli A. The Role of the Liver in the Modulation of Glucose and Insulin in Non Alcoholic Fatty Liver Disease and Type 2 Diabetes. Curr. Opin. Pharmacol. 2020, 55, 165–174. 10.1016/j.coph.2020.10.016. [DOI] [PubMed] [Google Scholar]
- Stewart D. E. Hepatic Adverse Reactions Associated with Nefazodone. Can. J. Psychiatry Rev. Can. Psychiatr. 2002, 47 (4), 375–377. 10.1177/070674370204700409. [DOI] [PubMed] [Google Scholar]
- Krajnc E.; Visentin M.; Gai Z.; Stieger B.; Samodelov S. L.; Häusler S.; Kullak-Ublick G. A. Untargeted Metabolomics Reveals Anaerobic Glycolysis as a Novel Target of the Hepatotoxic Antidepressant Nefazodone. J. Pharmacol. Exp. Ther. 2020, 375 (2), 239–246. 10.1124/jpet.120.000120. [DOI] [PubMed] [Google Scholar]
- Dykens J. A.; Jamieson J. D.; Marroquin L. D.; Nadanaciva S.; Xu J. J.; Dunn M. C.; Smith A. R.; Will Y. In Vitro Assessment of Mitochondrial Dysfunction and Cytotoxicity of Nefazodone, Trazodone, and Buspirone. Toxicol. Sci. Off. J. Soc. Toxicol. 2008, 103 (2), 335–345. 10.1093/toxsci/kfn056. [DOI] [PubMed] [Google Scholar]
- Silva A. M.; Barbosa I. A.; Seabra C.; Beltrão N.; Santos R.; Vega-Naredo I.; Oliveira P. J.; Cunha-Oliveira T. Involvement of Mitochondrial Dysfunction in Nefazodone-Induced Hepatotoxicity. Food Chem. Toxicol. Int. J. Publ. Br. Ind. Biol. Res. Assoc. 2016, 94, 148–158. 10.1016/j.fct.2016.06.001. [DOI] [PubMed] [Google Scholar]
- Scorrano L.; Petronilli V.; Colonna R.; Di Lisa F.; Bernardi P. Chloromethyltetramethylrosamine (Mitotracker Orange) Induces the Mitochondrial Permeability Transition and Inhibits Respiratory Complex I. Implications for the Mechanism of Cytochrome c Release. J. Biol. Chem. 1999, 274 (35), 24657–24663. 10.1074/jbc.274.35.24657. [DOI] [PubMed] [Google Scholar]
- Kweon S. M.; Kim H. J.; Lee Z. W.; Kim S. J.; Kim S. I.; Paik S. G.; Ha K. S. Real-Time Measurement of Intracellular Reactive Oxygen Species Using Mito Tracker Orange (CMH2TMRos). Biosci. Rep. 2001, 21 (3), 341–352. 10.1023/A:1013290316939. [DOI] [PubMed] [Google Scholar]
- Chazotte B. Labeling Mitochondria with MitoTracker Dyes. Cold Spring Harb. Protoc. 2011, 2011 (8), pdb–prot5648. 10.1101/pdb.prot5648. [DOI] [PubMed] [Google Scholar]
- Chai Q.; Jiao Y.; Yu X. Hydrogels for Biomedical Applications: Their Characteristics and the Mechanisms behind Them. Gels Basel Switz. 2017, 3 (1), 6. 10.3390/gels3010006. [DOI] [PMC free article] [PubMed] [Google Scholar]
- Buenger D.; Topuz F.; Groll J. Hydrogels in Sensing Applications. Prog. Polym. Sci. 2012, 37 (12), 1678–1719. 10.1016/j.progpolymsci.2012.09.001. [DOI] [Google Scholar]
- Wang Q.; Jiao C.; Wang X.; Wang Y.; Sun K.; Li L.; Fan Y.; Hu L. A Hydrogel-Based Biosensor for Stable Detection of Glucose. Biosens. Bioelectron. 2023, 221, 114908. 10.1016/j.bios.2022.114908. [DOI] [PubMed] [Google Scholar]
- Tavakoli J.; Tang Y. Hydrogel Based Sensors for Biomedical Applications: An Updated Review. Polymers 2017, 9 (8), 364. 10.3390/polym9080364. [DOI] [PMC free article] [PubMed] [Google Scholar]
- Wu M.; Zhang Y.; Liu Q.; Huang H.; Wang X.; Shi Z.; Li Y.; Liu S.; Xue L.; Lei Y. A Smart Hydrogel System for Visual Detection of Glucose. Biosens. Bioelectron. 2019, 142, 111547. 10.1016/j.bios.2019.111547. [DOI] [PubMed] [Google Scholar]
Associated Data
This section collects any data citations, data availability statements, or supplementary materials included in this article.