

Abstract

Paeonol, a monoterpene glycoside compound, has extensive pharmacological activities. However, its applications are restricted by poor water solubility and low bioavailability. In this study, paeonol ethosomes (PAE-ethosomes) were successfully prepared with a microfluidic method by optimizing the single factors and RSM test. The enhanced PAE-ethosomes were assessed using transmission electron microscopy (TEM), Fourier transform infrared spectroscopy (FT-IR), vesicle size (VS), zeta potential (ZP), and polydispersity index (PDI). Density functional theory analysis was employed to verify the molecular interaction. The optimized RSM conditions were a phospholipid concentration of 6 mg/mL, a cholesterol concentration of 1 mg/mL, and a total flow rate of 600 μL/min with a presumed value of 60.3% and confirmation results of 61.2 ± 0.3%. The prepared PAE-ethosomes showed better storage stability and a slow-release effect. The Qn of PAE-ethosomes rose from 167.0 ± 15.8 to 272.0 ± 16.4 μg/cm2 after 24 h, which was substantially greater than that from a 25% hydroethanolic solution of paeonol, according to in vitro skin retention and transdermal absorption. The Qs of PAE-ethosomes in the skin increased by 225% with 265.5 ± 15.4 vs 81.8 ± 8.2 μg/cm2, compared with 25% hydroethanolic solution of paeonol. Molecular interaction between paeonol and lecithin by Gaussians showed that the paeonol compound may have a higher probability of spreading in the hydrophilic phosphate group (“head”) position for the PAE-ethosomes. The Tg (Lyz: EGFP) transgenic zebrafish results showed that PAE-ethosomes had better anti-inflammatory effects than paeonol. The microfluidic approach was efficient with good characteristics in physics and pharmacology with the potential in pharmaceutical use.
1. Introduction
Paeonol (PAE), a monoterpene glycoside compound, has extensive pharmacological activities and is rich in peonies including Radix Cynanchi Paniculati and Paeonia Moutan.1 Pharmacological investigations showed that paeonol had many activities, including anti-inflammatory, antioxidant, antifungal, and antiatherosclerosis activities.2−5 Paeonol also has significant cosmetic properties, such as being an antioxidant and brightening the skin.6,7 Due to paeonol’s drawbacks, including its low water solubility, low stability, and low bioavailability, its use has been limited.8,9 Many researchers have designed and prepared drug delivery systems such as micro- and nanosystems for drug encapsulation and transdermal delivery to overcome these limitations. Among them, using ethosomes is a wise tactic.10
Phospholipids, such as ethanol, water, and phosphatidyl choline, combine to form vesicular structures known as ethosomes.11 Ethanol helps to increase the loading of poorly soluble compounds onto liposomes by stabilizing the vesicles and regulating their entrapment efficiency.12 Ethosomes, in contrast to other nanomaterials, have the ability to effectively transfer medications into deeper layers of the skin and the bloodstream through the stratum corneum.13 Several methods were adopted for preparing ethosomes including the hot and cold injection method, rotary film evaporation, and vortex/sonication method.14,15 El-Hashemy et al. used the hot injection method to prepare finasteride-loaded ethosomes for the better ex vivo permeation and skin deposition than drug solutions.16 To create paeonol-loaded ethosomes, Ma et al. employed the ethanol injection technique.17 The results of the permeation profiles revealed that at 24 h, the cumulative penetration amount of paeonol from ethosomes was 67% higher than that of paeonol hydroethanolic solution, while the skin deposition was raised by 157%. The manufacturing process is thought to be one of the key factors influencing the size, PDI, and shape of the finished ethosomes.18
Recently, some new methods including microfluidics (MFs) have emerged as distinctive technologies overcoming the shortcomings of conventional methods,19,20 which could reduce the variability and improve performance.21 Different kinds of microfluidic technologies can be adopted for the preparation of liposomes, including microfluidics, pulsed jet flow, micro hydrodynamic focusing (MHF), and droplets. It was discovered that similar microfluidic and MHF techniques were effective for producing liposomal compositions in a single step that had the right size and homogeneity.22,23 Besides, microfluidic parameters had a narrow size distribution (less than 0.2 or lower). Microfluidic techniques could increase reproducibility and scalability, enabling the production of lipid nanoparticles with consistent quality.24,25
This study aimed to develop an efficient microfluidic method for PAE-ethosome preparation. EE, ZP, VS, and PDI were used to characterize the optimized PAE-ethosomes. The storage stability and slow-release effect were evaluated. The transdermal absorption and skin retention were tested in vitro. Tg (Lyz: EGFP) transgenic zebrafish was used for the anti-inflammatory and immunoregulatory activity evaluation in vivo. To our best knowledge, this is the first time PAE-ethosomes have been prepared by the microfluidic method.
2. Material and Methods
2.1. Materials
Macklin Biochemical Co., Ltd. (Shanghai, China) provided us with 98% pure soybean phosphatidylcholine, cholesterol, and mannitol. Paeonol was purchased from Chengdu Desite Biological Technology Co., Ltd. (Chengdu, China). The anhydrous ethanol (HPLC grade, purity >99.9%) and methanol (HPLC grade, purity >99.9%) were obtained from China National Pharmaceutical Group Ltd. (Beijing, China). Suzhou CChip Scientific Instrument Co., Ltd. was the source of the microfluidic chip. Constant flow pumps were purchased from Baoding Longer Precision Pump Co., Ltd. (Hebei, China). Linxi County Jingde Agricultural Products Sales Co., Ltd. (Hebei, China) supplied the one-month-old pig skin.
2.2. Preparation of PAE-Ethosomes
PAE-ethosomes were prepared using a microfluidic method based on previous experiments with minor modification.26 First, using a 20 mL syringe, soybean phospholipid, cholesterol, and pentol were dissolved in ethanol according to the necessary ratios and extracted. Then, 15 mL of ultrapure water was extracted with a second 20 mL syringe. The aqueous phase and the alcoholic phase were thoroughly mixed in a nucleic acid lipid nanoparticle preparation chip with an injection pump. The flow rate ratio between the aqueous phase and the alcohol phase was set at 3:1 (v/v) with the total flow rates of 200, 400, 600, 800, and 1000 μL/min, respectively. Every 3 mL sample was stored at 4 °C for further use.
2.3. Entrapment Efficiency of PAE-Ethosomes
Before disruption and centrifugation, 1 mL of ethosomes was combined with 3 mL of methanol and 6 mL of ultrapure water. The total drug content was measured by HPLC based on a K2025 HPLC system (Shandong, Wooking Instrument, China). The analysis was conducted with a Zafex Supperfex JX-C18 from Tianjin Zafex Pharmaceutical Technology Co., LTD (250 × 4.6 mm i.d., 5-μm particle size). Before injecting the prepared sample solution was injected into the HPLC column, it was filtered via a 0.45 μm membrane. In addition, the mobile phase consisted of methanol and water (60:40, v/v) at a flow rate of 0.8 mL/min. The column was maintained at 30 °C (Figures S1 and S2). Second, 5 mL of ethosomes was placed into a preactivated dialysis bag and dialyzed for 12 h. Then, the resulting solution was measured by repeating the above-mentioned procedure. The content of free and total drugs was calculated by HPLC. The entrapment efficiency (EE) was calculated based on the given eq 1.
| 1 |
where Dp represents the total amount of paeonol, and Ds refers to the sample content in the supernatant.
2.4. Optimizing the Preparation Conditions of PAE-Ethosomes
2.4.1. Single Factor Experiments
According to single factor design, three single factors (total flow rate, concentration of cholesterol, and concentration of phospholipid) were the primary influential factors on the EE of PAE-ethosomes. With the factor set at a phospholipid concentration of 12 mg/mL and a cholesterol concentration of 2 mg/mL, the total flow rate was set at 200, 400, 600, 800, and 1000 μL/min, respectively. When the other factors were set as a concentration of phospholipid of 12 mg/mL and a total flow rate of 600 μL/min, the concentration of cholesterol was designed as 0.5, 1, 1.5, 2, and 2.5 mg/mL, separately. When the other factors were set as a concentration of cholesterol 1 mg/mL and a total flow rate of 600 μL/min, the concentration of phospholipid was designed as 3, 6, 9, 12, and 15 mg/mL, separately.
2.4.2. Optimization by Response Surface Analysis
The main parameters influencing the entrapment rate of the PAE-ethosomes were determined to be three distinct components. Three parameters, namely the concentration of phospholipid (A), cholesterol (B), and total flow rate (C), were employed at three different levels (33) in a total of 17 trials that employed the Box–Behnken design. The parameters and their levels are shown in Table S1
The coefficient of determination with prediction (R2pred), adjustment (R2adj), and correlation coefficient (R2) were used to assess the model’s adequacies. The statistical significance of the equation was determined by using the F-test. The analysis of variance (ANOVA) was selected to examine the statistical significance of the regression coefficients after the most accurate model was selected. The p-values of less than 0.05 were considered to be of statistical significance.
2.5. Characterization of PAE-Ethosomes
2.5.1. Determination of Vesicle Size, Size Distribution, and Zeta Potential
The polydispersity index (PDI), average vesicle size (VS), and zeta potential (ZP) of the PAE-ethosomes were assessed at room temperature by using a Zetasizer Nano ZS90 (Malvern Instruments, Malvern, UK). The samples were subjected to dilution to 0.5% (w/v) with deionized water as a solvent and later agitated for 3 min, which was repeated three times.
2.5.2. TEM Analysis
Transmission electron microscopy (TEM) of PAE-ethosomes was performed with copper mesh as the support and based on a Tecnai G2 20 TWIN transmission electron microscope (Hillsboro). Rheological measurements were carried out using a Kinexus pro+ rheometer (Malvern, UK) which had parallel steel plates (0.5 mm spacing and 20 mm-diameter). After shaking, the gel was placed in the rheometer’s shear gap and allowed to incubate at 15 °C. For testing, it was then subjected to a frequency sweep or stress sweep.
2.5.3. FT-IR Analysis
2 mg of each sample powder to be tested and 100 mg of potassium bromide powder were mixed and ground in an agate mortar, and the mixture was homogeneously pressed into transparent or semitransparent tablets, which were placed in the instrument for testing. The FT-IR studies were performed at a speed of 2 mm/s with a scope of 400–4000 cm–1. The result of FT-IR spectra was explored under the shift and intensity of the vibration bands.
2.5.4. Physical Stability Assay
By keeping the vesicles at 4 ± 1 and 25 ± 1 °C for 30 days, the physical stability of the vesicles was determined. During the storage period, EE, ZP, VS, and PDI were measured at 0, 10, 20, and 30 days, respectively.
2.5.5. In Vitro Drug Release
A dialysis bag containing 0.5% Tween-80 held the sample solution (2 mL), which included PAE-ethosomes and the paeonol solution (dissolved in PBS solution at the same concentration as PAE-ethosomes). The samples were put in 40 mL of release medium PBS solution with the pH value 7.4. Then, 1 mL of the tested samples was analyzed by HPLC at a set time. P% was calculated according to eq 2:
| 2 |
where Vs and V indicate the release sampling volume and medium volume, respectively, Ci indicates each prior sampling point of the paeonol concentration, Cn indicates the nth sampling point of the paeonol concentration, and Q0 indicates the starting paeonol content.
2.6. Determination of Molecular Interaction by Molecular Docking
To optimize geometry and calculate frequencies, the B3LYP hybrid exchange-correlation functional with the 6-31G(d) basis set was employed. Zero imaginary frequencies were included in the global minimum used to compute the optimal geometries. Water was modeled using the universal solvation model SMD, with a dielectric constant of ε = 78.36.27,28 The weak interaction and binding mechanism between paeonol and soybean phospholipids were calculated and verified. All of the density functional theory (DFT) calculations were performed with the Gaussian 16 package of the program.
2.7. In Vitro Transdermal Absorption and Skin Retention Study
In vitro simulated skin permeation experiments used Franz diffusion cells (RYJ-12B, Shanghai Huanghai Pharmaceutical Instrument Co., China). The Bama minia ture pig skin (permeation area of 2.2 cm2) was set between the receptor compartments and donor. The donor compartment was maintained with the stratum corneum facing it. A 25% (v/v) concentration of ethanol was utilized as the receiving medium, and it was continuously stirred magnetically for 24 h at 37 ± 0.5 °C. Ethosomal formulation (3 mL) was applied to the skin’s surface. At the intervals of 0.5, 1, 2, 4, 6, 8, 12, and 24 h, samples were taken. Next, a new medium of the same volume was added. As per eq 3, Qn was identified as the total quantity of penetration through the skin per cm2 of diffusion area.
| 3 |
where Cn shows the paeonol conc. in the receiver medium at the nth time, S is the effective diffusion area (2.2 cm2), Ci is the drug concentration of the sample, and V and Vi represent the volumes 8 mL of the receiver solution and 0.5 mL of the sample, respectively.
After the skin was chopped into tiny pieces, 1.0 mL of methanol was added. After 10 min of homogenization and 10 min of centrifugation at 7000 rpm, the samples were subjected to HPLC analysis.
2.8. Anti-Inflammatory and Immunoregulatory Activity Evaluation
2.8.1. Feeding and Ovulation of Zebrafish
The transgenic zebrafish strain Tg (EGFP-krasv12) was provided by the Zebrafish Drug Screening Platform at the Institute of Biotechnology, Shandong Academy of Sciences. The Animal Ethics Committee of the Biology Institute of Shandong Academy of Sciences authorized all the studies, which were conducted in accordance with National Institutes of Health rules (publication no. 8023, revised in 1996) (protocol no. SWS20230710).
The transgenic zebrafish Tg (Lyz: EGFP JS7) was reared at 28.5 °C with a 14 h/10 h light/dark cycle per day. All zebrafish were fed normally for 2 weeks (that is, zebrafish without ovulation within 2 weeks). The female and male zebrafish were placed in a fish tank in a ratio of 1:1. Fish were kept apart for the night, with the male and female were separated by a partition board. The partition panel was taken out the first thing the next morning. Additionally, female and male zebrafish mated with each other to lay eggs. After 3 h, the eggs were collected. All eggs were cultured in E3 fish water conatining 5 mM NaCl, 0.17 mM KCl, 0.33 mM CaCl2, and 0.33 mM MgSO4. After the cells were cultured for 10 h, 0.003% phenylthiourea (PTU) was added to hinder the formation of black spots in zebrafish.
2.8.2. Anti-Inflammatory Activity of PAE-Ethosomes
When the embryos developed to 3 dpf, normal zebrafish larvae were selected under a stereomicroscope and moved into a 24-well culture plate. With 10 zebrafish in each group, the blank group, control group (embryonic culture water), and different concentration drug treatment groups were set up. Meanwhile, two double holes were set up, and the culture water was added to 2.0 mL. To enable the embryos to continue developing, the zebrafish in the test group and the negative control group were then kept in a light incubator (28 °C). After 5 h, the zebrafish in the blank and control groups were given their regular diet, and medicines at doses of 5, 10, 20, 30, and 40 μg/mL were administered to the drug treatment groups. After 2 h, 20 μM CuSO4 was supplemented to the control group and the drug group, and the zebrafish was treated in the dark for 1 h. The zebrafish was washed, and the zebrafish was anesthetized with anesthetic. The migration of inflammatory cells was found under a microscope and photographed. The number of inflammatory cells migrating to the zebrafish lateral line was calculated.
2.8.3. Immunoregulatory Activity of PAE-Ethosomes
When the embryo developed to 3 days of pf, normal zebrafish juveniles were selected under a stereomicroscope and moved into a 24-well culture plate. A blank group, a control group (embryo culture water), and different concentrations of drug treatment groups were set up. Two compound wells were set up simultaneously with 10 zebrafish in each group, and 2 mL of culture water was added. The zebrafish in the blank group were reared normally; the control group was supplemented with vinorelbine at a concentration of 150 μg/mL, and the drug treatment group was added with the drug at concentrations of 2.5, 5, 10, 20, 30, and 40 μg/mL and vinorelbine at the concentration of 150 μg/mL. After 24 h of incubation, the zebrafish was anesthetized with the anesthetic tricaine. The number of macrophages in the zebrafish trunk was observed under a microscope and photographed.
2.9. Experimental Design and Statistical Analysis
Every experiment was conducted in at least triplicate, and the results were presented as the mean ± SD. Each experiment was also carried out independently at least three times. Design-Expert version 13.0 (Stat-Ease Inc., Minneapolis, MN, USA) was used to perform RSM. Additionally, the Box–Behnken design (BBD) was used to improve the parameters, which were selected based on the results of the first single-factor tests. Additionally, Windows was utilized with GraphPad Prism 5.01 (GraphPad Software, San Diego, CA, USA).
3. Results and Discussion
3.1. Impacts of Factors on the Preparation of PAE-Ethosomes
3.1.1. The Effect of Total Flow Rate
The total flow rate was set at 200, 400, 600, 800, and 1000 μL/min, respectively, with the other factors being a phospholipid concentration of 12 mg/mL and a cholesterol concentration of 2 mg/mL. Based on the results in Figure 1A, the EE of PAE-ethosomes increased from 33.8% to 41.3% as the total flow rate increased from 200 to 600 μL/min. When the concentration was increased to 1000 μL/min, the EE decreased to 36.2%.
Figure 1.

Effects of the single factor on the EE, particle size, and PDI of PAE-ethosomes. A and B: effects of total flow rate; C and D: effects of cholesterol concentration; E and F: effects of phospholipid concentration. Standard errors of the means (n = 3) are shown by the vertical bars. Duncan’s multiple range test indicates that values within each item that are indicated with distinct lower-case letters are substantially different (p < 0.05).
There was a minor shift in the particle size but no discernible change in the PDI, as shown in Figure 1B. This indicated that the size was approximately 100 nm. The stability of the PAE-ethosomes formulation was influenced through elevating the TFR, resulting in less stability.29 The summary of the results is shown in Figure 1; 600 μL/min was chosen as the optimized total flow rate.
3.1.2. The Effect of Cholesterol Concentration
The concentration of cholesterol was designated as 0.5, 1, 1.5, 2, and 2.5 mg/mL, while the other factors were set at a phospholipid concentration of 12 mg/mL and a total flow rate of 600 μL/min. As shown in Figure 1C, when the concentration of cholesterol was increased from 0.5 to 2.5 mg/mL, the EE initially increased from 46.7% to 51.4%. However, the EE was decreased to 40.9% as the concentration of cholesterol further increased. When the ratio of cholesterol in the phospholipid bilayer became extremely high or low, it may cause a reduction in compactness and a subsequent decline in EE.30 With the increasing concentration of lecithin cholesterol, the particle size of ethosomes tended to increase gradually. When the concentration of PAE-ethosomes was set at 1 mg/mL, the PDI value was the lowest at 0.105 (Figure 1D). The results suggested that 1 mg/mL was the optimal concentration of cholesterol.
3.1.3. The Effect of Phospholipid Concentration
The concentration of phospholipid was designed as 3, 6, 9, 12, and 15 mg/mL with a cholesterol concentration of 1 mg/mL and a total flow rate of 600 μL/min. With the phospholipid concentration increased from 3 to 15 mg/mL, the EE initially increased from 55.3% to 58.8% and later decreased to 45.8%. The greatest EE was achieved at a lecithin concentration of up to 6 mg/mL (Figure 1E). In the current work, the particle size of PAE-ethosomes tended to increase gradually with an increasing lecithin concentration, whereas the PDI was stable (Figure 1F). The particle size was from 68.8 to 112.4 nm. However, upon reaching a threshold, more ethosomes would be formed, and there might be a tendency for aggregation and fusion, resulting in the decrease in overall EE.31 Then, 6 mg/mL soy lecithin was chosen as the optimum concentration.
3.2. Optimization of PAE-Ethosomes by the RSM
Tables S1 and S2 show the combined effects of three parameters (phospholipid concentration, cholesterol concentrations, and total flow rate) at three different levels of EE. For parameter optimization, a 17-run BBD was used to assess them further. Next, the fitted curve (eq 4) was given to forecast the maximum EE:
| 4 |
Table S3 demonstrates that the model fitted well and was able to more accurately predict the optimal prescription. The model was significant (p < 0.05), and the lack of fit test was not significant (p > 0.05). As shown in Figure 2, the EE of PAE-ethosomes ranged from 34.1% to 61.6%, based on the concentration of phospholipid, concentration of cholesterol, and total flow rate. Using the model equation and response surface analysis, the ideal circumstances were found to be 5.66 mg/mL phospholipid concentration, 0.98 mg/mL cholesterol concentration, and 595.94 μL/min as the total flow rate (Table S4), with a projected value of 60.3%. The confirmation experiments showed that the average EE value was indicated to be 61.3 ± 0.3%, which was close to the presumed value of 60.3% (Table S4). Furthermore, the outcomes demonstrated that the optimization of the preparation process’s conditions could be achieved using just the RSM technique.
Figure 2.

Effects of various parameters on EE with 3-D response surface plots and 2-D contour plots.
3.3. Characterization of PAE-Ethosomes
3.3.1. Particle Size Distribution and Zeta Potential
Figure 3 illustrates that the ZP of PAE-ethosomes was −21.6 ± 0.4 mV, indicating a high formulation stability (Figure S3). The TEM analysis showed that PAE-ethosomes had an average size of 72.6 ± 1.3 nm, which allowed them to pierce the skin deeply (Figure S4).
Figure 3.

TEM results of PAE-ethosomes on particle size distributions and surface morphologies.
Zinc particle size (ZP) is mostly related to the phospholipid structure, which includes the polar head size, charge, and fatty acid chain accumulation in the membrane.32,33 A ZP absolute value of more than 20 mV often indicates that the system is still stable. Therefore, based on the current data, PAE-ethosomes demonstrated superior stability.
3.3.2. FT-IR Analysis
Figure 4 showed the FT-IR spectra. The asymmetric stretching vibration of the P=O group could be detected by a peak near 1200 cm–1.34 Therefore, this peak was identified at 1186 cm–1 in the PAE-ethosomes. Additionally, a very intense peak at 2890 cm–1 was present in the spectra of the pure phospholipids, as well as in the spectra of PAE-ethosomes (2875 cm–1). Moreover, these peaks were associated with the symmetric and asymmetric CH2 stretching vibrations, and an elevation in their intensity suggests that the acyl chains of the phospholipids in the dry state are more ordered.35 The peak of PC at 1740 cm–1 was the stretching vibration peak of the carbonyl group in the ester group (C=O), whereas in PAE ethosome, the intensity of the peak at this location is significantly reduced due to the hydrogen bonding between PC and paeonol as well as the close arrangement of PC. Besides, the presence of paeonol in the ethosomes appeared to influence the intensity of these peaks, with lower intensity values acquired relative to those acquired for the pure phospholipids. Nonetheless, paeonol exhibited a distinctive FT-IR peak at 3224 cm–1(Figure S5), in line with the O–H stretching; however, it vanished in PAE-ethosomes. The stretching vibration of −OH in the PAE ethosome was strengthened at 3409 cm–1, and the intensity of peaks of the loaded paeonol was increased, which confirms that hydrogen bonding was formed between paeonol and ethosome, making the vesicle structure of alcohol plasma more stabilized. The peak of paeonol at 3082 cm–1 was the aromatic hydrogen group.36 Compared with the FT-IR spectrum of the PAE-ethosomes, the characteristic absorption peaks disappeared. The aryl ketone carbonyl stretching vibration peak (C=O) was the peak of paeonol, occurring at 1621 cm–1. The stretching vibration peak of C–O–C in the methoxy group was the peak of pyonol, measured at 1206 cm–1. The PAE ethosome diagram illustrated how this peak’s intensity was significantly reduced or even vanished, indicating that lips had a shielding effect on paeonol. These findings demonstrated the effective integration of paeonol into the ethosomes’ lipid matrix in their disordered or amorphous forms. The individual FT-IR spectra of paeonol, soyabean-phospholipid (PC), cholesterol (CHO), mannitol, and PAE-ethosome are shown in Figures S5–S9.
Figure 4.

FT-IR spectra of pyonosulfonyl alcohol, soybean-phospholipid (PC), cholesterol (CHO), mannitol, and PAE-ethosome.
3.3.3. The Storage Stability
Figure 5 shows the physical stability of PAE-ethosomes at 4 and 25 °C. The formulation’s physical characteristics and the previously listed parameters remained mostly unchanged after 30 days of storage at 4 °C. The results at days 10, 20, and 30 did not significantly change from the samples at day 0 (p > 0.05), indicating that the modified PAE-ethosome formulation was noticeably stable at 4 °C for 30 days. When the results at 25 °C were tested, the particle size of PAE-ethosomes had a trend to increase by 10 nm. When the storage duration was extended to 30 days at 25 °C, there was a minor 4.5% decrease in the encapsulation efficiency. The outcomes showed that even at low temperatures, PAE-ethosomes could maintain a well-encapsulated performance and uniform dispersion. Raghav et al. prepared the kaempferol-loaded ethosomes using the cold method and tested the storage stability at 4 and 25 °C.37 The drug EE (%) of the final optimized ethosome formulation was 74.2 ± 1.4% (4 °C) and 51.3 ± 0.22% (25 °C) at 90 days, while the VS values were 730 ± 1.7 and 965 ± 1.7 nm. In conclusion, PAE-ethosomes exhibit a minimal morphological change, a low leakage rate, and good stability, making them acceptable for storage at 4 °C. The increased mobility and oxidation rate of phospholipids at higher or lower temperatures may be the cause of the rise in PAE-ethosome leakage.38
Figure 5.

Effect on EE, ZP, VS, and PDI stored at different temperatures: 4 and 25 ± 1 °C for 30 days (n = 3).
3.3.4. In Vitro Drug Release
As shown in Figure 6, the release rates of PAE-ethosomes at 2 and 8 h were 25.2% and 40.8%. However, for the free paeonol, the results were 59.7% and nearly 90%. At the release time of 24 h, the drug was only released 43.8%. As a result, PAE-ethosomes regulate and postpone paeonol release. Additionally, we examined each group’s release model. With an R2 value of 0.9922, the paeonol group’s release mode matched the first-order release model (Table 1).
Figure 6.

In vitro release curve of paeonol and paeonol ethosomes (n = 3).
Table 1. Release Curve Fitting Results of Paeonol and Paeonol Ethosomes.
| Type | Model | Equation | Correlation Coefficient (R2) |
|---|---|---|---|
| Paeonol | Zero Order | Q = 0.0227x + 0.5484 | 0.3906 |
| First Order | Q = 0.9071 × (1 – e–0.5349t) | 0.9922 | |
| Higuchi | Q = 0.1568 t1/2 + 0.344 | 0.6508 | |
| Paeonol ethosomes | Zero Order | Q = 0.0115x + 0.2361 | 0.4972 |
| First Order | Q = 0.4171 × (1 – e–0.4674t) | 0.9745 | |
| Higuchi | Q = 0.0154t1/2 + 0.344 | 0.7473 |
With an R2 value of 0.9745, the PAE-ethosome group’s release mode was more in line with the first-order release model. The Q denotes the cumulative release rate, and t is the sample interval. These findings demonstrated that PAE-ethosomes inhibited the release of paeonol.
3.3.5. Molecular Interaction by Molecular Docking
The density functional theory analysis was employed to verify the molecular interaction between paeonol and soybean phospholipid.39 Geometries of all species were fully optimized without symmetry constraints. Figure 7 shows the optimized geometric configuration between paeonol and lecithin. The energy between paeonol and lecithin connection was −3.5 kJ/mol with the binding site in the “tail” (hydrophobic fatty acid chain) of lecithin (Figure 7A), while the energy was −28.7 kJ/mol in the “head” (hydrophilic phosphate group) of lecithin (Figure 7B). The lower the energy, the more stable the bond is between the two compounds. This indicates that the pyonol compound likely spreads in the hydrophilic phosphate group (“head”) position for the PAE-ethosomes. As shown in Figure 7 and Table 2, it is clear that the lecithin interacted with paeonol via hydrogen bonds, which suggested hydrogen bonds played an essential role in facilitating the interactions. Besides, FTIR analysis showed that no new peak was detected and only the characteristic peaks were present in PAE-ethosomes (Figure 4). It indicated that there was no alteration of the chemical backbone of either lecithin or paeonol, while there was only physical interactions between lecithin and paeonol.
Figure 7.
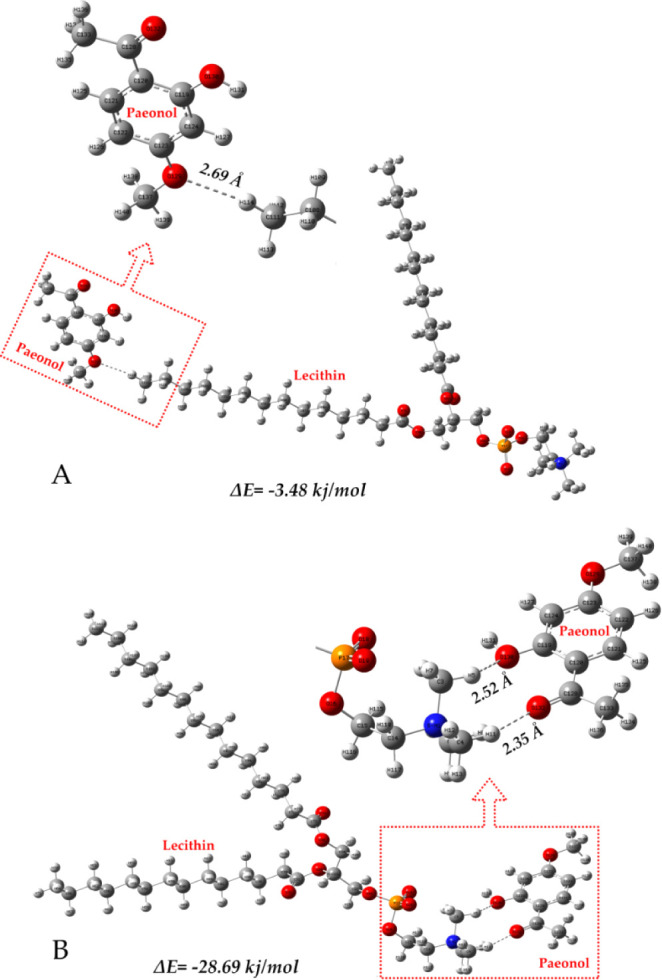
Soybean phospholipid interacted with paeonol via hydrogen bonds.
Table 2. Hydrogen Bond Length and Hydrogen Bond Angle in the Convergent Structure.
| Hydrogen Bond length (Å) | Hydrogen bond angle (deg) | |
|---|---|---|
| C119–O130···H5 | 2.52328 | 129.32607 |
| C128–O132···H11 | 2.35373 | 148.00838 |
| C111–H29···O | 2.68666 | 169.93093 |
3.3.6. In Vitro Transdermal Absorption and Skin Retention Studies
The in vitro penetration characteristics of PAE-ethosomes and paeonol through the skin of Bama miniature pigs are displayed in Figure 8. As a control, the paeonol cumulative penetration amount (Qn) from a 25% hydroethanolic solution was used. The findings demonstrated that throughout the 24 h both samples experienced a constant increase. The PAE-ethosomes’ cumulative penetration quantity (Qn) at 24 h was 272.0 ± 16.4 μg/cm2, a substantial 63% increase over the 167.0 ± 15.8 μg/cm2 from the 25% hydroethanolic solution.
Figure 8.

In-vitro permeation profiles of paeonol formulations through the Bama minia ture pig skin (n = 3).
Figure 9 showed the skin deposition (Qs) of PAE-ethosomes and paeonol solution at the end of the permeation experiment. The Qs value of PAE-ethosomes in the skin was 265.5 ± 15.4 μg/cm2, which was significantly higher than that of 25% hydroethanolic solution, which was 81.8 ± 8.2 μg/cm2 (p < 0.01). and increased by 225% compared to that of 25% hydroethanolic solution of paeonol.
Figure 9.

Deposition of paeonol in the Bama minia ture pig skin after the in vitro skin permeation experiment (n = 3).
3.4. The Effect of Anti-Inflammatory and Immunoregulatory Activities on Zebrafish
As shown in Figure 10A, the number of inflammatory cells migrating to the lateral line in the CuSO4 model group was notably increased, which suggested that CuSO4 solution exposure triggered the production of an inflammatory response, compared to the control group. The anti-inflammatory effect of PAE-ethosomes showed stronger ability than paeonol in zebrafish. Higher concentrations of paeonol (30 and 40 μg/mL) had a significant inhibitory impact on inflammatory cell migration, but with no significant difference among them. When the PAE-ethosomes concentration was changed from 5 to 40 μg/mL, the number of inflammatory cells decreased significantly (Figure 10A, B). It demonstrated that PAE-ethosomes could hinder the migration of inflammatory cells to the neuromast and make inflammatory cells return.
Figure 10.
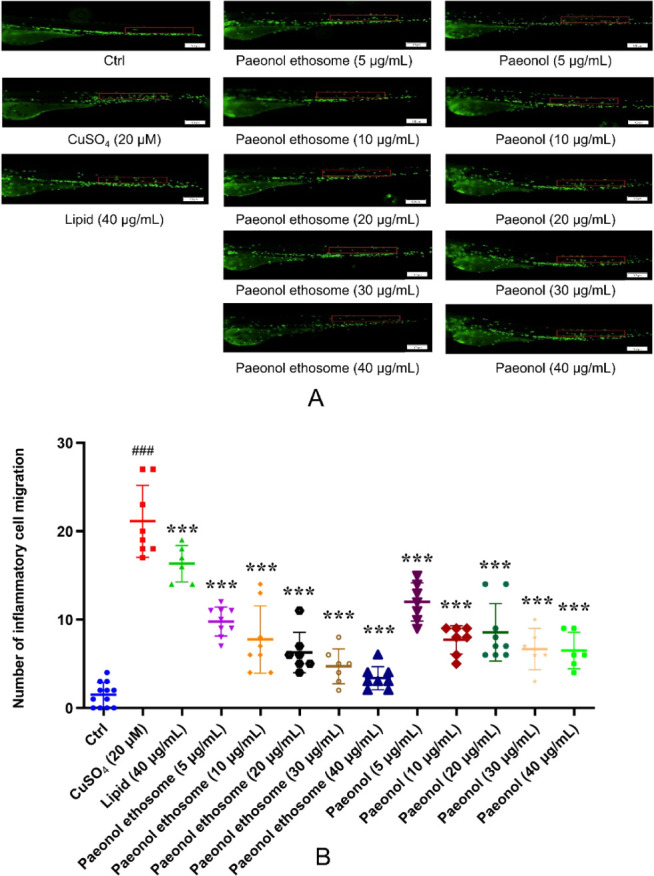
In vivo anti-inflammatory activity in transgenic fluorescent zebrafish Tg (Lyz: EGFP JS7). Scale bar is 100 μm. A: treated with lipid (40 μg/mL), paeonol (5, 10, 20, 30, and 40 μg/mL), and PAE-ethosomes (5, 10, 20, 30, and 40 μg/mL). B: number of inflammatory cell migration in zebrafish after treatment with paeonol and PAE-ethosomes (5, 10, 20, 30, and 40 μg/mL). One-way ANOVA and Dunnett’s test were used to evaluate the data using Graph Pad Prism 7.0 (GraphPad Software; CA, USA). The findings were presented as mean ± SD, ***p < 0.001 VS CuSO4, and ###P < 0.001 VS Ctrl.
As shown in Figure 11A, numerous macrophages were evenly distributed in the trunk of Tg (Lyz: EGFP) transgenic zebrafish in the blank group (Ctrl). Under the stimulation of vinorelbine, the number of macrophages was significantly reduced, and the distribution was uneven and discrete. Under the action of PAE-ethosome drugs, the number of macrophages in the trunk of zebrafish gradually increased, and then increased to normal levels at 20 μg/mL (Figure 11B). When the concentration gradually increased to 30 and 40 μg/mL, the number of macrophages did not increase significantly. Our results demonstrate that PAE-ethosomes can avoid the immune function damage of zebrafish induced by vinorelbine and have a better immune regulation function than paeonol. Under the action of ethosomes and vinorelbine, there was no significant increase in macrophages in the trunk of zebrafish, demonstrating that simple ethosomes have no immune regulation function.
Figure 11.

In vivo immunomodulatory effects in transgenic fluorescent zebrafish Tg (Lyz: EGFP). Scale bar is 100 μm. A: treated with vinorelbine (150 μg/mL), lipid (40 μg/mL), paeonol (2.5, 5, 10, 20, 30, and 40 μg/mL), and PAE-ethosomes (2.5, 5, 10, 20, 30, and 40 μg/mL). B: number of macrophages in zebrafish after treatment with vinorelbine (150 μg/mL), paeonol, and PAE-ethosomes (2.5, 5, 10, 20, 30, and 40 μg/mL). The data were analyzed by one-way ANOVA followed by Dunnett’s test using Graph Pad Prism 7.0 (GraphPad Software; CA, USA). The results were expressed as mean ± SD, **P < 0.01, ***P < 0.001 VS Ctrl.
4. Conclusions
In the present study, we established an efficient and rapid method to prepare PAE-ethosomes by a microfluidic approach. The optimum conditions for PAE-ethosome preparation were selected by the single-factors and RSM tests. The optimized RSM conditions were a phospholipid concentration 6 of mg/mL, a cholesterol concentration of 1 mg/mL, and a total flow rate of 600 μL/min with a presumed value of 60.3% and confirmation results of 61.2 ± 0.3%. EE, ZP, VS, PDI, and TEM were the characteristics of the optimized PAE-ethosomes. Furthermore, experiments using FT-IR analysis showed that paeonol was effectively integrated to form PAE-ethosomes. Molecular docking results showed that hydrogen bonds played an important role between paeonol and lecithin, with the lowest energy of −28.7 kJ/mol in the hydrophilic phosphate group of lecithin. The prepared PAE-ethosomes showed better storage stability and a slow-release effect. In vitro transdermal absorption and skin retention showed that the Qn of PAE-ethosomes increased from 167.02 ± 15.83 to 272.0 ± 16.4 μg/cm2 at 24 h, which was significantly increased by 63% compared to that of the 25% hydroethanolic solution of paeonol. The Qs of PAE-ethosomes in the skin increased by 225%, with 265.5 ± 15.4 vs 81.8 ± 8.2 μg/cm2, compared with that of 25% hydroethanolic solution of paeonol. The Tg (Lyz: EGFP) transgenic zebrafish results showed that PAE-ethosomes had better anti-inflammatory and immune regulation functions than paeonol. The results suggested that the microfluidic approach was useful for the ethosome preparation and could be applied to prepare other ethosomes combined with natural products, which could be applied for further pharmaceutical use.
Acknowledgments
We gratefully acknowledge the Science, Education, and Industry Integration Innovation Pilot Project from Qilu University of Technology (Shandong Academy of Sciences) (2022JBZ02-06, 2024ZDZX14), the Science and Technology SMEs Innovation Ability Improvement Project of Shandong Province (2022TSGC2439), the Key R&D Program of Shandong Province (2023TZXD068, 2023TZXD083), and the Key R&D and Transformation Plan of Qinghai Province (2023-SF-112).
Supporting Information Available
The Supporting Information is available free of charge at https://pubs.acs.org/doi/10.1021/acsomega.4c05830.
HPLC results; standard curve; zeta potential of PAE-ethosomes; Box–Behnken design; Box–Behnken experiments; ANOVA; predicted and experimental values (PDF)
Author Contributions
○ M.T. and Z.Z. contributed equally to this work. D.W., M.T., and J.H. contributed to data curation, formal analysis, writing – original draft, and writing – review and editing. D.W., Z.W., and J.W. contributed to conceptualization, funding acquisition and writing – review and editing. X.M. and Z.G. contributed to formal analysis and data curation. Z.Z., F.L., and L.W. contributed to data curation and writing – original draft. M.T. contributed to formal analysis, investigation, and methodology.
This research received no external funding.
The authors declare no competing financial interest.
Supplementary Material
References
- Xu Y.; Zhu J.-Y.; Lei Z.-M.; Wan L.-J.; Zhu X.-W.; Ye F.; Tong Y.-Y. Anti-proliferative effects of paeonol on human prostate cancer cell lines DU145 and PC-3. J. Physiol. Biochem. 2017, 73 (2), 157–165. 10.1007/s13105-016-0537-x. [DOI] [PubMed] [Google Scholar]
- Tang H.; Yang D.; Zhu L.; Shi F.; Ye G.; Guo H.; Deng H.; Zhao L.; Xu Z.; Li Y. Paeonol interferes with quorum-sensing in Pseudomonas aeruginosa and modulates inflammatory responses in vitro and in vivo. Front. Immunol. 2022, 13, 896874. 10.3389/fimmu.2022.896874. [DOI] [PMC free article] [PubMed] [Google Scholar]
- Chen X.; Xu Z.; Lu M.; Ding W.; Zhong J.; Deng S.; Li S.; Miao J.; Liu X.; Wen Q.; Ye S.; Li C.; Li H. Paeonol inhibits melanoma growth by targeting PD1 through upregulation of miR-139–5p. Biochem. Biophys. Res. Commun. 2023, 656, 86–96. 10.1016/j.bbrc.2023.03.005. [DOI] [PubMed] [Google Scholar]
- Qian W.; Li X.; Liu Q.; Lu J.; Wang T.; Zhang Q. Antifungal and antibiofilm efficacy of paeonol treatment against biofilms comprising Candida albicans and/or Cryptococcus neoformans. Front. Cell. Infect. Microbiol. 2022, 12, 884793. 10.3389/fcimb.2022.884793. [DOI] [PMC free article] [PubMed] [Google Scholar]
- Lu L.; Qin Y.; Chen C.; Guo X. Beneficial Effects Exerted by Paeonol in the Management of Atherosclerosis. Oxid. Med. Cell. Longev. 2018, 2018 (1), 1098617. 10.1155/2018/1098617. [DOI] [PMC free article] [PubMed] [Google Scholar]
- Ding H.-Y.; Chou T.-H.; Lin R.-J.; Chan L.-P.; Wang G.-H.; Liang C.-H. Antioxidant and antimelanogenic behaviors of Paeonia suffruticosa. Plant Foods Hum. Nutr. 2011, 66 (3), 275–284. 10.1007/s11130-011-0235-3. [DOI] [PubMed] [Google Scholar]
- Lin D.; Wang S.-H.; Song T.-Y.; Hsieh C.-W.; Tsai M.-S. Safety and efficacy of tyrosinase inhibition of Paeonia suffruticosa Andrews extracts on human melanoma cells. J. Cosmet. Dermatol. 2019, 18 (6), 1921–1929. 10.1111/jocd.12902. [DOI] [PubMed] [Google Scholar]
- Zong S.-Y.; Pu Y.-Q.; Xu B.-L.; Zhang T.; Wang B. Study on the physicochemical properties and anti-inflammatory effects of paeonol in rats with TNBS-induced ulcerative colitis. Int. Immunopharmacol. 2017, 42, 32–38. 10.1016/j.intimp.2016.11.010. [DOI] [PubMed] [Google Scholar]
- Chen Z. X.; Li B.; Liu T.; Wang X.; Zhu Y.; Wang L.; Wang X. H.; Niu X.; Xiao Y.; Sun Q. Evaluation of paeonol-loaded transethosomes as transdermal delivery carriers. Eur. J. Pharm. Sci. 2017, 99, 240–245. 10.1016/j.ejps.2016.12.026. [DOI] [PubMed] [Google Scholar]
- Hallan S. S.; Sguizzato M.; Mariani P.; Cortesi R.; Huang N.; Simelière F.; Marchetti N.; Drechsler M.; Ruzgas T.; Esposito E. Design and characterization of ethosomes for transdermal delivery of caffeic acid. Pharmaceutics 2020, 12, 740. 10.3390/pharmaceutics12080740. [DOI] [PMC free article] [PubMed] [Google Scholar]
- Ainbinder D.; Paolino D.; Fresia M.; Touitou E. Drug delivery applications with ethosomes. J. Biomed. Nanotechnol. 2010, 6 (5), 558–568. 10.1166/jbn.2010.1152. [DOI] [PubMed] [Google Scholar]
- Ghanbarzadeh S.; Arami S. Enhanced transdermal delivery of diclofenac sodium via conventional liposomes, ethosomes, and transfersomes. BioMed. Res. Int. 2013, 2013 (1), 616810. 10.1155/2013/616810. [DOI] [PMC free article] [PubMed] [Google Scholar]
- Zorec B.; Zupančič Š.; Kristl J.; Pavšelj N. Combinations of nanovesicles and physical methods for enhanced transdermal delivery of a model hydrophilic drug. Eur. J. Pharm. Biopharm. 2018, 127, 387–397. 10.1016/j.ejpb.2018.03.008. [DOI] [PubMed] [Google Scholar]
- Cristiano M. C.; Froiio F.; Spaccapelo R.; Mancuso A.; Nisticò S. P.; Udongo B. P.; Fresta M.; Paolino D. Sulforaphane-loaded ultradeformable vesicles as a potential natural nanomedicine for the treatment of skin cancer diseases. Pharmaceutics 2020, 12, 6. 10.3390/pharmaceutics12010006. [DOI] [PMC free article] [PubMed] [Google Scholar]
- Pandey V.; Golhani D.; Shukla R. Ethosomes: versatile vesicular carriers for efficient transdermal delivery of therapeutic agents. Drug Delivery 2015, 22 (8), 988–1002. 10.3109/10717544.2014.889777. [DOI] [PubMed] [Google Scholar]
- El-Hashemy H. A. Design, formulation and optimization of topical ethosomes using full factorial design: in-vitro and ex-vivo characterization. J. Liposome Res. 2022, 32 (1), 74–82. 10.1080/08982104.2021.1955925. [DOI] [PubMed] [Google Scholar]
- Ma H.; Guo D.; Fan Y.; Wang J.; Cheng J.; Zhang X. Paeonol-loaded ethosomes as transdermal delivery carriers: Design, preparation and evaluation. Molecules 2018, 23, 1756. 10.3390/molecules23071756. [DOI] [PMC free article] [PubMed] [Google Scholar]
- Jaradat E.; Weaver E.; Meziane A.; Lamprou D. A. Microfluidics technology for the design and formulation of nanomedicines. Nanomater. 2021, 11, 3440. 10.3390/nano11123440. [DOI] [PMC free article] [PubMed] [Google Scholar]
- Jahn A.; Lucas F.; Wepf R. A.; Dittrich P. S. Freezing Continuous-Flow Self-Assembly in a Microfluidic Device: Toward Imaging of Liposome Formation. Langmuir 2013, 29 (5), 1717–1723. 10.1021/la303675g. [DOI] [PubMed] [Google Scholar]
- Lu L.; Schertzer J. W.; Chiarot P. R. Continuous microfluidic fabrication of synthetic asymmetric vesicles. Lab Chip 2015, 15 (17), 3591–3599. 10.1039/C5LC00520E. [DOI] [PubMed] [Google Scholar]
- Liu D.; Zhang H.; Fontana F.; Hirvonen J. T.; Santos H. A. Current developments and applications of microfluidic technology toward clinical translation of nanomedicines. Adv. Drug Delivery Rev. 2018, 128, 54–83. 10.1016/j.addr.2017.08.003. [DOI] [PubMed] [Google Scholar]
- Weaver E.; O’Connor E.; Cole D. K.; Hooker A.; Uddin S.; Lamprou D. A. Microfluidic-mediated self-assembly of phospholipids for the delivery of biologic molecules. Int. J. Pharm. 2022, 611, 121347. 10.1016/j.ijpharm.2021.121347. [DOI] [PubMed] [Google Scholar]
- Jahn A.; Vreeland W. N.; Gaitan M.; Locascio L. E. Controlled vesicle self-assembly in microfluidic channels with hydrodynamic focusing. J. Am. Chem. Soc. 2004, 126 (9), 2674–2675. 10.1021/ja0318030. [DOI] [PubMed] [Google Scholar]
- Yathindranath V.; Safa N.; Tomczyk M. M.; Dolinsky V.; Miller D. W. Lipid nanoparticle-based inhibitors for SARS-CoV-2 host cell infection. Int. J. Nanomed. 2024, 19, 3087–3108. 10.2147/IJN.S448005. [DOI] [PMC free article] [PubMed] [Google Scholar]
- Sugimoto Y.; Suga T.; Kato N.; Umino M.; Yamayoshi A.; Mukai H.; Kawakami S. Microfluidic post-insertion method for the efficient preparation of pegylated liposomes using high functionality and quality lipids. Int. J. Nanomed. 2022, 17, 6675–6686. 10.2147/IJN.S390866. [DOI] [PMC free article] [PubMed] [Google Scholar]
- Carugo D.; Bottaro E.; Owen J.; Stride E.; Nastruzzi C. Liposome production by microfluidics: potential and limiting factors. Sci. Rep. 2016, 6 (1), 25876. 10.1038/srep25876. [DOI] [PMC free article] [PubMed] [Google Scholar]
- Marenich A. V.; Cramer C. J.; Truhlar D. G. Universal solvation model based on solute electron density and on a continuum model of the solvent defined by the bulk dielectric constant and atomic surface tensions. J. Phys. Chem. B 2009, 113 (18), 6378–6396. 10.1021/jp810292n. [DOI] [PubMed] [Google Scholar]
- Yanai T.; Tew D. P.; Handy N. C. A new hybrid exchange–correlation functional using the Coulomb-attenuating method (CAM-B3LYP). Chem. Phys. Lett. 2004, 393 (1), 51–57. 10.1016/j.cplett.2004.06.011. [DOI] [Google Scholar]
- Jaradat E.; Weaver E.; Meziane A.; Lamprou D. A. Microfluidic paclitaxel-loaded lipid nanoparticle formulations for chemotherapy. Int. J. Pharm. 2022, 628, 122320. 10.1016/j.ijpharm.2022.122320. [DOI] [PubMed] [Google Scholar]
- Lange Y.; Steck T. L. Cholesterol homeostasis and the escape tendency (activity) of plasma membrane cholesterol. Prog. Lipid Res. 2008, 47 (5), 319–332. 10.1016/j.plipres.2008.03.001. [DOI] [PMC free article] [PubMed] [Google Scholar]
- Wu Y.; Mou B.; Song S.; Tan C.-P.; Lai O.-M.; Shen C.; Cheong L.-Z. Curcumin-loaded liposomes prepared from bovine milk and krill phospholipids: Effects of chemical composition on storage stability, in-vitro digestibility and anti-hyperglycemic properties. Int. Food Res. 2020, 136, 109301. 10.1016/j.foodres.2020.109301. [DOI] [PubMed] [Google Scholar]
- Morini M. A.; Sierra M. B.; Pedroni V. I.; Alarcon L. M.; Appignanesi G. A.; Disalvo E. A. Influence of temperature, anions and size distribution on the zeta potential of DMPC, DPPC and DMPE lipid vesicles. Colloids Surf., B 2015, 131, 54–58. 10.1016/j.colsurfb.2015.03.054. [DOI] [PubMed] [Google Scholar]
- Kamble S.; Agrawal S.; Cherumukkil S.; Sharma V.; Jasra R. V.; Munshi P. Revisiting zeta potential, the key feature of interfacial phenomena, with applications and recent advancements. ChemistrySelect 2022, 7 (1), e202103084 10.1002/slct.202103084. [DOI] [Google Scholar]
- Lewis R. N. A. H.; McElhaney R. N.. Fourier Transform Infrared Spectroscopy in the Study of Lipid Phase Transitions in Model and Biological Membranes. In Methods in Membrane Lipids, Dopico A. M., Ed.; Humana Press: Totowa, NJ, 2007; pp. 207–226.. [DOI] [PubMed] [Google Scholar]
- Frías M. A.; Díaz S. B.; Ale N. M.; Ben Altabef A.; Disalvo E. A. FTIR analysis of the interaction of arbutin with dimyristoyl phosphatidylcholine in anhydrous and hydrated states. Biochim. Biophys. Acta - Biomembr. 2006, 1758 (11), 1823–1829. 10.1016/j.bbamem.2006.06.024. [DOI] [PubMed] [Google Scholar]
- Yang T.; Shi X.; Guo L.; Gu S.; Zhang W.; Xu G.; Li W.; Jiang Y. Design, synthesis, and antitumor activity of novel paeonol derivatives containing the 1,4-benzoxazinone and 1,2,3-triazole moieties. J. Chem. Res. 2019, 43 (7–8), 241–247. 10.1177/1747519819857479. [DOI] [Google Scholar]
- Raghav S. S.; Kumar B.; Sethiya N. K.; Pahwa S. Development and optimization of kaempferol loaded ethosomes using Box–Behnken statistical design: In vitro and ex-vivo assessments. J. Biomed. Mater. Res., Part B 2024, 112 (3), e35394 10.1002/jbm.b.35394. [DOI] [PubMed] [Google Scholar]
- Papahadjopoulos D.; Nir S.; Ohki S. Permeability properties of phospholipid membranes: Effect of cholesterol and temperature. Biochim. Biophys. Acta - Biomembr. 1972, 266 (3), 561–583. 10.1016/0005-2736(72)90354-9. [DOI] [PubMed] [Google Scholar]
- Wang Y.; Yue Y.; Jia R.; Liu X.; Cheng Z.; Cheng Y.; Xu Y.; Xie Z.; Xia H. Design and evaluation of paeonol-loaded liposomes in thermoreversible gels for atopic dermatitis. Gels 2023, 9, 198. 10.3390/gels9030198. [DOI] [PMC free article] [PubMed] [Google Scholar]
Associated Data
This section collects any data citations, data availability statements, or supplementary materials included in this article.