Abstract
Background: Microvascular invasion (MVI) is an independent risk factor of poor prognosis in hepatocellular carcinoma (HCC) and can be used to guide the diagnosis and treatment of HCC. The immune system serves as an integral role in the incidence and progression of HCC. However, the molecular biology correlation between MVI and tumor immunity and the value of combining the two parameters to predict patient prognosis and HCC response to treatment remain to be evaluated. Results: In this study, we used univariate Cox regression analysis and least absolute shrinkage and selection operator (LASSO) Cox analysis to establish the MVI and immune-related gene index (MIRGPI) including eight genes. We demonstrated that the MIRGPI was an independent risk factor in predicting the prognosis of HCC. Subsequently, our research established a nomogram model combining pathologic characteristics and verified its good clinical application value. In addition, our study found that the TP53 gene had a higher mutation frequency and a lower degree of immune infiltration in the high-risk group. The low-risk group had higher sensitivity to immunotherapy, sorafenib, and TACE treatment, and the high-risk group had higher sensitivity to common chemotherapeutic agents. Finally, SEMA3C was found to facilitate the proliferation, migration and invasive ability of HCC by in vitro and in vivo experiments, and its mechanism may be associated with the activation of the NF-Κb/EMT signaling pathway. Conclusions: In summary, the MIRGPI signature we developed is a reliable marker for the prediction of prognosis and treatment response, and is important for the prognostic assessment and individualized treatment of HCC.
Supplementary Information
The online version contains supplementary material available at 10.1038/s41598-024-78467-3.
Keywords: Hepatocellular carcinoma, MVI, Immune-related genes, Prognostic biomarker, SEMA3C
Subject terms: Liver cancer, Prognostic markers, Tumour biomarkers
Introduction
The incidence of hepatocellular carcinoma (HCC) in the population is increasing year by year1. Currently, radical means for hepatocellular carcinoma include surgery (including liver transplantation), ablation, etc. However, due to its insidious onset, high recurrence rate, and high metastatic rate, the prognosis is usually poor2,3. Microvascular invasion (MVI), which refers to the presence of HCC micrometastases in the hepatic portal vein and venous system, is regarded as an independent risk factor and key indicator of postoperative recurrence and poor prognosis in patients with early-stage HCC4. Numerous studies have shown that compared to conventional staging criteria, MVI is more sensitive in predicting HCC metastasis, recurrence and survival status after surgical resection5. Nowadays, the clinical value of MVI in guiding the management of hepatocellular carcinoma has also gained much importance6–8. Currently, the acquisition of MVI status still relies on pathologists’ subjective judgment of postoperative pathological specimens under the microscope, resulting in the limited application of MVI indicators9. There are no effective MVI-related molecular markers for the prediction of the therapeutic response and prognosis of HCC patients.
The immune system is indispensable through the development of malignant tumors10. Numerous studies have shown that prognostic models derived from immune-related genes (IRGs) can be desirable prognostic indicators in various cancers, consisting of cholangiocarcinoma, colorectal cancer and HCC11–13. The dynamic interactions between tumor cells and the tumor immune microenvironment (TIME) serve as a significant part in the occurrence and progression of cancers and considerably influence the therapeutic efficacy of immunotherapy, represented by immune checkpoint inhibitors (ICIs)14. Immunotherapy has shown favorable therapeutic effects in the treatment of some HCC patients, and several ICIs have been approved for clinical use, such as navulizumab, pabolizumab, and atalizumab15. However, immunotherapy is still in the exploratory stage, and relevant studies lack sufficient evidence. It is of vital importance to recognize effective biomarkers for the accurate prediction of survival and responsiveness to immunotherapy in HCC. Currently, there are no reports examining the role of IRGs in MVI characterization. Similarly, predictive modeling of MVI signatures to predict the prognosis of HCC patients suffers from problems such as a lack of accuracy16,17.
In this study, we comprehensively illustrated the value of MIRGPI in terms of prognosis, genomic alterations, immune infiltration, and response to therapy by constructing the MVI and immune-related gene prognostic index (MIRGPI). Besides, we validated the relevance between SEMA3C expression, a core component of the MIRGPI, and the prognosis of HCC in our center cohort. We also further revealed the biological function of SEMA3C in HCC and its underlying mechanisms by in vitro cellular experiments. Briefly, our findings are important for HCC prognostic assessment and individualized therapies.
Materials and methods
Information sources
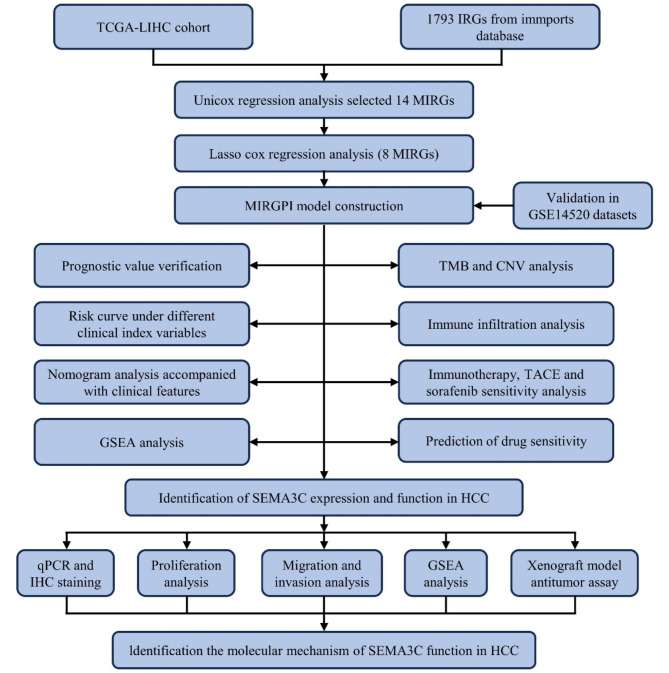
We acquired transcriptomic, clinical and survival data of the TCGA-LIHC dataset from the University of California–Santa Cruz Xena18. The TCGA cohort consisted of 210 MVI-negative (MVI (-)) tumor tissues, 95 MVI-positive (MVI (+)) tumor tissues, and 50 normal tissues. We converted the gene expression level of TCGA queue from FPKM format to log2 (TPM + 1) format. We also obtained information on 221 HCC patients from the GSE14520 dataset as the GEO cohort from the GEO database and preprocessed the data according to a previous study19,20. Supplementary Table 1 displays the patient pathologic features in both cohorts. A total of 1793 IRGs were obtained through the login of the ImmPorts database21. Figure 1 illustrates the comprehensive workflow of the study.
Fig. 1.
The workflow of the analysis steps.
Screening for MVI-related genes
MVI-related genes (MRGs) were screened as described previously16. Briefly, our study invoked the Deseq2 R package to acquire differential genes between MVI (+) cancer and paracancerous tissues, and also acquired differential genes between MVI (-) cancer and paracancerous tissues using the screening criteria of |log2(fold change)|> 1 and FDR < 0.0522. Finally, 800 MRGs that were differentially expressed only in MVI (+) tumor tissues were obtained. Subsequently, we took the intersections of the MRGs and IRGs and further screened 72 MVI- and immune-related genes (MIRGs). These 72 MIRGs were analyzed for Kyoto Encyclopedia of Genes and Genomes (KEGG)23–25 and Gene Ontology (GO) enrichment utilizing the clusterProfiler R package26.
Establishment and evaluation of the MIRGPI
Patients who died within 30 days and who were lost to follow-up were excluded27. Univariate Cox regression analyses were first performed using the survival R package, followed by least absolute shrinkage with selection operator (LASSO) Cox regression analyses using the glmnet R package, which ultimately filtered out the eight MIRGs associated with overall survival (OS). The coefficient corresponding to lambda.min was chosen to create the MIRGPI signature and the risk score was equal to the sum of the corresponding coefficients multiplied by each gene expression. Kaplan-Meier (KM) survival analyses were performed with the survival R package and log-rank test. We assessed the predictive accuracy of the MIRGPI in accordance with receiver operating characteristic (ROC) curves. Besides, our research evaluated risk score for patients with HCC at each stage in the GSE6764 dataset.
Construction of MIRGPI-related nomograms
Clinical characteristics (age, gender, grade, and stage) of patients in the TCGA and GEO cohort were included in univariate Cox regression models along with the MIRGPI. The MIRGPI and stage were included in the nomogram model derived from multivariate Cox regression results. We differentiated different risk groups utilizing the median risk score based on the nomogram model. The ROC curves, calibration curves, and decision curve analysis (DCA) were utilized for the evaluation of model performance.
Genomic variation analysis and gene set enrichment analysis (GSEA)
Our study utilized the maftools R package to map somatic mutations in different risk subgroups in the TCGA cohort28. We also further explored the somatic copy number variations among different risk groups using the GISTIC2.0 algorithm. The reference gene sets “c2.cp.kegg.v7.4.symbols” and “h.all.v7.1.symbols” were obtained from MSigDB. GSEA (FDR < 0.25 and NES > 1) was performed using the clusterProfiler R package to identify potential signature pathways associated with risk groups26.
Immune infiltration analysis and prediction of immunotherapy response
Immune cell enrichment scores were assessed by six algorithms (CIBERSORT29, EPIC30, MCPcounter31, Quantiseq32, TIMER33, and xCell34). The ESTIMATE algorithm was used to calculate the immune score for different risk subgroups and to estimate tumor purity35. We then performed single sample gene set enrichment analysis (ssGSEA) to quantify the scores of immune-associated pathways and immune-infiltrating cells36. We also explored differences in common immunotherapeutic markers in the MIRGPI subgroups, including 48 immune checkpoints11, IFN-γ37 and m6A pathway markers38. In addition, our study utilized the algorithm of immunophenotype score (IPS) and tumor immune dysfunction and exclusion (TIDE) to estimate the sensitivity of different risk subgroups to immunotherapy39,40. The IMvigor210 dataset was derived from a phase II clinical trial evaluating the efficacy of atelizumab (a PD-L1 inhibitor) in patients with advanced uroepithelial carcinoma with disease progression after platinum-based chemotherapy. Based on this dataset, we further evaluated the susceptibility to immunotherapy in different risk subgroups of HCC patients.
Sorafenib, TACE treatment responsiveness and chemosensitivity prediction
The GSE109211 dataset contains 67 HCC patients receiving adjuvant therapy with sorafenib, and the GSE104580 dataset contains 147 HCC patients receiving TACE. We assessed the differences in the responsiveness of the MIRGPI subgroups to sorafenib and TACE treatments in two datasets and utilized the OncoPredict R package to assess drug sensitivity in different risk groups in the TCGA cohort using the Genomics of Drug Sensitivity in Cancer (GDSC) database41.
HCC tissue samples
After this research was authorized by the Ethics Committee of the First Affiliated Hospital of Zhengzhou University, we obtained HCC tissues and paired normal liver tissue samples from 102 patients for the study. This study was conducted in accordance with the Helsinki Declaration, and all patients had signed a written informed consent form before surgery.
Quantitative real-time PCR (qRT-PCR)
We used TRIzol reagent (Vazyme, Nanjing, China) to extract total RNA. After that, we referred to the instruction of the Reverse Transcription Kit (Beyotime, Shanghai, China) for the cDNA synthesis process. Then our study utilized BeyoFast™ SYBR Green qPCR Mix (Beyotime, Shanghai, China) to perform qRT-PCR and utilized the 2−ΔΔCt method for the calculation of the relative expression levels of the target mRNAs. The primer sequences are displayed in Supplementary Table 5.
Immunohistochemical staining (IHC)
The tissue samples were paraffin-embedded and cut into 5-µm sections, and stained by conventional methods41. ImageJ software was used to quantify the image intensity, and the IHC score was used to calculate the IHC results. The specific calculation method was as follows: IHC score = (1 × percentage of weak intensity cells) + (2 × percentage of medium intensity cells) + (3 × percentage of strong intensity cells).
Cell culture and transfection
Five human hepatocellular carcinoma cell lines (MHCC97H, HepG2, Huh7, Hep3B, and LM3) were obtained from the Henan Organ Transplantation Research Center. The cells were cultured in DMEM medium supplemented with 10% fetal bovine serum (FBS) (Biowest, USA) in an incubator at 37℃ with 5% CO2. The shRNA and overexpression plasmids of SEMA3C were obtained from the Public Protein/Plasmid Library, and the detailed sequences are shown in Supplementary Table 7. HCC cell lines were transfected using lentivirus.
Western blotting (WB) analysis
WB experiments were performed according to the methodology of a previous study42. Briefly, after extraction of proteins by RIPA lysis buffer, samples were electrophoresed by 10% SDS-PAGE and transferred to PVDF membranes. Afterwards, the membrane was closed and protein chemiluminescence was detected on an imaging system (Bio-Rad) after incubating the primary and secondary antibodies separately. Supplementary Table 6 shows the antibodies used.
Determination of cell proliferation capacity
CCK-8 and colony formation assays were used to assess cell proliferation capacity. 4000 transfected cells/well were inoculated in 96-well plates and the absorbance at 450 nm was measured after 1,2 and 3 days of incubation by adding CCK-8 reagent (Beyotime, Shanghai, China) to the culture medium. 6-well plates were inoculated with transfected cells (1000 cells/ well). Then, we respectively used 4% paraformaldehyde (PFA) and 0.2% crystal violet for cell fixation and staining process after 2 weeks. The colonies counting was performed using a light microscope.
Cell migration and invasive capacity assay
Transfected cells in 6-well plates were cultured to 90% cell confluence. Scratches were made using a 200 µl pipette gun tip and the cells were placed in serum-free medium and underwent 24-hour incubation. The wound closure was observed under a microscope and photographed. Cell invasion and migration abilities were measured using precoated or uncoated Matrigel (BD Bioscience, Franklin Lakes, USA) in a Transwell chamber (Corning, New York, USA). The upper chamber was incubated with 200µL of serum-free medium containing 50,000 cells, and the lower chamber was incubated with 800µL of medium containing 20% FBS. The cells were fixed and stained after 48 h and then photographed under a microscope.
Xenograft assay
2 × 10⁶ cells were suspended in 100µL PBS and then injected subcutaneously into the right dorsum of 5-week-old female BALB/C nude mice (Beijing Vitality River Laboratory Animal Technology, China). After 3 weeks, the nude mice were euthanized by intraperitoneal injection of 200 mg/kg pentobarbital sodium, and the tumor tissue was removed and weighed. All animal experiments were approved by the Ethics Committee of the First Affiliated Hospital of Zhengzhou University (Approval number: 2023-KY-1008). The animal experiments were conducted in accordance with relevant guidelines and regulations, and the reporting in the manuscript adheres to the recommendations outlined in the ARRIVE Guidelines 2.0.
Statistical analysis
We utilized R software (version 4.2.2) and GraphPad Prism (version 8.0.2) to complete all the statistical analyses. The Wilcoxon signed-rank test and the Kruskal-Wallis test were utilized for the comparison of differences between different groups. Correlations between two variables were assessed using Spearman’s analysis. Comparisons between paired samples were performed utilizing the paired sample t-test. P < 0.05 was considered to indicate statistical significance.
Results
Construction of the MIRGPI
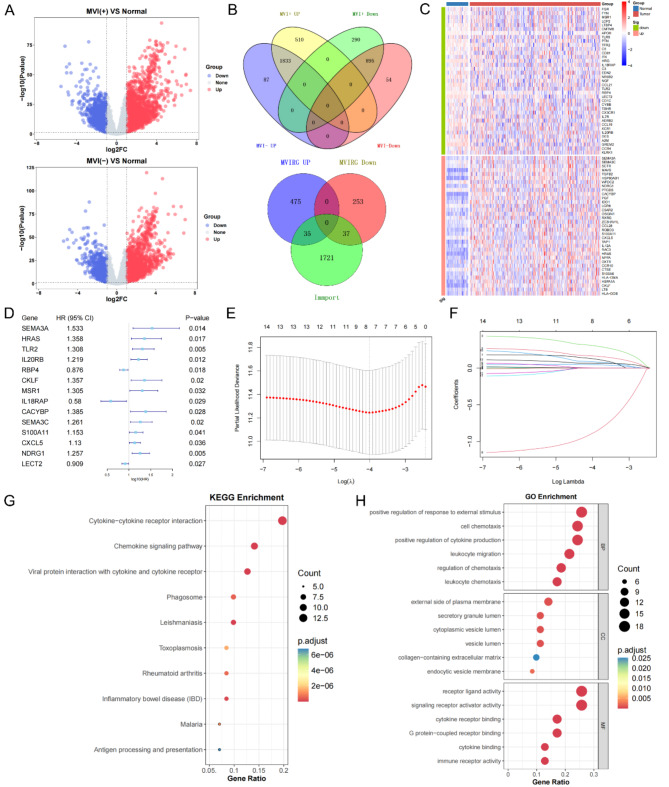
Differential genes were screened in MVI (+) tumor tissue versus normal tissue and MVI (-) tumor tissue versus normal tissue, respectively (Fig. 2A). 510 MRGs upregulated only in MVI (+) and 290 MRGs downregulated only in MVI (+) were selected, and the intersection of MRGs and IRGs was subsequently taken to further screen out 72 MIRGs (Fig. 2B). The heatmap demonstrated the expression levels of the MIRGs in different samples (Fig. 2C). To explore the functional alterations induced by MIRGs and the effects on pathways, we performed KEGG and GO enrichment analyses. The KEGG enrichment results revealed that the MIRGs basically participated in the pathway of cytokine-cytokine receptor interactions (Fig. 2G). We also performed GO enrichment to further understand the molecular functions (Fig. 2H). To identify the MIRGs associated with prognosis, we performed a univariate Cox regression analysis (Supplementary Table 2), which yielded 14 MIRGs (Fig. 2D). Finally, 8 robust genes (SEMA3A, HRAS, TLR2, IL20RB, CKLF, IL18RAP, SEMA3C, and NDRG1) significantly associated with OS were determined via LASSO Cox regression (Fig. 2E, F). The risk score in accordance with the 8-gene MIRGPI model was calculated using the equation below: risk score = (0.129121784 × SEMA3A) + (0.16680816 × HRAS) + (0.308778099 × TLR2) + (0.047453792 × IL20RB) + (0.003047059 × CKLF) + (-0.891172171 × IL18RAP) + (0.088204116 × SEMA3C) + (0.068629362 × NDRG1).
Fig. 2.
Construction of the MIRGPI. (A) Volcano plots of DEGs between MVI (+) tumor and normal tissue (Up) and MVI (-) tumor and normal tissue (Down). (B) The Venn diagram showed 800 identified MRGs (Up) and 72 identified MIRGs (Down). (C) Heatmap showed the expression levels of 72 MIRGs in tumor and normal tissues. (D) Forest plot of 14 prognostically relevant MIRGs. (E, F) LASSO regression results for 14 MIRGs. Results of KEGG (G) and GO (H) enrichment analysis of 72 MIRGs.
Evaluation and validation of the MIRGPI signature
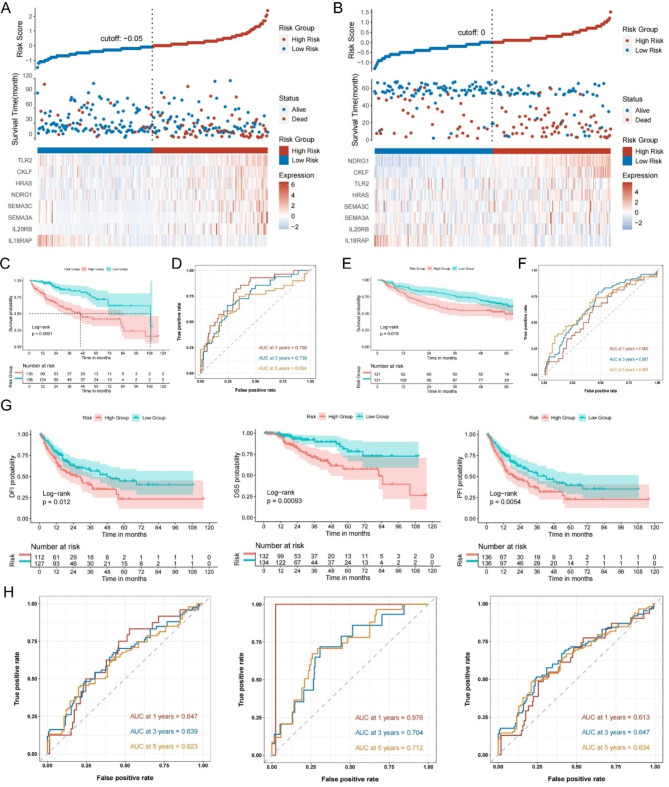
In the TCGA and GEO cohorts, the median risk score was set as the threshold for the two risk groups. Risk factor linkage plots visualized that high risk group corresponded to high risk scores and high mortality rates (Fig. 3A, B). The KM curves illustrated that the high-risk groups of the two cohorts corresponded to lower OS (Fig. 3C, E). In the TCGA cohort, the area under the ROC curve (AUC) of the MIRGPI was 0.790, 0.738 and 0.694 for predicting 1-, 3-, and 5-year OS (Fig. 3D), and in the GEO cohort, they are 0.600, 0.667 0.663 (Fig. 3F). Meanwhile, the KM survival curves and ROC curves based on disease-specific survival (DSS), disease-free survival (DFI), and progression-free survival (PFI) in the TCGA cohort demonstrated the superior efficacy of the MIRGPI in predicting prognosis (Fig. 3G, H). To further validate the reliability of MIRGPI, we evaluated the associations of risk scores with common clinicopathologic factors (age, gender, stage, T stage and grade). The risk scores were bound up with stage, T stage and gender in the TCGA cohort according to the results (Supplementary Fig. 1A-E). Higher staging in the GEO cohort was associated with higher risk scores (Supplementary Fig. 1F-H). We also validated this finding in a dataset containing patients with HCC at all stages (GSE6764) and found that the risk score had higher values as the disease progressed (Supplementary Fig. 1I). Subsequently, stratified analyses were performed for each clinical characteristic, and KM curves indicated that OS was worse in high-risk patients in all the remaining subgroups except for the Stage III + Stage IV subgroup. (Supplementary Fig. 2). These results demonstrated that the MIRGPI has good predictive and discriminatory ability.
Fig. 3.
Evaluation and validation of the MIRGPI signature. Risk survival status chart for the TCGA cohort (A) and GEO cohort (B). KM survival curve of OS in two risk subgroups in the cohort of TCGA (C) and GEO (E). The MIRGPI’s prediction accuracy for OS was assessed by the time-dependent ROC curves in the TCGA cohort (D) and GEO cohort (F). (G) KM survival curve differences in DFI, DSS and PFI for two risk subgroups in the TCGA cohort. (H) The accuracy of the MIRGPI in predicting 1-, 3-, and 5-year DFI, DSS, and PFI was assessed by ROC curves in the TCGA cohort.
Establishment of the MIRGPI-associated nomogram
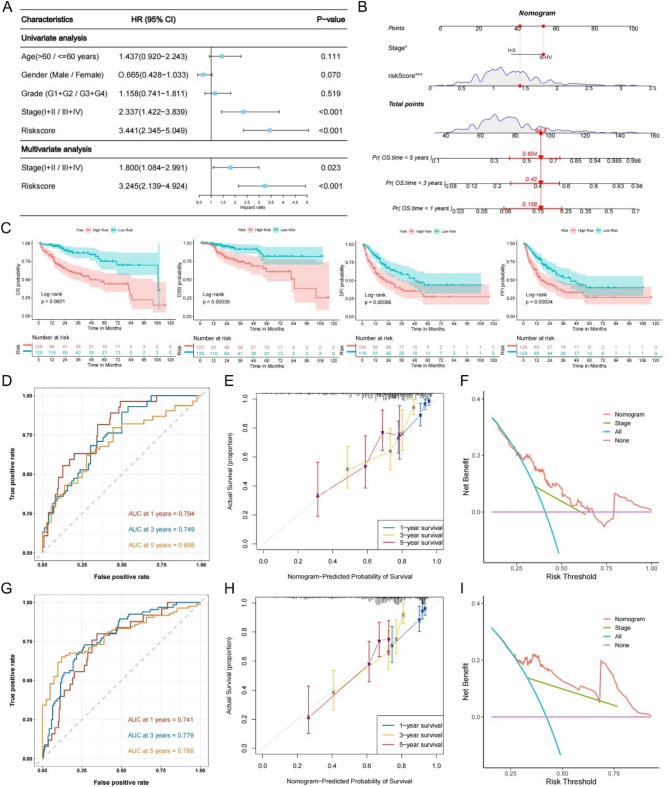
The results of univariate Cox and multivariate Cox regression showed that the MIRGPI and stage were independent risk factors correlated with prognosis (Fig. 4A). In addition, we also conducted validation on the GEO dataset, and the results were consistent with the TCGA dataset (Supplementary Fig. 3). Thus, we constructed a nomogram model that included stage and the MIRGPI (Fig. 4B). The results revealed that the KM survival curves for OS, DSS, DFI and PFI showed significant between-group differences (Fig. 4C). In addition, ROC curves, calibration curves, and DCA curves proved the good model performance in the TCGA and GEO cohorts (Fig. 4D-I). In summary, the MIRGPI-related nomogram model is ideal for the prognosis of HCC with strong clinical utility.
Fig. 4.
Establishment of the MIRGPI-associated nomogram. (A) Univariate and multivariate Cox regression analyses of OS in the TCGA cohort. (B) The MIRGPI-related nomogram was developed for predicting 1-, 3-, and 5-year OS. (C) KM curves for OS, DSS, DFI, and PFI of the MIRGPI-related nomogram. The time-dependent ROC curves (D), calibration plots (E) and DCA decision curves (F) for the MIRGPI-related nomogram in the TCGA cohort. ROC curves (G), calibration plots (H) and DCA decision curves (I) for the MIRGPI-related nomogram in the GEO cohort. *P < 0.05, ***P < 0.001.
Potential molecular mechanisms of the MIRGPI
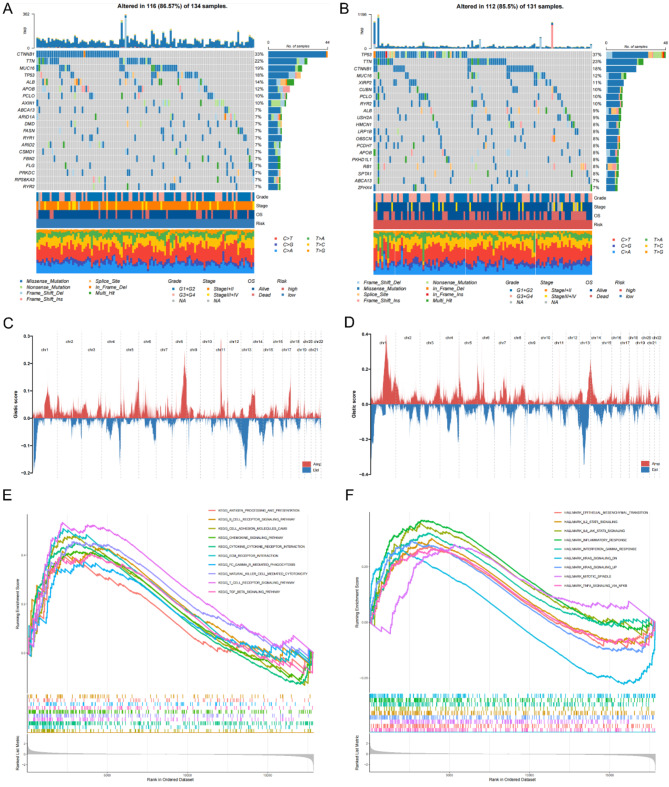
To explore the potential molecular mechanisms associated with MIRGPI, we analyzed the somatic mutations and found that the highly mutated genes in the low-risk group were CTNNB1 (33%), TTN (22%), MUC16 (19%), TP53 (18%), and ALB (14%), while in the high-risk group they were TP53 (37%), TTN (23%), CTNNB1 (18%), MUC16 (12%), and XIRP2 (11%) (Fig. 5A, B). The mutation information and statistical calculations are summarized in Supplementary Fig. 4A, B. CNV alteration landscapes display the differences of CNV distribution characteristics on 22 chromosomes in different MIRGPI subgroups populations (Fig. 5C, D), and the location of specific CNV variants per chromosome is shown in Supplementary Fig. 3C, D. Next, we explored the potential functions and pathways associated with MIRGPI (Supplementary Table 3). GSEA analysis annotated by the KEGG database showed that the majority of the high-risk group was correlated with “B cell receptor signaling pathway” and “cell adhesion molecule CAMS” (Fig. 5E). And these pathways are immunologically relevant. Besides, GSEA on the HALLMARK gene set manifested the close relationship between the high-risk group and inflammation-related pathways, such as “TNFA signaling via NFKB” and “inflammatory response” (Fig. 5F).
Fig. 5.
Potential molecular mechanisms of MIRGPI. Waterfall plots showing the top 20 genes with the highest mutation frequencies in the low-risk (A) and high-risk (B) groups. Distribution of CNV features on 22 chromosomes in the low-risk (C) and high-risk (D) groups. GESA enrichment results in the high-risk group annotated to the KEGG dataset (E) and the HALLMARK dataset (F).
Relationship between the MIRGPI and immune infiltration
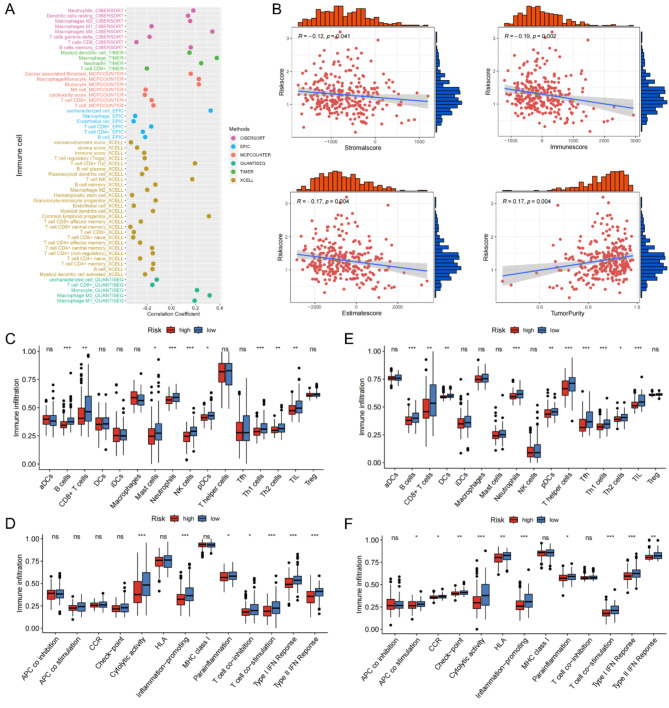
Since the MIRGPI is strongly associated with immune function, we further explored the connection between immune cell infiltration and risk score. The scatter plot manifests the negative correlation between risk score and CD8 + T cells, NK cells and M1-polarized macrophages. The scatter plot also manifests the positive correlations between the risk score and M2-polarized macrophages, neutrophils, cancer-associated fibroblasts (CAFs) and M0-polarized macrophages (Fig. 6A). In addition, the ESTIMATE algorithm results revealed that the MIRGPI was positively correlated with tumor purity and negatively correlated with immune, stromal, and ESTIMATE scores (Fig. 6B). Moreover, in both TCGA and GEO cohorts, tumor-infiltrating lymphocytes, Th1 cells, Th2 cells, plasmacytoid dendritic cells, B cells and CD8 + T cells showed low expression in the high-risk group (Fig. 6C, E). Meanwhile, cytolytic activity, inflammation-promoting, parainflammation and T cell co-stimulation of the high-risk group had lower enrichment scores (Fig. 6D, F).
Fig. 6.
Relationships between the MIRGPI and immune infiltration. (A) Scatterplot of the correlation between the risk score and immune cells. (B) Correlations of the risk score with the immune score, stromal score, estimated score and tumor purity. Enrichment scores of immune cells and immune pathways in different risk subgroups in the TCGA cohort (C,D) and GEO cohort (E,F). *P < 0.05, **P < 0.01, ***P < 0.001.
The MIRGPI predicts responsiveness to immunotherapy
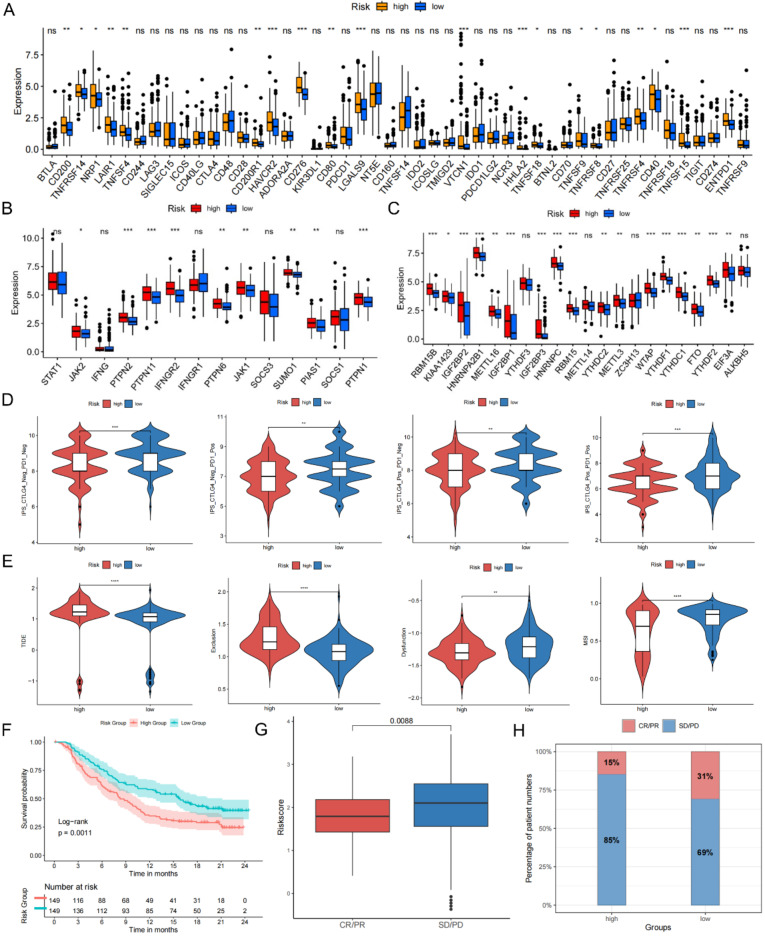
First, our study examined the gene expression of 48 immune checkpoints and found that 19 immune checkpoints manifested as low expression in the low-risk group (Fig. 7A). Given the strong correlation of risk scores with CD8 + T cells (Fig. 6A), we next evaluated the expression of critical molecules in the IFN-γ and m6A methylation pathways that are inseparably correlated with the antitumor role of CD8 + T cells. Our research manifested that the most key molecules expression showed marked difference in both MIRGPI groups (Fig. 7B, C). These results suggest that MIRGPI may have the capacity of predicting the immunotherapy response. The IPS and TIDE score were also used to assess patient responsiveness to immunotherapy and it revealed that the low-risk group were more likely to have low IPS and high TIDE scores (Fig. 7D, E). Furthermore, our study further validated the capacity of the MIRGPI in predicting immunotherapy efficacy utilizing the IMvigor210 immunotherapy cohort. We also confirmed the correlation between higher risk groups and shorter survival (Fig. 7F). The risk scores of patients in complete remission (CR) and partial remission (PR) with anti-PD-L1 therapy were significantly lower than those of patients with stable and progressive disease (SD, PD) (Fig. 7G), and proportion of low-risk patients responding to anti-PD-L1 therapy was higher (Fig. 7H). The above findings revealed that the low-risk group may be better suited for immunotherapy with good results.
Fig. 7.
MIRGPI predicts responsiveness to immunotherapy. (A) Expression levels of immune checkpoint molecules in different risk groups. (B) Expression levels of IFN-γ pathway markers in different risk groups. (C) Expression levels of m6A regulators in different risk groups. (D) Differences in IPS scores across risk subgroups. (E) Differences in TIDE, exclusion, dysfunction, and MSI scores across risk subgroups. (F) KM survival curves of the different risk groups in the IMvigor210 dataset. (G) Risk scores for patients with different efficacy statuses in the IMvigor210 dataset. (H) Patients’ percentage responding to anti-PD-1/L1 therapy in both risk subgroups in the IMvigor210 dataset. *P < 0.05, **P < 0.01, ***P < 0.001.
Prediction of treatment responses to TACE, Sorafenib and chemical drugs by MIRGPI
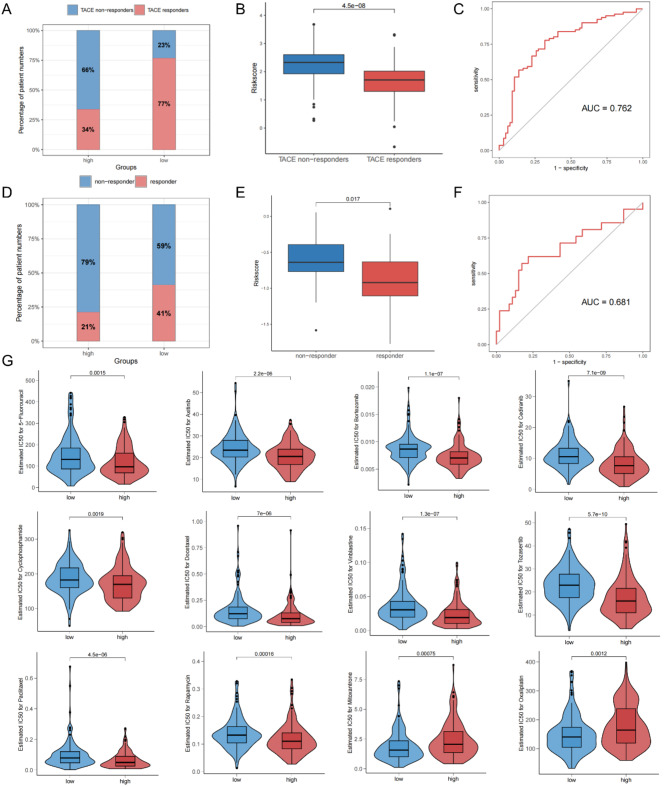
The GSE104580 and GSE109211 datasets were used to assess the potential response of different risk subgroups to TACE and sorafenib therapy, respectively. Response assessment of patients treated with TACE showed that significantly more patients responded in the low-risk group (Fig. 8A), and the risk score of responders was apparently lower than that of non-responders (Fig. 8B). The area under the ROC curve for predicting responsiveness to TACE treatment was 0.762 (Fig. 8C). The response assessment results were similar in patients treated with sorafenib (Fig. 8D-F). Then our research performed an assessment of the drug sensitivity of the MIRGPI subgroup (Supplementary Table 4). Our results showed that the high-risk group was more sensitive to 5-fluorouracil, axitinib, bortezomib, cediranib, cyclophosphamide, docetaxel, GDC0810, osimertinib, paclitaxel, and rapamycin (Fig. 8G). Meanwhile, the low-risk group had a higher sensitivity to mitoxantrone and oxaliplatin (Fig. 8G). These results suggest that MIRGPI can be a good predictor for the responsiveness of HCC patients to treatment with TACE, sorafenib and other common chemical drugs.
Fig. 8.
Prediction of treatment responses to TACE, sorafenib and chemical drugs by the MIRGPI. (A) Proportion of patients in different risk subgroups who responded to TACE therapy. (B) Risk scores for both the TACE non-responder and TACE responder groups. (C) ROC curves of the MIRGPI predicting the response to TACE therapy. (D) Proportion of patients in different risk subgroups who responded to sorafenib therapy. (E) Risk scores for both the sorafenib non-responder and sorafenib responder groups. (F) ROC curves of the MIRGPI predicting response to sorafenib therapy. (G) Half maximal inhibitory concentration (IC50) values of 5-fluorouracil, axitinib, bortezomib, cediranib, cyclophosphamide, docetaxel, GDC0810, osimertinib, paclitaxel, rapamycin, mitoxantrone, and oxaliplatin in both risk groups.
Upregulated SEMA3C in HCC tissues correlated with patient prognosis
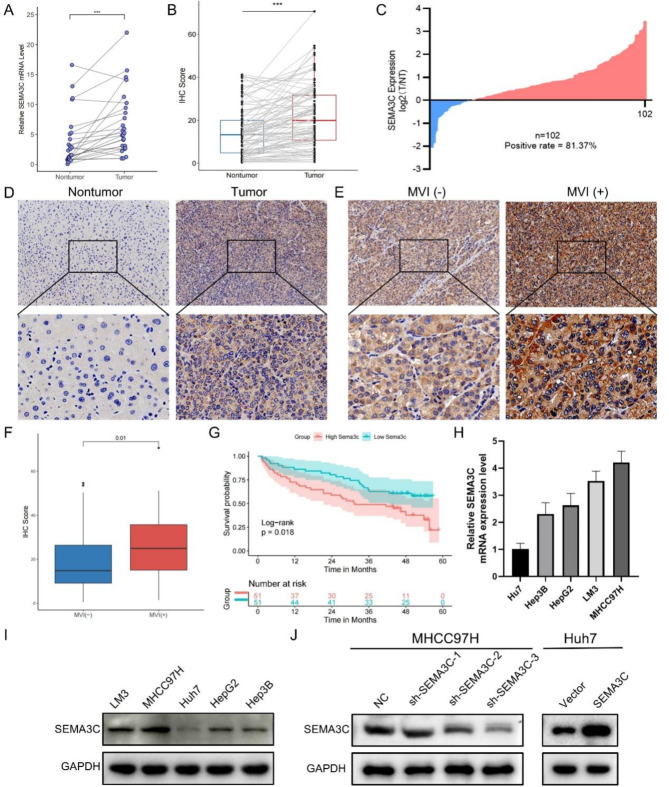
SEMA3C is vital in the development and progression of numerous tumors, but its biological function in HCC and underlying mechanisms remain unelucidated43. Therefore, in vitro experiments were performed for SEMA3C function determining. We first validated the mRNA levels of SEMA3C in 26 pairs of tumors and paired paracancerous tissues by qRT-PCR, and found that SEMA3C had higher mRNA levels in cancerous tissues (Fig. 9A). SEMA3C expression of 102 paired tissue microarrays was further evaluated by IHC. The results showed that tumor tissues had higher IHC scores than paired non-tumor tissues, and MVI (+) tumor tissues had higher IHC score than MVI (-) than tumor tissues (Fig. 9B-F). 102 patients with HCC were divided into two groups based on the median value of IHC score. The KM survival curve showed that the SEMA3C low expression group had a higher OS rate than the SEMA3C high expression group (Fig. 9G). Statistical analysis showed that tumor differentiation and MVI correlated with the expression level of SEMA3C (Supplementary Table 8). The findings illustrate that SEMA3C may be a significant prognostic molecule associated with MVI.
Fig. 9.
Upregulated SEMA3C in HCC tissues correlates with patient prognosis. (A) The mRNA levels of SEMA3C in 26 cases of HCC and their paired paracancerous tissues. (B) IHC scores of HCC and paired paracancerous tissues. (C) Scatterplot analysis of immunological scores in HCC and paired paracancerous tissues. (D,E) Representative immunohistochemical staining images of SEMA3C in nontumor, tumor, MVI (-) and MVI (+) tumor tissues. Original magnification, 200×, 400×. (F) IHC scores in MVI (-) tumor and MVI (+) tumor tissues. (G) KM curves show SEMA3C expression was correlated with OS. (H,I) SEMA3C mRNA and protein levels in human HCC cell lines (Huh7, Hep3B, HepG2, LM3, and MHCC97H). (J) Protein levels of SEMA3C in the NC group, sh-SEMA3C-1 group, sh-SEMA3C-2 group, and sh-SEMA3C-3 group in the MHCC97H cell line, as well as the protein levels of SEMA3C in the Vector group and SEMA3C group in the Huh7 cell line. ***P < 0.001.
SEMA3C inhibits HCC proliferation in vitro
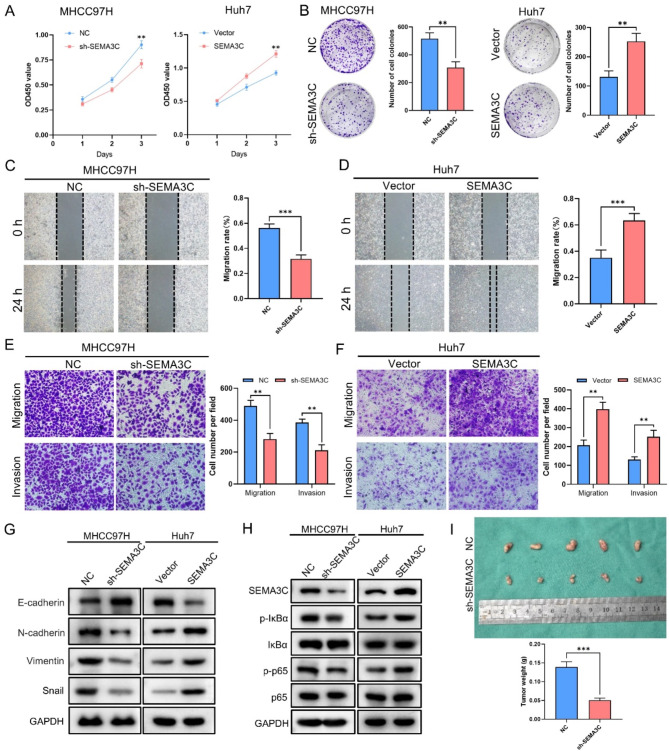
By qRT-PCR and WB, we first examined SEMA3C expression in five cell lines and revealed that SEMA3C expression was highest in MHCC97H and lowest in Huh7 (Fig. 9H). Therefore, we knocked down SEMA3C in MHCC97H cell line and overexpressed SEMA3C in Huh7 cell line (Fig. 9I). Transfection results showed that SEMA3C was successfully overexpressed in Huh7 cell line, and sh-SEMA3C-3 had the highest knockdown efficiency in MHCC97H cell line (Fig. 9J). We then chose the sh-SEMA3C-3 group to perform the subsequent experiments. The results of the CCK-8 and colony formation experiments demonstrated the SEMA3C overexpression contributed to proliferation efficiency, whereas knockdown of SEMA3C inhibited the proliferation efficiency of HCC (Fig. 10A, B).
Fig. 10.
SEMA3C may affect HCC cell migration and invasion by regulating the NF-κB/EMT Signaling Pathway. (A) Determination of cell proliferation capacity by CCK-8 assay. (B) Effect of SEMA3C on HCC cells colony formation. (C,D) The migratory activity of cells after knockdown or overexpression of SEMA3C was detected by the wound healing assay. Original magnification, 100×. (E,F) Migration and invasive activity of cells after knockdown or overexpression of SEMA3C by transwell assays. Original magnification, 200×. (G) The protein levels of E-cadherin, N-cadherin, Vimentin and Snail in the NC group, sh-SEMA3C group, Vector group, and SEMA3C group. (H) The protein levels of SEMA3C, p-IκBα, IκBα, p-p65 and p65 in the NC group, sh-SEMA3C group, Vector group, and SEMA3C group. (I) Images of tumor nodules in subcutaneous xenograft models of different groups of nude mice and statistical analysis of total weight of tumor nodules. **P < 0.01, ***P < 0.001.
SEMA3C promotes HCC migration and invasion by affecting EMT in vitro
To further clarify the role of SEMA3C in the development of HCC, we performed wound healing and transwell assays and found that SEMA3C overexpressed cells had a stronger migration and invasion ability compared to the Vector group, while compared to the NC group, the knockdown of SEMA3C effectively reduced the capacity of migration and invasion in cells (Fig. 10C-F). Previous studies found that SEMA3C promoted the epithelial-mesenchymal transition (EMT) process in pancreatic ductal adenocarcinoma and gastric adenocarcinoma44,45, and GSEA enrichment analysis of HCC patients revealed that high expression of SEMA3C was significantly enriched in the EMT pathway (Supplementary Fig. 5A). These results suggested that SEMA3C might affect the EMT process in HCC. To clarify the role of SEMA3C in EMT, we examined the protein levels of EMT-associated molecules and found that overexpression of SEMA3C decreased the protein levels of E-cadherin and increased the protein levels of N-cadherin, Vimentin and Snail (Fig. 10G). However, knockdown of SEMA3C led to the opposite results (Fig. 10G). In summary, SEMA3C affects the EMT process in HCC in vitro and thus promotes HCC cell migration and invasion.
SEMA3C activates the NF-κB signaling pathway in HCC
It was noted that SEMA3C could promote the tumorigenicity of glioma stem cells by activating the Rac1/NF-κB signaling pathway46. GSEA enrichment analysis also showed that the SEMA3C high expression group was enriched to the NF-κB signaling pathway (Supplementary Fig. 5B). These results suggest that SEMA3C may act by influencing the NF-κB pathway. We examined the expression of key molecules in the NF-κB pathway and found that SEMA3C overexpression increased the expression of p-p65/p65 and p-IκBα/IκBα (Fig. 10H). Conversely, knockdown of SEMA3C decreased the expression of p-p65/p65 and p-IκBα/IκBα (Fig. 10H). These results suggest that SEMA3C may act by activating the NF-κB signaling pathway in HCC cells.
Knockdown of SEMA3C inhibits HCC cell growth in vivo
SEMA3C can promote the proliferation of HCC cells in vitro. Subsequently, we studied the role of SEMA3C in tumor formation in vivo using a xenograft mouse model. The results showed that the total weight of tumors in the NC group was much greater than that in the sh-SEMA3C group (Fig. 10I). Consistent with in vitro studies, these results indicate that SEMA3C knockdown inhibits the proliferation of HCC cells.
Discussion
Hepatocellular carcinoma (HCC) is a high mortality malignancy. Patients often have already progressed to an intermediate to advanced stage of the disease with the poor prognosis when obtaining diagnosis2,3. A large number of published reports indicate that MVI is capable of predicting postoperative recurrence and the prognosis of HCC and can be used to guide the diagnosis and treatment of HCC4,6–8. However, current prediction models based on MVI characteristics have limited clinical value. We need more indicators that are good predictors of prognosis and response to treatment in HCC. In conjunction with the immunization factors, we screened eight genes by univariate Cox and LASSO Cox regression, and established a prediction model associated with MVI and immunity. The MIRGPI features were applied to classify the patients of TCGA and GEO cohorts into two risk groups. Subsequent analyses revealed better results of prognosis and responsiveness to immunotherapy, TACE, and sorafenib treatment in the low-risk group, and higher sensitivity to most chemotherapeutic agents in the high-risk group. Meanwhile, risk score was relevant to higher tumor stage, and after subgrouping based on a variety of clinicopathological features, the MIRGPI remained a good predictor of prognosis. Meanwhile, our study demonstrated the vital role of the MIRGPI in HCC prognosis and validated the value of the clinical application of the nomogram model. Thus, our MIRGPI features are reliable as an indicator to predict clinical prognosis and treatment response of HCC.
Several genes in the MIRGPI signature have been shown to be strongly related to the development and progression of HCC. Among them, NDRG1 is strongly related to HCC metastasis, recurrence and poor prognosis47, and can enhance the self-renewal ability of HCC stem cells by inhibiting EpCAM ubiquitination48. CKLF promotes the occurrence and HCC metastasis by activating the IL6/STAT3 pathway49. TLR2 is a member of the Toll-like receptor. The up-regulation of TLR2 enhances HBV-associated HCC invasion50. HRAS, a common oncogene, shows high expression in HCC and close connection with poor prognosis51. SEMA3A and SEMA3C, both of which belong to the semaphorin family, are significantly correlated with adverse prognosis with high expression in HCC52,53. SEMA3A can promote HCC by increasing tumor-associated macrophage infiltration52. Consistent with previous findings, we found that these oncogenes were prognostic risk factors for HCC, which may contribute to the higher MIRGPI risk score.
To investigate the distinctions in genetic alterations between the different MIRGPI groups, we performed somatic mutation analysis. The results revealed that the high-risk group had a significantly higher frequency of TP53 mutations compared to the low-risk group (37% vs. 18%). Studies have demonstrated the function of TP53 as the most common tumor suppressor in cells frequently mutated in HCC54. High TP53 mutations are associated with poorer clinicopathological features and poor prognosis based on previous studies55–57. In addition, the low-risk group had a significantly higher frequency of CTNNB1 mutations compared to the high-risk group (33% vs. 18%). Lu et al. showed that CTNNB1 mutations are linked to favorable pathologic features of HCC and suggest good prognosis58. The results illustrated that the low-risk group harboring high CTNNB1 and low TP53 mutations may have a better prognosis, which is consistent with the results of our analysis.
Considering that immune infiltration is strongly correlated with cancer onset, progression and the efficacy of immunotherapy59, we analyzed the immune infiltration of the different MIRGPI groups. M2-Polarized Macrophages, Neutrophils and CAFs, etc. infiltrated at a higher rate in high-risk HCC, and NK cells, M1 -Polarized Macrophages and CD8 + T cells, etc., had higher infiltration rates in low-risk HCC. CD8 + T cells serve as a vital part in the TIME and are important effector cells in anti-tumor immunity59. In HCC, downregulation of CD8 + T-cell activity promotes disease progression and is associated with lower survival60. NK cells are capable of producing various cytokines and chemokines, that are cytotoxic to tumor cells and participate in defense against tumor surveillance61. M1 and M2 macrophages are the two main macrophage subtypes. M1 macrophages are able to promote the expression of T-lymphocyte-activated antigens thereby promoting the elimination of tumor cells, whereas M2 macrophages are able to suppress the immune response to aid in the immune escape of tumor cells62. It has also been suggested that the aggressive phenotype in HCC is associated with low M1 macrophage infiltration and high M2 macrophage infiltration63. High accumulation of neutrophils promotes an inflammatory response leading to HCC progression and ultimately short survival61. CAFs, the most abundant constituent of the tumor stroma, are closely associated with HCC onset, progression, and chemoresistance, and lead to a poor prognosis64. The findings reveal that the possible reason for the poorer prognosis of the high-risk group is the hyperinfiltration of these immunosuppressive cells and the hypoinfiltration of protective immune cells.
Recently, immunotherapies for HCC patients, including ICI therapies, have improved dramatically15. However, most HCC patients have poor responsiveness to immunotherapy, which may be correlated with patients’ different TIME. To assess the sensitivity of HCC patients in different risk groups to immunotherapy, we performed differential analysis of the expression of 48 common immune checkpoints. The results showed the strong correlation of most immune checkpoints with risk scores. We also evaluated the expression levels of key molecules in the pathways related to the antitumor capacity of CD8 + T cells (IFN-γ and m6A pathways) of different MIRGPI subgroups, and showed that the majority of the molecules differed significantly among the different subgroups of HCC patients. In addition, the low-risk group acquired lower TIDE scores and higher IPS scores. Evaluation of the IMvigor210 dataset showed a higher proportion of responders to immunotherapy and a superior prognosis among patients in the low-risk group. Our study illustrated that immunotherapy may be better for low-risk patients. Furthermore, we assessed the correlation of the MIRGPI with the response to sorafenib and TACE therapy, and the outcomes revealed that low-risk patients had a more desirable response to sorafenib or TACE therapy. Drug sensitization analysis was performed and the high-risk group showed higher sensitivity to common chemotherapeutic agents such as 5-fluorouracil, Cyclophosphamide, Paclitaxel and Rapamycin.
The association between SEMA3C and cancer has received increasing attention. Research has revealed that SEMA3C shows high gene expression in most cancers and promotes tumorigenesis and progression65. SEMA3C has been reported to promote oncogenic prostate cancer cell growth through trans-activation of multiple tyrosine kinase receptors by Plexin B166. In glioblastoma, SEMA3C can activate the wnt pathway independently of wnt ligands to promote tumor progression67. In addition, SEMA3C can activate the ERK1/2 signaling pathway to promote the development of pancreatic cancer45. However, the function of SEMA3C in HCC needs to be explored in depth by more studies. Our research explored that SEMA3C promoted the proliferation, migration and invasive ability of HCC through in vitro and in vivo experiments, which may be related to the activating of the NF-κB pathway.
There are still several limitations in this study. Firstly, MIRGPI characteristics need to be explored further in other large prospective cohorts. Secondly, the oncogenic mechanism of SEMA3C needs to be investigated in depth, and the biological functions of other MIRGPI characterized genes in HCC need to be clarified.
Conclusion
In summary, this study demonstrated that the MIRGPI signature is a good indicator for predicting the prognosis and therapeutic response of HCC. In addition, the function of SEMA3C in HCC cells and its potential mechanism were also verified by in vitro and in vivo experiments. These results are significant for the assessment of the individualized therapy and prognosis of HCC.
Electronic supplementary material
Below is the link to the electronic supplementary material.
Acknowledgements
Not applicable.
Author contributions
All authors contributed to the study conception and design. Methodology, H.F., Z.Y. and M.K.; software, H.L. and L.Q.; validation, H.L. and L.Q.; formal analysis, H.L., R.G. and M.K.; investigation, H.F. and L.Q.; resources, W.G. and R.G.; data curation, H.L. and M.K.; writing—original draft preparation, H.L.; writing—review and editing, W.G. and R.G.; visualization, H.L.; supervision, W.G.; project administration, W.G. and R.G.; funding acquisition, W.G. and Z.Y. All authors have read and agreed to the published version of the manuscript. All authors agree to publish.
Funding
This work was supported by the National Natural Science Foundations of China [grant numbers 82170648, 82370646, 32201068].
Data availability
The datasets used and analyzed during the current study are available from the corresponding author on reasonable request. The data that support the results of current study is available on The Cancer Genome Atlas (TCGA) and Gene Expression Omnibus (GEO) websites.
Declarations
Competing interests
The authors declare no competing interests.
Ethics
All patients signed an informed consent form. The study was approved by the Ethics Committee of the First Affiliated Hospital of Zhengzhou University [Approval number: 2023-KY-1008].
Footnotes
Publisher’s note
Springer Nature remains neutral with regard to jurisdictional claims in published maps and institutional affiliations.
Hao Li, Lixue Qiao and Minyu Kong contributed equally to this work.
Contributor Information
Ran Guo, Email: ranguo16@163.com.
Wenzhi Guo, Email: guowz66@163.com.
References
- 1.Couri, T. & Pillai, A. Goals and targets for personalized therapy for HCC. Hepatol. Int.13, 125–137. 10.1007/s12072-018-9919-1 (2019). [DOI] [PubMed] [Google Scholar]
- 2.Nevola, R. et al. Predictors of early and late hepatocellular carcinoma recurrence. World J. Gastroenterol.29, 1243–1260. 10.3748/wjg.v29.i8.1243 (2023). [DOI] [PMC free article] [PubMed] [Google Scholar]
- 3.Chakraborty, E. & Sarkar, D. Emerging therapies for Hepatocellular Carcinoma (HCC). Cancers (Basel). 14. 10.3390/cancers14112798 (2022). [DOI] [PMC free article] [PubMed]
- 4.Zhao, X. et al. Roles and molecular mechanisms of biomarkers in hepatocellular carcinoma with microvascular invasion: A review. J. Clin. Transl Hepatol.11, 1170–1183. 10.14218/JCTH.2022.00013S (2023). [DOI] [PMC free article] [PubMed] [Google Scholar]
- 5.Li, J. et al. Preoperative prediction and risk assessment of microvascular invasion in hepatocellular carcinoma. Crit. Rev. Oncol. Hematol.190, 104107. 10.1016/j.critrevonc.2023.104107 (2023). [DOI] [PubMed] [Google Scholar]
- 6.Chen, S. L. et al. The presence of microvascular invasion guides treatment strategy in recurrent HBV-related HCC. Eur. Radiol.30, 3473–3485. 10.1007/s00330-019-06640-8 (2020). [DOI] [PubMed] [Google Scholar]
- 7.Wang, K. et al. A novel classification in predicting prognosis and guiding postoperative management after R0 liver resection for patients with hepatocellular carcinoma and microvascular invasion. Eur. J. Surg. Oncol.48, 1348–1355. 10.1016/j.ejso.2021.12.466 (2022). [DOI] [PubMed] [Google Scholar]
- 8.Lin, W. D. et al. Wide surgical margins improve prognosis for HCC with microvascular invasion. Eur. Rev. Med. Pharmacol. Sci.27, 2052–2059. 10.26355/eurrev_202303_31576 (2023). [DOI] [PubMed] [Google Scholar]
- 9.Lv, K. et al. Radiomics for the detection of microvascular invasion in hepatocellular carcinoma. World J. Gastroenterol.28, 2176–2183. 10.3748/wjg.v28.i20.2176 (2022). [DOI] [PMC free article] [PubMed] [Google Scholar]
- 10.Donne, R. & Lujambio, A. The liver cancer immune microenvironment: Therapeutic implications for hepatocellular carcinoma. Hepatology. 77, 1773–1796. 10.1002/hep.32740 (2023). [DOI] [PMC free article] [PubMed] [Google Scholar]
- 11.Zhang, Z. J. et al. Identification of immune related gene signature for predicting prognosis of cholangiocarcinoma patients. Front. Immunol.14, 1028404. 10.3389/fimmu.2023.1028404 (2023). [DOI] [PMC free article] [PubMed] [Google Scholar]
- 12.Lin, X. H. et al. Six immune-related promising biomarkers may promote hepatocellular carcinoma prognosis: A bioinformatics analysis and experimental validation. Cancer Cell. Int.23, 52. 10.1186/s12935-023-02888-9 (2023). [DOI] [PMC free article] [PubMed] [Google Scholar]
- 13.Li, C. et al. An immune-related gene prognostic index for predicting prognosis in patients with colorectal cancer. Front. Immunol.14, 1156488. 10.3389/fimmu.2023.1156488 (2023). [DOI] [PMC free article] [PubMed] [Google Scholar]
- 14.Oura, K., Morishita, A., Tani, J. & Masaki, T. Tumor immune microenvironment and immunosuppressive therapy in hepatocellular carcinoma: A review. Int. J. Mol. Sci.2210.3390/ijms22115801 (2021). [DOI] [PMC free article] [PubMed]
- 15.Vaddepally, R. K., Kharel, P., Pandey, R., Garje, R. & Chandra, A. B. Review of indications of FDA-approved immune checkpoint inhibitors per NCCN guidelines with the level of evidence. Cancers (Basel). 1210.3390/cancers12030738 (2020). [DOI] [PMC free article] [PubMed]
- 16.Tang, Y. et al. Identification and validation of a prognostic model based on three MVI-related genes in hepatocellular carcinoma. Int. J. Biol. Sci.18, 261–275. 10.7150/ijbs.66536 (2022). [DOI] [PMC free article] [PubMed] [Google Scholar]
- 17.Wang, J. et al. A predictive and prognostic model for hepatocellular carcinoma with microvascular invasion based TCGA database genomics. BMC Cancer. 21, 1337. 10.1186/s12885-021-09047-1 (2021). [DOI] [PMC free article] [PubMed] [Google Scholar]
- 18.Goldman, M. J. et al. Visualizing and interpreting cancer genomics data via the Xena platform. Nat. Biotechnol.38, 675–678. 10.1038/s41587-020-0546-8 (2020). [DOI] [PMC free article] [PubMed] [Google Scholar]
- 19.Edgar, R., Domrachev, M. & Lash, A. E. Gene expression Omnibus: NCBI gene expression and hybridization array data repository. Nucleic Acids Res.30, 207–210 (2002). [DOI] [PMC free article] [PubMed] [Google Scholar]
- 20.Cai, J. et al. Bulk and single-cell transcriptome profiling reveal extracellular matrix mechanical regulation of lipid metabolism reprograming through YAP/TEAD4/ACADL axis in hepatocellular carcinoma. Int. J. Biol. Sci.19, 2114–2131. 10.7150/ijbs.82177 (2023). [DOI] [PMC free article] [PubMed] [Google Scholar]
- 21.Bhattacharya, S. et al. ImmPort: Disseminating data to the public for the future of immunology. Immunol. Res.58, 234–239. 10.1007/s12026-014-8516-1 (2014). [DOI] [PubMed] [Google Scholar]
- 22.Love, M. I., Huber, W. & Anders, S. Moderated estimation of fold change and dispersion for RNA-seq data with DESeq2. Genome Biol.15, 550 (2014). [DOI] [PMC free article] [PubMed] [Google Scholar]
- 23.Kanehisa, M. & Goto, S. KEGG: Kyoto encyclopedia of genes and genomes. Nucleic Acids Res.28, 27–30 (2000). [DOI] [PMC free article] [PubMed] [Google Scholar]
- 24.Kanehisa, M. Toward understanding the origin and evolution of cellular organisms. Protein Sci.28, 1947–1951. 10.1002/pro.3715 (2019). [DOI] [PMC free article] [PubMed] [Google Scholar]
- 25.Kanehisa, M., Furumichi, M., Sato, Y., Kawashima, M. & Ishiguro-Watanabe, M. KEGG for taxonomy-based analysis of pathways and genomes. Nucleic Acids Res.51, D587–D592. 10.1093/nar/gkac963 (2023). [DOI] [PMC free article] [PubMed] [Google Scholar]
- 26.Yu, G., Wang, L. G., Han, Y. & He, Q. Y. clusterProfiler: An R package for comparing biological themes among gene clusters. OMICS. 16, 284–287. 10.1089/omi.2011.0118 (2012). [DOI] [PMC free article] [PubMed] [Google Scholar]
- 27.Cai, W. Y. et al. Identification of a tumor microenvironment-relevant gene set-based prognostic signature and related therapy targets in gastric cancer. Theranostics. 10, 8633–8647. 10.7150/thno.47938 (2020). [DOI] [PMC free article] [PubMed] [Google Scholar]
- 28.Mayakonda, A., Lin, D. C., Assenov, Y., Plass, C. & Koeffler, H. P. Maftools: Efficient and comprehensive analysis of somatic variants in cancer. Genome Res.28, 1747–1756. 10.1101/gr.239244.118 (2018). [DOI] [PMC free article] [PubMed] [Google Scholar]
- 29.Newman, A. M. et al. Robust enumeration of cell subsets from tissue expression profiles. Nat. Methods. 12, 453–457. 10.1038/nmeth.3337 (2015). [DOI] [PMC free article] [PubMed] [Google Scholar]
- 30.Yeo, J. G. et al. The extended polydimensional immunome characterization (EPIC) web-based reference and discovery tool for cytometry data. Nat. Biotechnol.38, 679–684. 10.1038/s41587-020-0532-1 (2020). [DOI] [PubMed] [Google Scholar]
- 31.Becht, E. et al. Estimating the population abundance of tissue-infiltrating immune and stromal cell populations using gene expression. Genome Biol.17, 218 (2016). [DOI] [PMC free article] [PubMed] [Google Scholar]
- 32.Finotello, F. et al. Molecular and pharmacological modulators of the tumor immune contexture revealed by deconvolution of RNA-seq data. Genome Med.11, 34. 10.1186/s13073-019-0638-6 (2019). [DOI] [PMC free article] [PubMed] [Google Scholar]
- 33.Li, T. et al. TIMER2.0 for analysis of tumor-infiltrating immune cells. Nucleic Acids Res.48, W509–W514. 10.1093/nar/gkaa407 (2020). [DOI] [PMC free article] [PubMed] [Google Scholar]
- 34.Aran, D., Hu, Z. & Butte, A. J. xCell: Digitally portraying the tissue cellular heterogeneity landscape. Genome Biol.18, 220. 10.1186/s13059-017-1349-1 (2017). [DOI] [PMC free article] [PubMed] [Google Scholar]
- 35.Guo, C., Tang, Y., Zhang, Y. & Li, G. Mining TCGA data for key biomarkers related to immune microenvironment in endometrial cancer by immune score and weighted correlation network analysis. Front. Mol. Biosci.8, 645388. 10.3389/fmolb.2021.645388 (2021). [DOI] [PMC free article] [PubMed] [Google Scholar]
- 36.Hänzelmann, S., Castelo, R. & Guinney, J. GSVA: gene set variation analysis for microarray and RNA-seq data. BMC Bioinform.1410.1186/1471-2105-14-7 (2013). [DOI] [PMC free article] [PubMed]
- 37.Xu, F. et al. Analysis of lung adenocarcinoma subtypes based on immune signatures identifies clinical implications for cancer therapy. Mol. Ther. Oncol. 17, 241–249. 10.1016/j.omto.2020.03.021 (2020). [DOI] [PMC free article] [PubMed] [Google Scholar]
- 38.Xu, Q. et al. Landscape of prognostic m6A RNA methylation regulators in hepatocellular carcinoma to aid immunotherapy. Front. Cell. Dev. Biol.9, 669145. 10.3389/fcell.2021.669145 (2021). [DOI] [PMC free article] [PubMed] [Google Scholar]
- 39.Jiang, P. et al. Signatures of T cell dysfunction and exclusion predict cancer immunotherapy response. Nat. Med.24, 1550–1558. 10.1038/s41591-018-0136-1 (2018). [DOI] [PMC free article] [PubMed] [Google Scholar]
- 40.Charoentong, P. et al. Pan-cancer immunogenomic analyses reveal genotype-immunophenotype relationships and predictors of response to checkpoint blockade. Cell. Rep.18, 248–262. 10.1016/j.celrep.2016.12.019 (2017). [DOI] [PubMed] [Google Scholar]
- 41.Maeser, D., Gruener, R. F. & Huang, R. S. oncoPredict: An R package for predicting in vivo or cancer patient drug response and biomarkers from cell line screening data. Brief. Bioinform. 2210.1093/bib/bbab260 (2021). [DOI] [PMC free article] [PubMed]
- 42.Li, H. et al. Pectolinarigenin attenuates hepatic ischemia/reperfusion injury via activation of the PI3K/AKT/Nrf2 signaling pathway. Chem. Biol. Interact.386, 110763. 10.1016/j.cbi.2023.110763 (2023). [DOI] [PubMed] [Google Scholar]
- 43.Bica, C. et al. Emerging roles and mechanisms of semaphorins activity in cancer. Life Sci.318, 121499. 10.1016/j.lfs.2023.121499 (2023). [DOI] [PubMed] [Google Scholar]
- 44.Li, M. et al. Sema3C promotes hepatic metastasis and predicts poor prognosis in gastric adenocarcinoma. J. Int. Med. Res.49, 3000605211009802. 10.1177/03000605211009802 (2021). [DOI] [PMC free article] [PubMed] [Google Scholar]
- 45.Xu, X. et al. Increased semaphorin 3c expression promotes tumor growth and metastasis in pancreatic ductal adenocarcinoma by activating the ERK1/2 signaling pathway. Cancer Lett.397, 12–22. 10.1016/j.canlet.2017.03.014 (2017). [DOI] [PubMed] [Google Scholar]
- 46.Man, J. et al. Sema3C promotes the survival and tumorigenicity of glioma stem cells through Rac1 activation. Cell. Rep.9, 1812–1826. 10.1016/j.celrep.2014.10.055 (2014). [DOI] [PMC free article] [PubMed] [Google Scholar]
- 47.Cheng, J. et al. NDRG1 as a biomarker for metastasis, recurrence and of poor prognosis in hepatocellular carcinoma. Cancer Lett.310, 35–45. 10.1016/j.canlet.2011.06.001 (2011). [DOI] [PubMed] [Google Scholar]
- 48.Cheng, Q. et al. NDRG1 facilitates self-renewal of liver cancer stem cells by preventing EpCAM ubiquitination. Br. J. Cancer. 129, 237–248. 10.1038/s41416-023-02278-y (2023). [DOI] [PMC free article] [PubMed] [Google Scholar]
- 49.Liu, Y. et al. CKLF1 enhances inflammation-mediated carcinogenesis and prevents Doxorubicin-Induced apoptosis via IL6/STAT3 signaling in HCC. Clin. Cancer Res.25, 4141–4154. 10.1158/1078-0432.CCR-18-3510 (2019). [DOI] [PubMed] [Google Scholar]
- 50.Cheng, S. et al. Hepatitis B surface antigen promotes the invasion of hepatitis B virus-related hepatocellular carcinoma cells by upregulation of toll-like receptor 2. Viral Immunol.30, 232–239. 10.1089/vim.2016.0162 (2017). [DOI] [PubMed] [Google Scholar]
- 51.Dietrich, P. et al. Combined effects of PLK1 and RAS in hepatocellular carcinoma reveal rigosertib as promising novel therapeutic dual-hit option. Oncotarget. 9, 3605–3618. 10.18632/oncotarget.23188 (2018). [DOI] [PMC free article] [PubMed] [Google Scholar]
- 52.Hu, Z. Q. et al. Overexpression of semaphorin 3A promotes tumor progression and predicts poor prognosis in hepatocellular carcinoma after curative resection. Oncotarget. 7, 51733–51746. 10.18632/oncotarget.10104 (2016). [DOI] [PMC free article] [PubMed] [Google Scholar]
- 53.Feng, X. et al. The evaluative value of Sema3C and MFN2 co-expression detected by immunohistochemistry for prognosis in hepatocellular carcinoma patients after hepatectomy. Onco Targets Ther.9, 3213–3221. 10.2147/OTT.S98322 (2016). [DOI] [PMC free article] [PubMed] [Google Scholar]
- 54.Comprehensive and Integrative Genomic Characterization of Hepatocellular Carcinoma. Cell169, doi:10.1016/j.cell.2017.05.046 (2017). [DOI] [PMC free article] [PubMed]
- 55.Di Agostino, S. The impact of mutant p53 in the non-coding RNA world. Biomolecules. 1010.3390/biom10030472 (2020). [DOI] [PMC free article] [PubMed]
- 56.Wang, X., Chen, D. & Chen, B. The long-to-short-axis ratio and multifocality are associated with TP53 mutation status in surgically resected hepatocellular carcinomas. Acad. Radiol.27, 1720–1726. 10.1016/j.acra.2018.04.021 (2020). [DOI] [PubMed] [Google Scholar]
- 57.Calderaro, J. et al. Histological subtypes of hepatocellular carcinoma are related to gene mutations and molecular tumour classification. J. Hepatol.67, 727–738. 10.1016/j.jhep.2017.05.014 (2017). [DOI] [PubMed] [Google Scholar]
- 58.Lu, G., Lin, J., Song, G. & Chen, M. Prognostic significance of CTNNB1 mutation in hepatocellular carcinoma: A systematic review and meta-analysis. Aging (Albany NY). 15, 9759–9778. 10.18632/aging.205047 (2023). [DOI] [PMC free article] [PubMed] [Google Scholar]
- 59.Hao, X. et al. Targeting immune cells in the tumor microenvironment of HCC: New opportunities and challenges. Front. Cell. Dev. Biol.9, 775462. 10.3389/fcell.2021.775462 (2021). [DOI] [PMC free article] [PubMed] [Google Scholar]
- 60.Liu, P. et al. A key driver to promote HCC: Cellular crosstalk in tumor microenvironment. Front. Oncol.13, 1135122. 10.3389/fonc.2023.1135122 (2023). [DOI] [PMC free article] [PubMed] [Google Scholar]
- 61.Pham, L. et al. The functional roles of immune cells in primary liver cancer. Am. J. Pathol.192, 826–836. 10.1016/j.ajpath.2022.02.004 (2022). [DOI] [PMC free article] [PubMed] [Google Scholar]
- 62.Huang, J., Wu, Q., Geller, D. A. & Yan, Y. Macrophage metabolism, phenotype, function, and therapy in hepatocellular carcinoma (HCC). J. Transl Med.21, 815. 10.1186/s12967-023-04716-0 (2023). [DOI] [PMC free article] [PubMed] [Google Scholar]
- 63.Huang, Y. et al. The role of tumor associated macrophages in hepatocellular carcinoma. J. Cancer. 12, 1284–1294. 10.7150/jca.51346 (2021). [DOI] [PMC free article] [PubMed] [Google Scholar]
- 64.Peng, H., Zhu, E. & Zhang, Y. Advances of cancer-associated fibroblasts in liver cancer. Biomark. Res.10, 59. 10.1186/s40364-022-00406-z (2022). [DOI] [PMC free article] [PubMed] [Google Scholar]
- 65.Hui, D. H. F., Tam, K. J., Jiao, I. Z. F. & Ong, C. J. Semaphorin 3 C as a therapeutic target in prostate and other cancers. Int. J. Mol. Sci.2010.3390/ijms20030774 (2019). [DOI] [PMC free article] [PubMed]
- 66.Peacock, J. W. et al. SEMA3C drives cancer growth by transactivating multiple receptor tyrosine kinases via plexin B1. EMBO Mol. Med.10, 219–238. 10.15252/emmm.201707689 (2018). [DOI] [PMC free article] [PubMed] [Google Scholar]
- 67.Hao, J. et al. Sema3C signaling is an alternative activator of the canonical WNT pathway in glioblastoma. Nat. Commun.14, 2262. 10.1038/s41467-023-37397-w (2023). [DOI] [PMC free article] [PubMed] [Google Scholar]
Associated Data
This section collects any data citations, data availability statements, or supplementary materials included in this article.
Supplementary Materials
Data Availability Statement
The datasets used and analyzed during the current study are available from the corresponding author on reasonable request. The data that support the results of current study is available on The Cancer Genome Atlas (TCGA) and Gene Expression Omnibus (GEO) websites.


