

Abstract
Purpose:
Using ultrashort echo time (UTE) MRI, we determined prevalence of abnormal cartilaginous endplate (CEP), and the relationship between CEP and disc degeneration in human lumbar spines.
Materials and Methods:
Lumbar spines from 71 cadavers (age 14 to 74 years) were imaged at 3T using sagittal UTE and spin echo T2 map sequences. On UTE images CEP morphology was defined as “normal” with linear high signal intensity or “abnormal” with focal signal loss and/or irregularity. On spin echo images disc grade and T2 values of the nucleus pulposus (NP) and anulus fibrosus (AF) were determined. 547 CEPs and 284 discs were analyzed. Effects of age, sex, and level on CEP morphology, disc grade, and T2 values were determined. Effects of CEP abnormality on disc grade, T2 of NP, and T2 of AF were also determined.
Results:
Overall prevalence of CEP abnormality was 33% and it tended to increase with older ages (p=0.08) and at lower spinal levels of L5 than L2 or L3 (p=0.001). Disc grades were higher and T2 values of the NP were lower in older spines (p<0.001) and at lower disc level of L4–5 (p<0.05). We found significant association between CEP and disc degeneration; discs adjacent to abnormal CEPs had high grades (p<0.01) and lower T2 values of the NP (p<0.05).
Conclusion:
These results suggest that abnormal CEPs are frequently found, and it associates significantly with disc degeneration, suggesting an insight into pathoetiology of disc degeneration.
Keywords: Low back pain, discovertebral junction, cartilage endplate, lumbar spine, disc degeneration, T2 relaxation
INTRODUCTION
Chronic low back pain is a significant health concern with a high socioeconomic cost [1]. The etiology for low back pain may include intervertebral disc (IVD) degeneration [2] correlating with pain on provocative discography [3], and vertebral endplate lesions such as Schmorl’s nodes [4]. Pathophysiology of these structures are important to understand.
IVD has subregions including the nucleus pulposus (NP), annulus fibrosus (AF), and superior and inferior cartilaginous endplates (CEP) and bony vertebral endplates [5]. The CEP is a thin (1 to 2 mm) [6] tissue serving as a mechanical stabilizer and a pathway for nutrient transport [7]. While the natural history of IVD degeneration is well known [8], CEP alterations with aging and spinal level, and how they association with IVD degeneration is unclear.
Unfortunately, CEP is difficult to image using routine magnetic resonance imaging (MRI) protocol such as spin echo T1- and T2-weighted [9] sequences. This is due to short T2 properties of the CEP, whose signal decays quickly and becomes indistinguishable from the adjacent bony endplate. Ultrashort echo time (UTE) MR imaging overcomes this limitation, acquiring signal from short T2 tissues [10]. Using UTE imaging and echo subtraction to accentuate short T2 tissues, CEP can be imaged with high contrast and distinction [11]. In human spines, the normal and predominant UTE MR morphology of the CEP in the sagittal plane is that of continuous, linear, and high signal intensity [12], as expected from the anatomy [5]. Abnormal deviations in the CEP morphology include focal signal loss and other irregularities [12].
For disc evaluation, Pfirrmann grading criteria includes disc structure, signal intensity and disc height [13] observed in sagittal T2-weighted spin echo images, to classify discs from grade 1 (normal) to 5 (complete collapse). Another technique is quantification of T2 relaxation values. T2 values correlate with water and proteoglycan contents of the disc such that T2 decreases with water loss [14] and proteoglycan loss [14].
To date, few studies have evaluated correlation between CEP and disc degeneration. In ex vivo studies, CEP thickness heterogeneity correlated with increased disc degeneration [15]. In vivo, a study showed that individuals with low body mass index and younger age were more likely to have normal CEPs [16]. These studies suggested possible relationships between CEP alterations and disc degeneration, which we would like to explore further.
The purpose of our study was to investigate the frequency of normal and abnormal CEPs found in cadaveric lumbar spines with aging and level, and the relationship between CEP morphology with disc degeneration as assessed by Pfirrmann grading and T2 mapping. We hypothesize that degenerative changes in the CEP and the discs are affected by aging and level, and that a significant association exists between CEP abnormality and disc degeneration.
MATERIALS AND METHODS
This study does not involve human subjects or live animals, and was exempt by the institutional review board.
Samples
Cadaveric lumbar spines, mostly containing L1 to L5, were obtained from 71 donors (56 males, 15 females; 58.3 ± 9.8 years old, mean ± standard deviation). The spines were harvested from the cadavers without being previously frozen. Once harvested, the spines were picked up from the tissue bank, transported to MRI facility and imaged at the next availability.
MR Imaging
MR imaging was performed with a 3 Tesla MR scanner (GE Healthcare, Milwaukee, MI) with a clinical knee coil. The knee coil matched the size of the specimen (roughly 20 cm long from L1 to S1). We placed the specimen in a head-first prone position with the vertebral bodies close to the coil center and included inferior L1-superior L5 in the field of view to match the coil coverage. Each specimen was placed inside the scanner in a head-first, prone position and imaged in the mid-sagittal plane. Imaging protocol included a 2-Dimensional (2D) UTE sequence tailored for CEP, and a conventional multi-echo spin echo T2 (ME SE T2) mapping sequence suitable for both T2 quantification (8 echoes from 10 to 80 ms) and Pfirrmann grading using T2-weighted image at TE of 80 ms. Table 1 lists detailed scanning parameters.
Table 1.
MR scanning parameters.
| Sequence | Plane | TR (ms) | TE (ms) | Flip Angle (deg) | Slice (mm) | FOV (cm) | Phase × Freq. |
|---|---|---|---|---|---|---|---|
|
| |||||||
| UTE | Sag | 500 | 0.008 and 10 | 45 | 3 | 16 to 20 | 455 × 512 |
| ME SE T2 | Sag | 2000 | 10 to 80, 8 echoes | 90 | 3 | 16 to 20 | 320 × 256 |
UTE=ultrashort echo time; ME SE T2=multi-echo spin echo T2; TR=repetition time, TE=echo time; FOV=field of view
MR Processing and Evaluation
Using UTE technique, echo subtraction imaging was performed: from the 1st echo image acquired at the shortest TE (Figure 1A), 2nd echo image (Figure 1B) was subtracted digitally to create an image that accentuates short T2 signal from the CEP (Figure 1C, arrows) facilitating evaluation. In Figure 1C, a normal CEP is seen, distinct from the adjacent NP (Figure 1C, square) and vertebral endplate. In conventional spin echo images (Figure 1DE), the CEP and the vertebral endplate are both seen with low signal intensity and difficult to distinguish.
Figure 1.
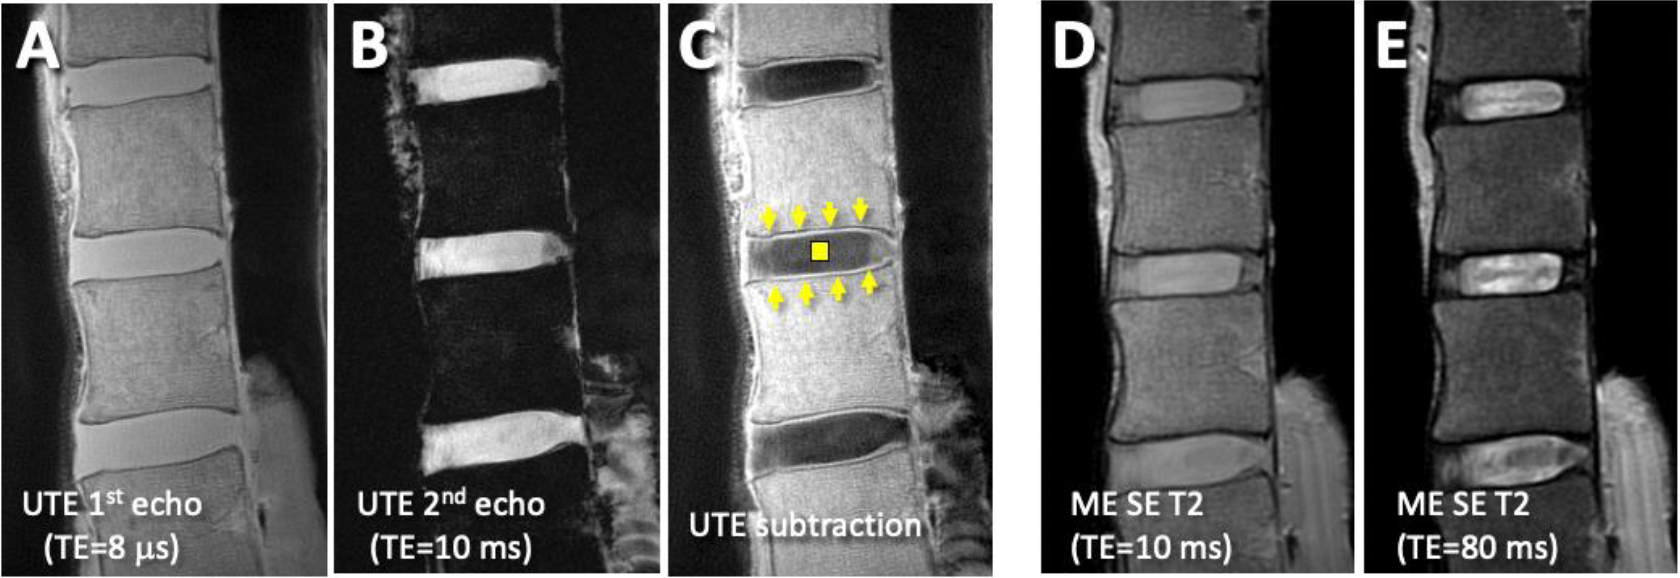
Sagittal MR images of a cadaveric lumbar spine with relatively normal cartilage endplate (CEP) and discs. (A) Ultrashort echo time (UTE) 1st echo and (B) 2nd echo images were digitally-subtracted to obtain (C) UTE subtraction image. The subtraction image (C) shows normal CEP (arrows) as continuous, linear and high signal intensity adjacent to hypointense vertebral endplates and nucleus pulposus (square). In the corresponding (D) Proton density-weighted (obtained with multi-echo spin echo T2, ME SE T2, at echo time, TE, of 10 ms) and (E) T2-weighted (obtained with ME SE T2 sequence at TE of 80 ms) MR images, the region of CEP is difficult to distinguish from adjacent tissues.
CEP morphology on UTE MRI was classified as being “normal” (distinct, continuous, linear, and high signal intensity; Figure 2A, arrows), or “abnormal” with focal signal loss (Figure 2A, arrowhead) or broad irregularity (Figure 2A, curved arrow). While this is a radiologic classification, we have shown previously that the “normal” CEP appearance on UTE MRI corresponds with an intact CEP on histology [17]. CEP morphology was determined at the 8 endplate levels, i.e., L1 inferior, L2 superior, …, to L5 superior.
Figure 2.

CEP morphology was evaluated on UTE echo subtraction images (A). This image shows both normal CEP morphology (arrows) as well as focal areas of abnormal morphology, including focal signal loss (arrowhead) and irregularity (curved arrow). Disc grading using Pfirrmann classification was performed using spin echo T2 weighted images (B). Color map of T2 values of the discs was performed using post-processing with Matlab (C).
On T2-weighted images (Figure 2B), Pfirrmann grading was performed [13] to classify discs from normal (Grade 1) to end-stage degeneration (Grade 5). Mono-exponential T2 relaxation mapping suggests regions of the IVD with focal degeneration (Figure 2C), characterized by a lowered T2 value within the NP, loss of border between NP and AF (which may manifest as increased T2 in the AF). After mapping, regions of NP and AF were selected using an atlas-based registration and segmentation (Figure 2C, red-lined regions) described previously [18], where the outline of an atlas of grade 1 disc is registered with the target IVD. This method was used since many of our specimens had advanced disc degeneration with poor distinction between the regions of NP vs. AF. Mean T2 values within NP and AF regions were determined. Grade and T2 values of the discs were determined at four lumbar disc levels, i.e., L1–2, L2–3, L3–4, and L4–5.
A total of 547 CEPs and 284 discs were analyzed. A few (21 CEPs) were not graded due to insufficient image quality.
Statistics
Descriptive statistics were performed. Table 2A shows the distribution of abnormal CEPs, stratified by CEP level and age groups. Similarly, Table 3 shows the (A) mean and standard error of the mean, and (B) counts for the disc grades, stratified by disc level and age groups. Finally, Table 4 shows the mean and standard error of the mean of the T2 values of the (A) NP and (B) AF, and (C) counts, stratified by disc level and age groups.
Table 2.
CEP morphology. (A) Number of abnormal CEPs by donor age group and CEP level. (B) Results of logistic regression model with a bootstrap extension. L5, superior side, and male were the reference factors.
| A. Number of abnormal CEPs. | |||||||||||
|---|---|---|---|---|---|---|---|---|---|---|---|
| CEP Level | |||||||||||
| Age | L1i | L2i | L2s | L3i | L3s | L4i | L4s | L5s | Abn. | Total | %Abn. |
|
| |||||||||||
| <40 | 2 | 0 | 0 | 0 | 0 | 0 | 1 | 1 | 4 | 32 | 13% |
| 40–49 | 1 | 1 | 0 | 0 | 0 | 2 | 2 | 0 | 6 | 31 | 19% |
| 50–59 | 12 | 8 | 9 | 5 | 10 | 12 | 13 | 15 | 84 | 231 | 36% |
| 60–69 | 7 | 5 | 7 | 5 | 7 | 5 | 10 | 13 | 59 | 185 | 32% |
| 70+ | 4 | 1 | 2 | 4 | 2 | 4 | 4 | 7 | 28 | 68 | 41% |
|
| |||||||||||
| Abn. | 26 | 15 | 18 | 14 | 19 | 23 | 30 | 36 | 181 | ||
| Total | 66 | 71 | 67 | 71 | 71 | 68 | 71 | 62 | 547 | ||
|
| |||||||||||
| % Abn. | 39% | 21% | 27% | 20% | 27% | 34% | 42% | 58% | 33% | ||
| B. Logistic regression: CEP as a function of CEP level, side, age, and sex | ||||
|---|---|---|---|---|
| Factors | Estimate | CI Lower | CI Upper | P-Value |
| Intercept | −1.789 | −3.641 | 0.406 | 0.090 |
| Level_L1 | −0.339 | −1.007 | 0.464 | 0.450 |
| Level_L2 | −1.278 | −1.943 | −0.456 | 0.001 |
| Level_L3 | −1.329 | −1.952 | −0.584 | 0.001 |
| Level_L4 | −0.615 | −1.145 | 0.036 | 0.070 |
| (Ref. L5) | ||||
| Inf vs. (Ref. Sup) | 0.375 | −0.112 | 0.794 | 0.120 |
| Age | 0.029 | −0.005 | 0.058 | 0.080 |
| Sex (M) | 0.040 | −0.689 | 0.775 | 0.920 |
Table 3.
Disc grade by donor age group and disc level. (A) mean and standard error of the mean, and (B) counts. (C) Results of random effects linear regression model.
| A. Mean ± Standard Error of T2 value of the NP | |||||
|---|---|---|---|---|---|
| Age | L1–2 | L2–3 | L3–4 | L4–5 | Total |
|
| |||||
| <40 | 2.25 ± 0.25 | 1.75 ± 0.25 | 1.75 ± 0.48 | 2.25 ± 0.25 | 2.00 ± 0.16 |
| 40–49 | 2.75 ± 0.25 | 2.00 ± 0.00 | 2.25 ± 0.48 | 2.25 ± 0.25 | 2.31 ± 0.15 |
| 50–59 | 3.00 ± 0.14 | 2.80 ± 0.15 | 2.63 ± 0.13 | 3.00 ± 0.12 | 2.86 ± 0.07 |
| 60–69 | 2.92 ± 0.19 | 2.71 ± 0.19 | 2.75 ± 0.14 | 3.21 ± 0.16 | 2.90 ± 0.09 |
| 70+ | 3.00 ± 0.24 | 3.00 ± 0.00 | 3.00 ± 0.29 | 3.22 ± 0.15 | 3.06 ± 0.10 |
|
| |||||
| all ages | 2.92 ± 0.10 | 2.69 ± 0.10 | 2.65 ± 0.09 | 3.01 ± 0.08 | 2.82 ± 0.05 |
| B. Counts | |||||
|---|---|---|---|---|---|
| Age | L1–2 | L2–3 | L3–4 | L4–5 | Total |
|
| |||||
| <40 | 4 | 4 | 4 | 4 | 16 |
| 40–49 | 4 | 4 | 4 | 4 | 16 |
| 50–59 | 30 | 30 | 30 | 30 | 120 |
| 60–69 | 24 | 24 | 24 | 24 | 96 |
| 70+ | 9 | 9 | 9 | 9 | 36 |
|
| |||||
| All Ages | 71 | 71 | 71 | 71 | 284 |
| C. Linear regression: Disc grade as function of disc level, age, and sex. | |||||
|---|---|---|---|---|---|
| Factors | Value | Std. Error | DF | t-value | p-value |
| Intercept | 1.711 | 0.385 | 210 | 4.442 | <0.001 |
| L1–2 | −0.099 | 0.103 | 210 | −0.958 | 0.339 |
| L2–3 | −0.324 | 0.103 | 210 | −3.149 | 0.002 |
| L3–4 | −0.366 | 0.103 | 210 | −3.560 | <0.001 |
| (Ref. L4–5) | |||||
| Age | 0.024 | 0.006 | 68 | 3.669 | <0.001 |
| Sex (M) | −0.095 | 0.154 | 68 | −0.616 | 0.540 |
Table 4.
T2 values of the NP and the AF by donor age group and disc level. The mean and standard error of the mean at the (A) NP and (B) AF, and (C) counts. Results of random effects linear regression models for (D) NP and (E) AF.
| A. Mean ± Standard Error of T2 value of the NP | |||||
|---|---|---|---|---|---|
| Age | L1–2 | L2–3 | L3–4 | L4–5 | Total |
|
| |||||
| <40 | 124.1 ± 7.3 | 110.7 ± 7.6 | 93.8 ± 19.2 | 97.5 ± 21.5 | 106.6 ± 7.5 |
| 40–49 | 91.1 ± 13.8 | 89.9 ± 6.5 | 80.3 ± 13.4 | 91.7 ± 13.1 | 88.2 ± 5.5 |
| 50–59 | 80.0 ± 4.1 | 70.1 ± 2.8 | 67.1 ± 2.9 | 71.8 ± 3.1 | 72.3 ± 1.7 |
| 60–69 | 73.5 ± 4.5 | 67.7 ± 4.4 | 62.8 ± 2.8 | 62.6 ± 2.4 | 66.7 ± 1.9 |
| 70+ | 69.2 ± 7.4 | 56.6 ± 3.3 | 59.7 ± 4.7 | 59.0 ± 4.1 | 61.1 ± 2.6 |
|
| |||||
| all ages | 79.6 ± 2.9 | 71.0 ± 2.4 | 67.0 ± 2.2 | 69.7 ± 2.4 | 71.8 ± 1.3 |
| B. Mean ± Standard Error of T2 value of the AF | |||||
|---|---|---|---|---|---|
| Age | L1–2 | L2–3 | L3–4 | L4–5 | Total |
|
| |||||
| <40 | 42.0 ± 3.4 | 34.9 ± 1.3 | 32.0 ± 0.9 | 33.3 ± 1.3 | 35.6 ± 1.3 |
| 40–49 | 38.3 ± 4.4 | 37.8 ± 2.8 | 35.3 ± 1.3 | 36.9 ± 1.4 | 37.1 ± 1.3 |
| 50–59 | 39.7 ± 1.2 | 37.3 ± 0.9 | 36.2 ± 0.7 | 40.3 ± 1.3 | 38.4 ± 0.5 |
| 60–69 | 38.4 ± 1.4 | 34.8 ± 1.0 | 35.5 ± 1.0 | 36.7 ± 1.0 | 36.3 ± 0.6 |
| 70+ | 43.3 ± 5.8 | 36.2 ± 3.0 | 40.6 ± 4.4 | 44.4 ± 3.7 | 41.1 ± 2.2 |
|
| |||||
| all ages | 39.8 ± 1.0 | 36.2 ± 0.6 | 36.2 ± 0.7 | 39.0 ± 0.9 | 37.8 ± 0.4 |
| C. Counts | |||||
|---|---|---|---|---|---|
| Age | L1–2 | L2–3 | L3–4 | L4–5 | Total |
|
| |||||
| <40 | 4 | 4 | 4 | 4 | 16 |
| 40–49 | 4 | 4 | 4 | 4 | 16 |
| 50–59 | 29 | 30 | 30 | 30 | 119 |
| 60–69 | 24 | 24 | 23 | 24 | 95 |
| 70+ | 9 | 9 | 9 | 9 | 36 |
|
| |||||
| all ages | 70 | 71 | 70 | 71 | 282 |
| D. Linear regression: T2 of NP as a function of disc level, age, and sex | |||||
|---|---|---|---|---|---|
| Factors | Value | Std. Error | DF | t-value | p-value |
| Intercept | 126.5 | 9.6 | 209 | 13.2 | <0.001 |
| L1–2 | 9.9 | 2.6 | 209 | 3.8 | <0.001 |
| L2–3 | 1.3 | 2.6 | 209 | 0.5 | 0.609 |
| L3–4 | −2.7 | 2.6 | 209 | −1.1 | 0.292 |
| (Ref. L4–5) | |||||
| Age | −1.0 | 0.2 | 68 | −6.5 | <0.001 |
| Sex (M) | 4.9 | 3.8 | 68 | 1.3 | 0.205 |
| E. Linear regression: T2 of AF as a function of disc level, age, and sex | |||||
|---|---|---|---|---|---|
| Factors | Value | Std. Error | DF | t-value | p-value |
| Intercept | 34.9 | 3.8 | 208 | 9.1 | <0.001 |
| L1–2 | 0.8 | 0.9 | 208 | 0.8 | 0.403 |
| L2–3 | −2.8 | 0.9 | 208 | −3.1 | 0.002 |
| L3–4 | −2.8 | 0.9 | 208 | −3.1 | 0.002 |
| (Ref. L4–5) | |||||
| Age | 0.1 | 0.1 | 68 | 1.4 | 0.171 |
| Sex (M) | −1.4 | 1.5 | 68 | −0.9 | 0.373 |
Following statistical analyses were performed. (1) Effects of donor age, sex and CEP level on CEP morphology (normal or abnormal) was determined using logistic regression, with confidence intervals around the coefficients and their p-values computed through nonparametric bootstrap with per-subject resampling. CEP level was coded as two separate factors of vertebral level (L1 to L4) and the side (superior vs. inferior).
(2) Effects of age, sex, and disc level (L1–2, L2–3, L3–4, and L4–5) on disc grade (grade 1 to 5) was assessed using linear regression fit with a random (subject-specific) intercept to account for within-subject dependence. While the disc grade is an ordinal variable as opposed to continuous, this model was deemed reasonable since the residuals were symmetrically distributed.
(3) Effects of age, sex, and disc level on T2 values (continuous variable) of NP and AF were assess using ANOVA, as was done for disc grade.
(4) Effect of CEP abnormality on disc grade, T2 of NP, and T2 of AF were determined using linear regression fit with a random intercept (similar to the above), but since each disc has two apposing CEPs, we considered the morphology of superior and inferior CEPs separately, along with age and sex of the subject. Additionally, we determined the mean T2 values of the NP and AF grouped by the adjacent CEP morphology (two normal, one abnormal, or two abnormal CEPs), whose effect was determined using ANOVA with Tukey post-hoc test.
(5) Additionally, to visualize the effect of age and CEP morphology on disc grade, we adapted Kaplan-Meier survival analysis, where discs with grade 4 or 5 were defined as “failed” discs, and plotted the “failure” vs. donor age. The graphs were stratified by CEP morphology into 3 groups, i.e., the disc is adjacent to two normal CEPs, one abnormal CEPs, or two abnormal CEPs. The mean survival times between the groups were compared using log rank statistic.
RESULTS
CEP Abnormality with Age and Level.
Table 2A shows the distribution of abnormal CEPs with CEP level and age groups, which together with Figure 3, suggested a broad trend of higher proportion of CEP abnormality in older age groups (Figure 3A) and at L1 and L5 compared to other levels (Figure 3B). Results of logistic regression (Table 2B) corroborated this observation; abnormal CEP was more likely to be found in spines from older donors (age p=0.08), and compared to L5, L2 and L3 were less likely to have abnormal CEP (each p=0.001). Sex was not a significant factor (Sex p=0.92).
Figure 3.
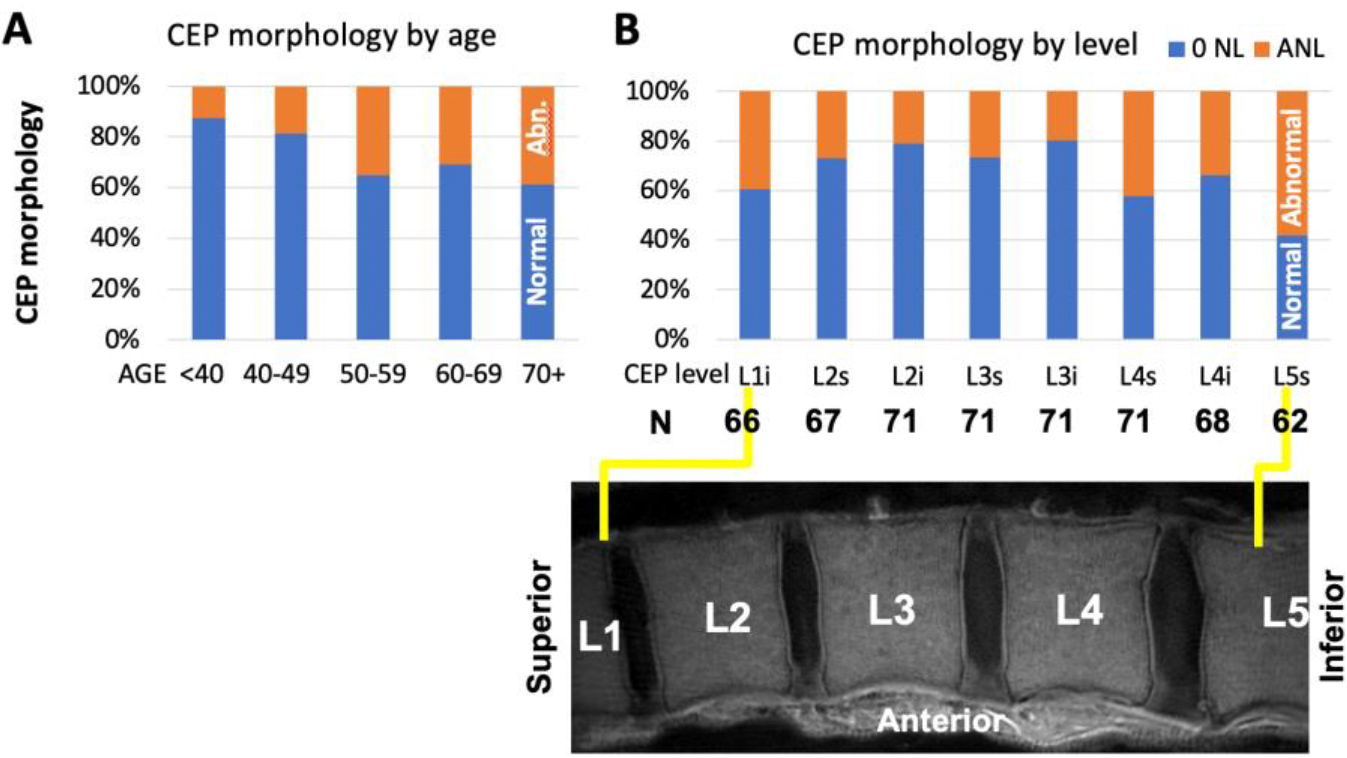
Prevalence of normal and abnormal CEP morphology by (A) age and (B) level.
Disc Degeneration (Pfirrmann Grade and T2 Values) with Age and Level.
Disc grade varied significantly with age and disc level. Table 3AB shows the distribution of mean disc grades across different disc levels and age groups. Linear regression analysis (Table 3C) suggested that the disc grade was greater in older donors (age p<0.001), regardless of sex (sex p=0.54), and higher at L2–3 (p<0.05) and L3–4 (p<0.001) levels compared to L4–5. L1–2 was not significantly different than L4–5 (p=0.34). Sex was not a significant contributor (p=0.54).
T2 values of the NP also varied significantly with age and disc level. Table 3A to C shows the distribution of mean T2 values in NP and AF across different disc levels and age groups. Linear regression analysis (Table 4D) suggested significantly lower T2 values of the NP with age (age p<0.0001), and significantly higher T2 values of the NP at L1–2 compared to L4–5 (p<0.001). Other levels did not show different T2 values compared to L4–5 (each p>0.29).
T2 values of the AF varied significantly with level but not with age or sex. Linear regression analysis (Table 4E) suggested that, compared to L4–5, both L2–3 and L3–4 had significantly lower T2 values of the AF (each p<0.01). L12 was not different from L4–5 (p=0.4).
Association between CEP Morphology and Disc Degeneration
Disc grade was significantly affected by both CEP morphology and age. Linear regression analysis (Table 5A) suggested that both abnormal CEP morphology on the superior (p<0.0001) and inferior (p<0.01) sides, along with higher age (p<0.01) contributed to higher disc grade. Sex was not significantly associated (p=0.55).
Table 5.
Results of random effects linear regression model: (A) Disc grade, (B) T2 of NP, and (C) T2 of AF as a function of cartilage endplate abnormality in the superior (CEP_Abn_Inf) sides, age, and sex.
| A. | Factors | Value | Std. Error | DF | t-value | p-value |
|---|---|---|---|---|---|---|
| Intercept | 1.53 | 0.32 | 198 | 4.8 | <0.001 | |
| CEP_Abn_Sup | 0.57 | 0.10 | 198 | 5.8 | <0.001 | |
| CEP_Abn_Inf | 0.29 | 0.09 | 198 | 3.1 | 0.002 | |
| Age | 0.02 | 0.01 | 68 | 3.4 | 0.001 | |
| Sex (M) | −0.08 | 0.13 | 68 | −0.6 | 0.554 |
| B. | Factors | Value | Std. Error | DF | t-value | p-value |
|---|---|---|---|---|---|---|
| Intercept | 129.1 | 9.59 | 197 | 13.5 | <0.001 | |
| CEP_Abn_Sup | −3.29 | 2.63 | 197 | −1.25 | 0.213 | |
| CEP_Abn_Inf | −5.22 | 2.42 | 197 | −2.16 | 0.032 | |
| Age | −1.00 | 0.16 | 68 | −6.13 | <0.001 | |
| Sex (M) | 4.70 | 3.89 | 68 | 1.21 | 0.231 |
| C. | Factors | Value | Std. Error | DF | t-value | p-value |
|---|---|---|---|---|---|---|
| Intercept | 33.9 | 3.89 | 196 | 8.71 | <0.001 | |
| CEP_Abn_Sup | 0.54 | 0.94 | 196 | 0.57 | 0.568 | |
| CEP_Abn_Inf | 0.57 | 0.86 | 196 | 0.66 | 0.511 | |
| Age | 0.08 | 0.07 | 68 | 1.17 | 0.244 | |
| Sex (M) | −1.36 | 1.58 | 68 | −0.86 | 0.391 |
Kaplan-Meier analysis (Figure 4) demonstrated clear differences between three groups of discs adjacent to varying CEP morphology. Discs with two normal CEPs had the highest probability of “survival” (disc grade less than 4) at all ages, with the mean survival time of 72.7 years. Discs with one or two abnormal CEPs had the mean survival times of 70.3 or 67.7 years, respectively. CEP morphology had a significant effect (Log-Rank test p<0.00001) on this outcome.
Figure 4.

Kaplan-Meier analysis. We defined a disc with grade of 4 or 5 as a “failed disc”, and stratified survival curves by the CEP morphology adjacent to each disc (0=all normal, 1=1 abnormal CEP, 2=2 abnormal CEP). There distinct curves were seen, suggesting a negative effect of abnormal CEP on disc degeneration.
T2 value of the NP was significantly affected by both CEP morphology and age. Linear regression analysis (Table 5B) suggested that the presence of abnormal CEP on the inferior side (p<0.05) and higher age (p<0.001) contributed significantly to increased T2 value of the NP, while other factors did not. In contrast, T2 value of the AF (Table 5C) was not significantly affected by CEP morphology, age, or sex (each p>0.24).
When averaged solely by CEP morphology (Figure 5A), T2 values of the NP in the discs with normal CEPs was 76.3 ± 22.1 ms (mean ± standard deviation). This was significantly higher than those adjacent to 1 abnormal CEP (68.4 ± 18.5 ms; p<0.05) or 2 abnormal CEPs (64.3 ± 22.2 ms; p<0.01). T2 values of AF (Figure 5B) was roughly ~40 ms, with a slightly but significantly higher values seen in discs with 2 abnormal CEPs compared to the normal CEPs (p<0.05).
Figure 5.

Mean and standard deviation T2 values of the (A) NP and (B) AF in discs with 0, 1, or 2 abnormal CEPs.
DISCUSSION
This cross-sectional study provides an insight into prevalence of CEP abnormality (Table 2A) as revealed by UTE MRI. The proportion of abnormal CEPs grew from 13% in spines from <40 year old donors, to 41% in donors aged 70 or higher (Table 4B). This increase with aging may not be surprising and appears consistent with generally increased degeneration of the lumbar spine and discs with aging [8]. Level-wise distribution of abnormal CEP (i.e., lower at middle lumbar levels) is somewhat similar to the patterns found in disc degeneration, where the lower-level (L4–5, L5-S1) generally exhibited greater degeneration regardless of age, as shown in Table 3 and in other past studies [8]. These results are also consistent with a past study in nine subjects [16] that found abnormal CEPs more frequently at L1–2 and L4–5.
Our results on disc degeneration, and its variations with aging and level, are in close agreement and reconfirms past studies. Siemionow et al. investigated over 1700 discs and reported a monotonic increase in disc grade (i.e., worsening) from 2.1 to 3.2 as donor age group increased from 30s to 70+ [8], which is in close agreement with disc grades ranging increasing from 2.0 to 3.1 in our study. Additionally, in our study the T2 values of the NP decreased with age (Table 4A), also consistent with past reports [19]. Level-wise variation in our study was also in agreement with past studies showing greater degeneration in inferior levels compared to superior levels.[8]
Significant association between CEP abnormality and disc degeneration, while cannot show causality, supports the involvement of CEP as a possible cause of disc degeneration. Relationship between the diminished nutrient transport via CEP and disc degeneration has been suggested in the past [20]. In animals, blockage of endplate from the vascular supply using a titanium foil resulted in reduced of nitrous oxide transport into the disc [21]. In scoliosis, thickening of vertebral endplate and increased calcification in the CEP leads to smaller opening of vascular canals and reduces transport via CEP [22]. These may result in build-up of metabolites and an acidic environment, as found in degenerated discs [23]. The idea of abnormal CEP as a possible precursor to disc degeneration is supported by the Kaplan-Meier survival analysis (Figure 4). Here, while not all degenerated discs were adjacent to abnormal CEPs, those that were degenerated more rapidly over time.
The nature of CEP abnormality warrants additional studies. Abnormal thinning and absence of the signal intensity of the CEP maybe related to progressive resorption with replacement by subchondral bone, noted during aging [24]. Dense calcification is another possibility for focal signal loss [25], as these would appear with low signal intensity even on UTE images. Irregularity including heterogenous thickening of the CEP signal intensity appears similar to the hypertrophy of the articular cartilage in early knee osteoarthrosis [26].
There are several shortcomings of this study. Cross-sectional nature limits the interpretation, as causal relation cannot be determined. The number of donors, while sufficiently large in ages between 50 to 69, were quite small in ages <50. The use of a knee coil to perform MRI, while affording a high signal and good image quality, was dissimilar to routine conditions where a posterior spine array would be used. Our study had a single reader; however, we have established a substantial inter-reader agreement for UTE MR assessment of CEP [12]. While it would have been ideal to corroborate MR findings against histology, the specimens were not available beyond imaging at the time of the study.
In conclusion, we provide detailed prevalence of abnormal CEPs in cadaveric human lumbar spines with aging and level, and found significant association between abnormal CEP and disc degeneration. Future studies to determine sequelae of changes in the CEP and discs in human subjects, as well as comparison of CEP abnormality to reference measures of tissue structure and function, may provide an insight into the pathoetiology of disc degeneration.
ACKNOWLEDMENTS
GRANT SUPPORT
This article was made possible in part by research grants from the National Institute of Arthritis and Musculoskeletal and Skin Diseases of the National Institutes of Health (R01 AR066622 and P30 AR073761) and from General Electric Healthcare in support of Dr. Won Bae. Dr. Tim Finkenstaedt was supported by grant funding from RSNA Research Fellow Grant (RF1730), Swiss National Science Foundation (P2SKP3_168412) and Swiss Society of Radiology. The contents of this paper are solely the responsibility of the authors and do not necessarily represent the official views of the sponsoring institutions.
Footnotes
IRB STATEMENT
This cadaveric study was exempted from IRB approval.
REFERENCES
- 1.Freburger JK, Holmes GM, Agans RP, Jackman AM, Darter JD, Wallace AS, Castel LD, Kalsbeek WD, Carey TS (2009) The rising prevalence of chronic low back pain. Archives of internal medicine 169:251–258. DOI 10.1001/archinternmed.2008.543 [DOI] [PMC free article] [PubMed] [Google Scholar]
- 2.An HS, Anderson PA, Haughton VM, Iatridis JC, Kang JD, Lotz JC, Natarajan RN, Oegema TR Jr., Roughley P, Setton LA, Urban JP, Videman T, Andersson GB, Weinstein JN (2004) Introduction: disc degeneration: summary. Spine 29:2677–2678 [DOI] [PubMed] [Google Scholar]
- 3.Moneta GB, Videman T, Kaivanto K, Aprill C, Spivey M, Vanharanta H, Sachs BL, Guyer RD, Hochschuler SH, Raschbaum RF, et al. (1994) Reported pain during lumbar discography as a function of anular ruptures and disc degeneration. A re-analysis of 833 discograms. Spine (Phila Pa 1976) 19:1968–1974 [DOI] [PubMed] [Google Scholar]
- 4.Abu-Ghanem S, Ohana N, Abu-Ghanem Y, Kittani M, Shelef I (2013) Acute schmorl node in dorsal spine: an unusual cause of a sudden onset of severe back pain in a young female. Asian spine journal 7:131–135. DOI 10.4184/asj.2013.7.2.131 [DOI] [PMC free article] [PubMed] [Google Scholar]
- 5.Bogduk N, Endres SM (2005) Clinical anatomy of the lumbar spine and sacrum. Clinical anatomy of the lumbar spine and sacrum. 4th Ed. Elsevier/Churchill Livingstone. New York. [Google Scholar]
- 6.Crock HV, Goldwasser M (1984) Anatomic studies of the circulation in the region of the vertebral end-plate in adult Greyhound dogs. Spine 9:702–706. DOI 10.1097/00007632-198410000-00009 [DOI] [PubMed] [Google Scholar]
- 7.Urban JP, Holm S, Maroudas A (1978) Diffusion of small solutes into the intervertebral disc: as in vivo study. Biorheology 15:203–221. DOI 10.3233/bir-1978-153-409 [DOI] [PubMed] [Google Scholar]
- 8.Siemionow K, An H, Masuda K, Andersson G, Cs-Szabo G (2011) The effects of age, sex, ethnicity, and spinal level on the rate of intervertebral disc degeneration: a review of 1712 intervertebral discs. Spine 36:1333–1339. DOI 10.1097/BRS.0b013e3181f2a177 [DOI] [PMC free article] [PubMed] [Google Scholar]
- 9.Joe E, Lee JW, Park KW, Yeom JS, Lee E, Lee GY, Kang HS (2015) Herniation of cartilaginous endplates in the lumbar spine: MRI findings. AJR American journal of roentgenology 204:1075–1081. DOI 10.2214/AJR.14.13319 [DOI] [PubMed] [Google Scholar]
- 10.Robson MD, Gatehouse PD, Bydder M, Bydder GM (2003) Magnetic resonance: an introduction to ultrashort TE (UTE) imaging. J Comput Assist Tomogr 27:825–846. DOI 10.1097/00004728-200311000-00001 [DOI] [PubMed] [Google Scholar]
- 11.Bae WC, Biswas R, Chen K, Chang EY, Chung CB (2014) UTE MRI of the Osteochondral Junction. Curr Radiol Rep 2:35. DOI 10.1007/s40134-013-0035-7 [DOI] [PMC free article] [PubMed] [Google Scholar]
- 12.Chen KC, Tran B, Biswas R, Statum S, Masuda K, Chung CB, Bae WC (2016) Evaluation of the disco-vertebral junction using ultrashort time-to-echo magnetic resonance imaging: inter-reader agreement and association with vertebral endplate lesions. Skeletal Radiol 45:1249–1256. DOI 10.1007/s00256-016-2413-8 [DOI] [PMC free article] [PubMed] [Google Scholar]
- 13.Pfirrmann CW, Metzdorf A, Zanetti M, Hodler J, Boos N (2001) Magnetic resonance classification of lumbar intervertebral disc degeneration. Spine 26:1873–1878 [DOI] [PubMed] [Google Scholar]
- 14.Marinelli NL, Haughton VM, Munoz A, Anderson PA (2009) T2 relaxation times of intervertebral disc tissue correlated with water content and proteoglycan content. Spine (Phila Pa 1976) 34:520–524. DOI 10.1097/BRS.0b013e318195dd4400007632-200903010-00016 [pii] [DOI] [PubMed] [Google Scholar]
- 15.Berg-Johansen B, Han M, Fields AJ, Liebenberg EC, Lim BJ, Larson PE, Gunduz-Demir C, Kazakia GJ, Krug R, Lotz JC (2018) Cartilage Endplate Thickness Variation Measured by Ultrashort Echo-Time MRI Is Associated With Adjacent Disc Degeneration. Spine 43:E592–E600. DOI 10.1097/BRS.0000000000002432 [DOI] [PMC free article] [PubMed] [Google Scholar]
- 16.Law T, Anthony MP, Chan Q, Samartzis D, Kim M, Cheung KM, Khong PL (2013) Ultrashort time-to-echo MRI of the cartilaginous endplate: technique and association with intervertebral disc degeneration. Journal of medical imaging and radiation oncology 57:427–434. DOI 10.1111/1754-9485.12041 [DOI] [PubMed] [Google Scholar]
- 17.Bae WC, Statum S, Zhang Z, Yamaguchi T, Wolfson T, Gamst AC, Du J, Bydder GM, Masuda K, Chung CB (2013) Morphology of the cartilaginous endplates in human intervertebral disks with ultrashort echo time MR imaging. Radiology 266:564–574. DOI 10.1148/radiol.12121181 [DOI] [PMC free article] [PubMed] [Google Scholar]
- 18.Obata S, Akeda K, Imanishi T, Masuda K, Bae W, Morimoto R, Asanuma Y, Kasai Y, Uchida A, Sudo A (2012) Effect of autologous platelet-rich plasma-releasate on intervertebral disc degeneration in the rabbit anular puncture model: a preclinical study. Arthritis Res Ther 14:R241. DOI 10.1186/ar4084 [DOI] [PMC free article] [PubMed] [Google Scholar]
- 19.Marinelli NL, Haughton VM, Anderson PA (2010) T2 relaxation times correlated with stage of lumbar intervertebral disk degeneration and patient age. AJNR Am J Neuroradiol 31:1278–1282. DOI 10.3174/ajnr.A2080 [DOI] [PMC free article] [PubMed] [Google Scholar]
- 20.Roberts S, Menage J, Urban JP (1989) Biochemical and structural properties of the cartilage end-plate and its relation to the intervertebral disc. Spine (Phila Pa 1976) 14:166–174 [DOI] [PubMed] [Google Scholar]
- 21.van der Werf M, Lezuo P, Maissen O, van Donkelaar CC, Ito K (2007) Inhibition of vertebral endplate perfusion results in decreased intervertebral disc intranuclear diffusive transport. J Anat 211:769–774. DOI JOA816 [pii] 10.1111/j.1469-7580.2007.00816.x [DOI] [PMC free article] [PubMed] [Google Scholar]
- 22.Urban MR, Fairbank JC, Etherington PJ, Loh FL, Winlove CP, Urban JP (2001) Electrochemical measurement of transport into scoliotic intervertebral discs in vivo using nitrous oxide as a tracer. Spine 26:984–990 [DOI] [PubMed] [Google Scholar]
- 23.Kitano T, Zerwekh JE, Usui Y, Edwards ML, Flicker PL, Mooney V (1993) Biochemical changes associated with the symptomatic human intervertebral disk. Clin Orthop Relat Res:372–377 [PubMed] [Google Scholar]
- 24.Bernick S, Cailliet R (1982) Vertebral end-plate changes with aging of human vertebrae. Spine (Phila Pa 1976) 7:97–102 [DOI] [PubMed] [Google Scholar]
- 25.Bae WC, Xu K, Inoue N, Bydder GM, Chung CB, Masuda K (2010) Ultrashort time-to-echo MRI of human intervertebral disc endplate: association with endplate calcification. Proc Int’l Soc Magn Reson Med 18:3218 [Google Scholar]
- 26.Calvo E, Palacios I, Delgado E, Sanchez-Pernaute O, Largo R, Egido J, Herrero-Beaumont G (2004) Histopathological correlation of cartilage swelling detected by magnetic resonance imaging in early experimental osteoarthritis. Osteoarthritis Cartilage 12:878–886. DOI 10.1016/j.joca.2004.07.007 [DOI] [PubMed] [Google Scholar]