Abstract
Background and study aims Diagnostic performance of a computer-aided diagnosis (CAD) system for deep submucosally invasive (T1b) colorectal cancer was excellent, but the “regions of interest” (ROI) within images are not obvious. Class activation mapping (CAM) enables identification of the ROI that CAD utilizes for diagnosis. The purpose of this study was a quantitative investigation of the difference between CAD and endoscopists.
Patients and methods Endoscopic images collected for validation of a previous study were used, including histologically proven T1b colorectal cancers (n = 82; morphology: flat 36, polypoid 46; median maximum diameter 20 mm, interquartile range 15–25 mm; histological subtype: papillary 5, well 51, moderate 24, poor 2; location: proximal colon 26, distal colon 27, rectum 29). Application of CAM was limited to one white light endoscopic image (per lesion) to demonstrate findings of T1b cancers. The CAM images were generated from the weights of the previously fine-tuned ResNet50. Two expert endoscopists depicted the ROI in identical images. Concordance of the ROI was rated by intersection over union (IoU) analysis.
Results Pixel counts of ROIs were significantly lower using 165K[x103] [108K-227K] than by endoscopists (300K [208K-440K]; P < 0.0001) and median [interquartile] of the IoU was 0.198 [0.024-0.349]. IoU was significantly higher in correctly identified lesions (n = 54, 0.213 [0.116-0.364]) than incorrect ones (n=28, 0.070 [0.000-0.2750, P = 0.033).
Concusions IoU was larger in correctly diagnosed T1b colorectal cancers. Optimal annotation of the ROI may be the key to improving diagnostic sensitivity of CAD for T1b colorectal cancers.
Keywords: Endoscopy Lower GI Tract; Colorectal cancer; Diagnosis and imaging (inc chromoendoscopy, NBI, iSCAN, FICE, CLE...)
Introduction
Colorectal cancers (CRCs) limited to the mucosa (Tis) and CRCs with superficial submucosal invasion (T1a) without unfavorable histology do not carry any risk of metastases 1 2 3 , whereas CRCs with deep (≥ 1 mm) submucosal invasion (T1b) possess the possibility of metastases. Therefore, it is imperative to discriminate T1b stage CRCs from less invasive ones through diagnostic modality. However, endoscopic images of T1b stage CRC resemble those of Tis/T1a stage CRC 4 5 . So far, no diagnostic modality has ever achieved nearly 100% accuracy in this identification 6 7 8 9 10 . Recent artificial intelligence (AI) technology may be a game-changer to address this situation 11 12 13 14 . Indeed, a computer-aided diagnosis (CAD) system developed by our research group has achieved diagnostic accuracy similar to that of super-experts 15 .
Nevertheless, the regions of interest (ROI) identified by the CAD system within images are unclear. The process through which the CAD system learns remains somewhat of a black box, which has presented challenges in improving accuracy. With the recent emergence of class activation mapping (CAM) developed by Zhou 16 , we can now pinpoint ROIs within the image that the CAD system uses for diagnosis. During the image recognition process, CAM highlights the parts of an image used for diagnosis, which are color-coded based on their importance. In simpler terms, CAM allows us to understand what the CAD system is focusing on when making a diagnosis. Originally, CAM was developed to aid AI in learning more efficiently. Furthermore, by comprehending the ROI of the CAD system, we initially expect that the diagnostic capabilities of endoscopists could also be enhanced. To the best of our knowledge, there have been no reports quantitatively analyzing ROIs using CAM. In this study, the primary objective was to quantitatively investigate the differences and similarities between CAD and expert endoscopists, using intersection over union (IoU), which is also called the Jaccard index and is used to evaluate similarity and diversity of sample sets 17 . The secondary objective was to elucidate characteristics of the ROIs utilized by the CAD system. Finally, we expect this research process can improve diagnostic capability of the CAD system.
Patients and methods
Study flow
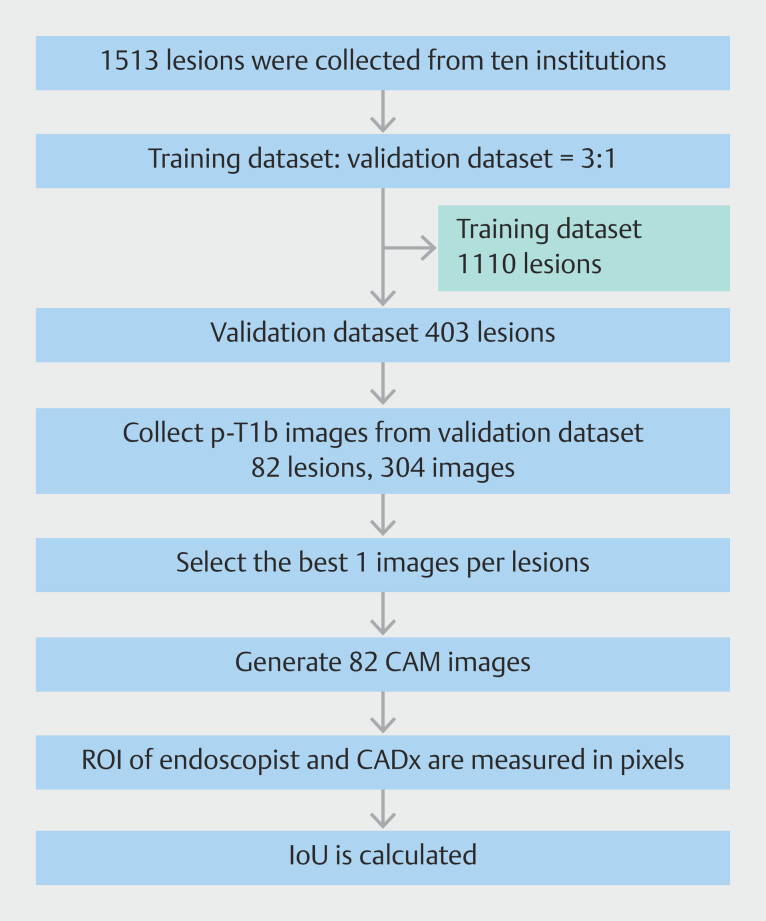
This study employed images utilized in a previous investigation to construct the CAD system for diagnosis of T1b CRCs. (Clinical trial registration number: UMIN000037053) 7 . The validation dataset alone from the previous study was utilized because the training dataset was used for development of the CAD by annotating ROIs of the images if necessary. In other words, during the fine-tuning process using the training dataset, we partially utilized the ROIs generated by the endoscopists ( Fig. 1 ). The validation dataset comprised 82 lesions of T1b CRCs developing in 82 patients, after excluding images with low resolution, lesions > 5 cm, and pedunculated lesions. Background characteristics of patients and lesions are shown in Table 1 . Among 304 endoscopic images collected from 82 CRCs, the best image capable of diagnosing T1b cancer was selected for each lesion and utilized for creation of CAM images.
Fig. 1.
Study flow. CAM, class activation mapping; CAD, computer-aided diagnosis; ROI, region of interest; IoU, intersection over union.
Table 1 Background characteristics of patients and lesions.
| IQR, interquartile range; pap, papillary; tub1, well differentiated; tub2 moderately differentiated; por, poorly differentiated. Proximal colon: From cecum to transverse colon. Distal colon: Descending colon and sigmoid colon. Morphology is defined according to Paris classification. Polypoid includes 0-Is whereas flat includes 0-IIa, 0-IIa+IIc and 0-IIc. | ||
| Patients, n | 82 | |
|
56 (68.3) | |
|
69.5 [64–77] | |
| Lesions, n | 82 | |
|
20 [15–25] | |
|
Proximal colon | 26 (31.7) |
| Distal colon | 27 (32.9) | |
| Rectum | 29 (35.4) | |
|
Polypoid | 46 (56.1) |
| Flat | 36 (43.9) | |
|
Pap | 5 (6.1) |
| Tub1 | 51 (62.2) | |
| Tub2 | 24 (29.3) | |
| Por | 2 (2.4) | |
Generating CAM images
We applied a gradient-weighted CAM (Grad-CAM) 18 technique to create CAM images. Grad-CAM is a generalization of heat map calculation based on CAM, aiming to avoid constraints based on the type of model used. Grad-CAM generates a heat map that visually illustrates which parts of the image had the most impact on the prediction. The areas of high importance are depicted in red, while lower importance regions appear in blue.
Region of interest
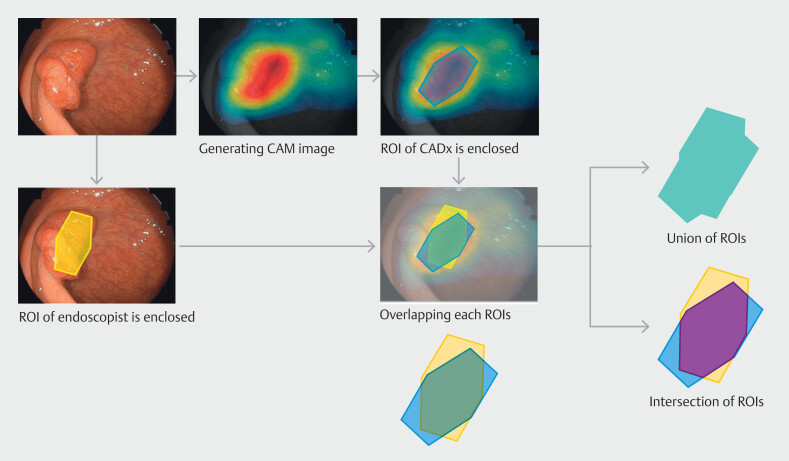
The setting of the ROI for endoscopists was conducted through a consensus decision-making process by two expert colonoscopists (D.N. and Y.N.). The ROI of endoscopists was defined as the region where T1b cancer could be diagnosed. Areas that could be diagnosed as T1b cancer comprise typical observations that endoscopists focus on when diagnosing deep submucosal invasion, such as redness, easy bleeding, expanding appearance, convergency or constriction of folds, and inadequate progression of lesions 4 5 . The ROI of CAD was defined as only the red regions within CAM images. Based on ROIs of endoscopists and CAD, we measured the number of pixels for each ROI, and then calculated intersection, union of ROI, and the IoU. Intersection represents an overlapping area of ROIs of the endoscopist and CAD, and union represents a whole area. Detailed methods are illustrated in Fig. 2 .
Fig. 2.
ROI, Union of ROI and Intersection of ROI, and IoU. ROI, region of interest; IoU, intersection over union.
Outcome measurement
We conducted an exploratory investigation into the association between lesions and IoU. The primary outcome was the IoU between correctly and incorrectly identified lesions (ROIs). Diagnoses by CAD generated in previous studies with a confidence level of 0.5 or higher were defined as correct. Secondary outcomes included IoU based on lesion morphology (flat vs. polypoid), maximum size (< 2 cm vs ≥ 2 cm), location (proximal colon vs. distal colon/rectum), and histological subtype (papillary/well-differentiated adenocarcinoma vs. moderately/poorly-differentiated adenocarcinoma). This basic information regarding the lesions primarily follows the Japanese classification 1 . In addition, we attempted to provide a descriptive analysis of what the CAD system focuses on when making a diagnosis.
Statistical analysis
Quantitative variables were described by median and interquartile range (IQR). For nominal data, statistical comparisons used the Fischer’s exact test. For continuous data including age and lesion size, the Mann-Whitney U test was applied for group comparison. The comparison of pixel counts of ROI between endoscopists and CAD was conducted using the Wilcoxon signed-rank sum test. All P values are two-tailed, and P < 0.05 indicates statistical significance. All statistical analyses were performed with Stata 17 (Stata Corp., College Station, Texas, United States).
Results
ROI, intersection, union, and IoU
CAM images were generated for all 82 images in the validation dataset. Pixel counts of ROI were a median of 300k (IQR: 208k-440k) in CAD and a median of 168k (IQR 108k-227k) in endoscopist (Supplementary Table 1). Pixel counts of ROIs were significantly higher using CAD than by endoscopists ( P < 0.0001). On calculating the intersection and union from each ROI, median of pixel count of intersection of ROIs was 84k (IQR 15k-124k) and median of pixel count of union of ROIs was 404k (IQR 298k-596k). Consequently, the IoU value was computed as 0.198 (IQR 0.024–0.349).
Analysis of IoU
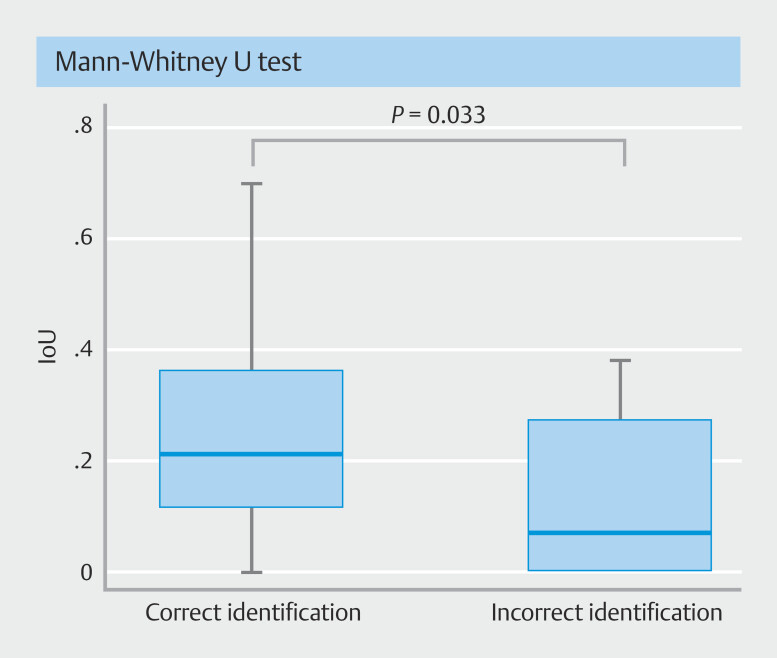
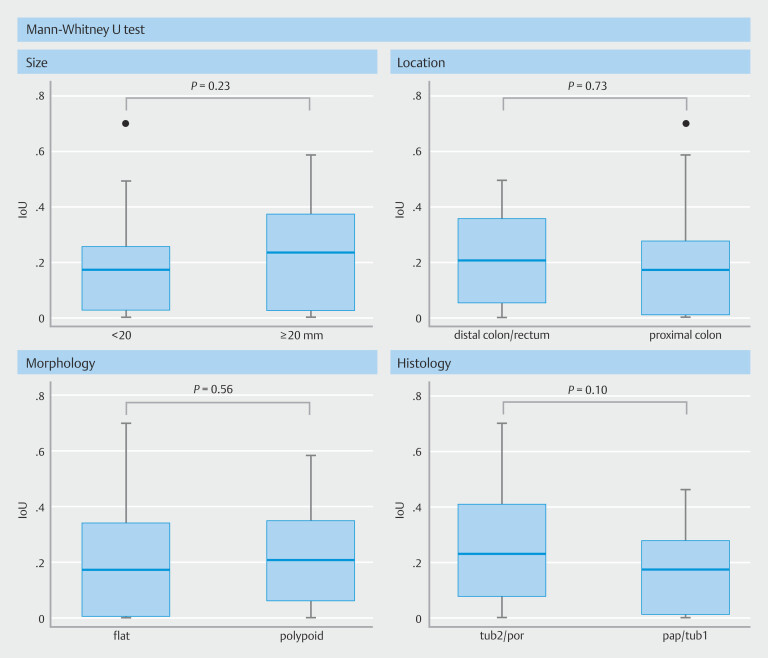
IoU was significantly higher in correctly identified lesions (n = 54; median: 0.213; IQR 0.116–0.364) than incorrect ones (n = 28; median: 0.070; IQR 0.000–0.2750; P = 0.033), as shown in Fig. 3 . Association of IoU with lesion morphology, size, and location did not show a specific trend ( Fig. 4 ). However, IoU trended to be higher for moderately or poorly-differentiated adenocarcinoma, compared with papillary or well-differentiated adenocarcinoma ( P = 0.10).
Fig. 3.
IoU: correct versus incorrect diagnosis. IoU was significantly higher in correctly identified lesions (n = 54) than incorrect ones (n = 28). IoU, intersection over union.
Fig. 4.
IoU by lesion size, location, morphology and subtype of histology. There was no specific trend observed between the IoU and lesion morphology, size, or location. However, IoU trended to be higher for moderately or poorly differentiated adenocarcinomas compared to papillary or well-differentiated adenocarcinomas. IoU, intersection over union.
Case presentation
Case 1 and 2 were correctly diagnosed by the CAD system and Case 3 was incorrectly diagnosed.
Case 1 ( Fig. 5 a ) was a protruding reddish lesion of the sigmoid colon, measuring 15 mm in maximum diameter. The ROI of endoscopists was the irregular elevated area in the center of the lesion, whereas the ROI of the CAD was the irregular area at the top of the lesion. The IoU was > 0.2.
Fig. 5.
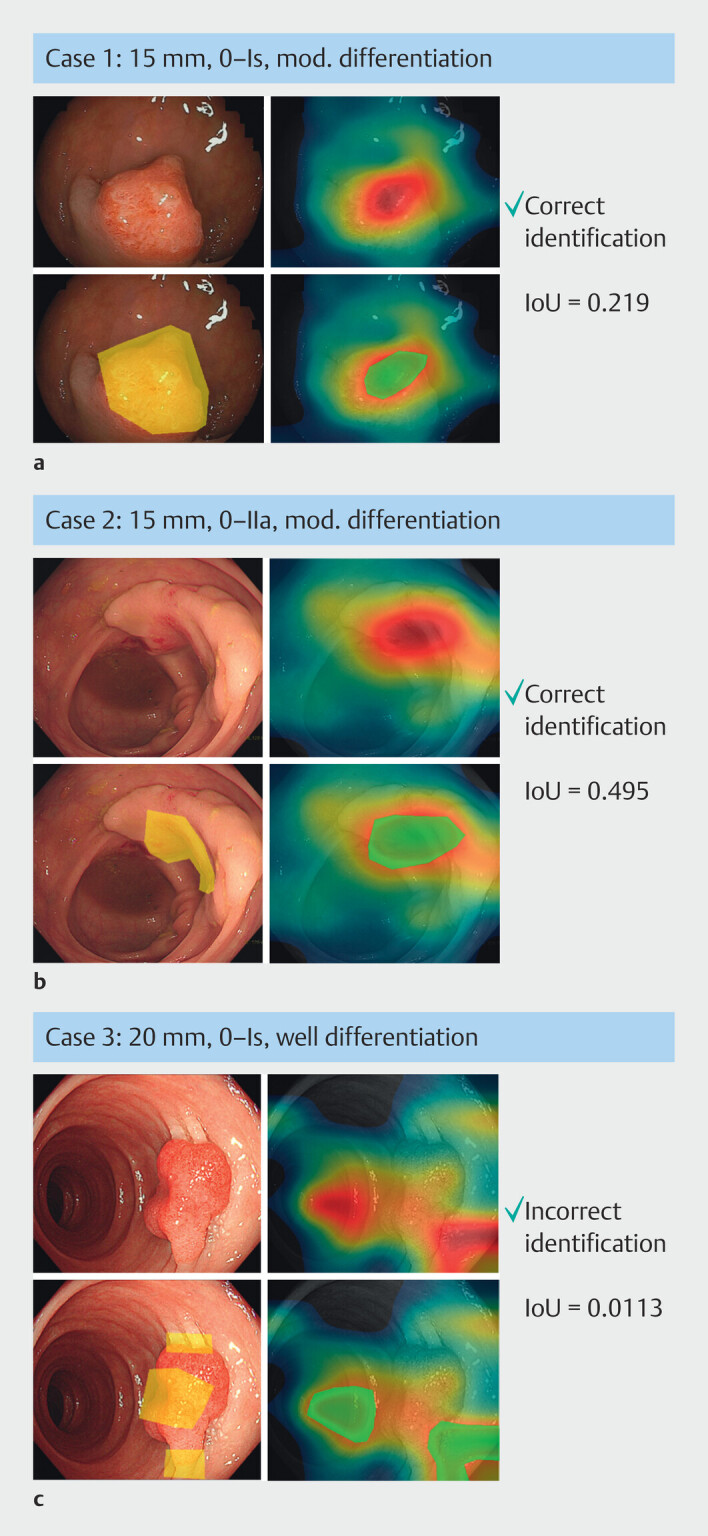
Examples for ROIs by CAD and endoscopist. Left top: original images; right top: CAM images; left bottom: ROI by endoscopists; right bottom: ROI by CAD. a 15 mm, 0-Is, mod. differentiation, IoU = 0.219. b 15 mm, 0-IIa, mod. differentiation, IoU = 0.495. c 20 mm, 0-Is, well differentiation. IoU = 0.0113. ROI, region of interest; CAD, computer-aided diagnosis; CAM, class activation mapping; mod, moderately.
Case 2 ( Fig. 5 b ) was a flat elevated lesion of the sigmoid colon, measuring 15 mm in maximum diameter. The center of the lesion was reddish and slightly depressed. The ROIs of both endoscopists and CAD were nearly identical, particularly in the depressed area at the center of the lesion, with an IoU approaching 0.5.
Case 3 ( Fig. 5 c ) was a protruding reddish lesion of the rectum, measuring 20 mm in maximum diameter. The center of the lesion was depressed, and the convergence of folds toward the lesion was evident. The ROI of endoscopists was the depressed area in the center of the lesion and convergences of fold. In contrast, the ROI for CAD was completely outside the lesion and seemed to align with the area affected by halation. The IoU is < 0.1.
Discussion
Our current study demonstrates that the IoU between CAD and expert endoscopists was lower for T1b CRCs incorrectly diagnosed compared with those correctly identified. To surpass the diagnostic ability of expert endoscopists, the findings from this study suggest that an effective methodology would involve aligning the ROI of CAD with that of endoscopists. Notably, the average IoU between CAD and expert endoscopists was only 0.2 despite the correct diagnosis, indicating that the CAD can learn more from the ROIs identified by endoscopists during its training phase, in addition to suggesting a need for fine-tuning of the CAD. Therefore, it is anticipated that adding annotations, which enclose the ROIs identified by endoscopists, will enhance the CAD learning efficiency and improve its diagnostic sensitivity for T1b CRCs.
It is premature to dismiss cases with discordant ROIs as having no diagnostic value, because the CAD may potentially diagnose T1b CRCs by focusing on a different ROI than that used by the endoscopist. Although the median IoU was only 0.2 even in correctly identified cases, the diagnostic accuracy for T1b CRCs was 66% (54 of 82), implying that the CAD focused on some findings outside the lesion as the basis for its diagnosis. From this perspective, it is likely that new diagnostic criteria distinct from the ROIs demarcated by endoscopists will emerge in the future, and these novel findings may be included in cases with discordant ROIs in this study.
Nevertheless, we thoroughly examined all endoscopic images to identify novel findings for T1b CRCs and the one potential candidate that emerged is halation (strong light reflection), which manifests as whitish areas inside or outside of the lesions in the endoscopic images. Most of the halations were observed on the inside of the lesion, but the CAD occasionally identified the halation as an ROI, as depicted in Fig. 5 c .
This study could contribute to detection of T1b CRCs. In the near future, we aim to develop a CAD system capable of alerting endoscopists with red flags when encountering T1b CRCs during screening endoscopy. We anticipate that this study will create an opportunity to develop such a CAD system.
We must acknowledge several limitations in this study. First, a majority of the cases did not align with the ROI, and the cause of this discrepancy remains incompletely clarified. One possible explanation for this disparity is the differing criteria for ROI between CAD and endoscopists. CAD ROI was defined solely as red regions within CAM images, excluding orange regions in the vicinity of the red region. While the CAD system did focus on the orange regions to a certain extent during diagnosis, most of these orange regions extended extensively outside of the lesion, making it challenging to establish a clear demarcation line. Consequently, the optimal IoU obtained in this study may not be meaningful due to the lack of a robust definition of the ROI. This study may serve primarily as a “proof of concept” to demonstrate how the CAD system can correlate with the diagnostic algorithms used by endoscopists. Second, we did not analyze data for Tis/T1a and focused exclusively on T1b. As a result, the significance of the CADx ROI in diagnosing T1b within Tis/T1a images remains unclear. Specificity in diagnosing stage T1b CRCs (i.e., correct identification of Tis/T1a lesions) is crucial for proper management of patients with early-stage CRC. High specificity, approaching 100%, is essential to prevent unnecessary surgeries in patients with Tis/T1a stage CRCs. Conversely, achieving 100% sensitivity (the correct diagnosis rate for T1b) could increase the rate of unnecessary surgeries for patients with stage Tis/T1a CRCs. We believe that the significance of analyzing the CAM for T1b in this study is not merely to enhance sensitivity for T1b cancer but to develop a CADx system that balances high specificity with high accuracy. This is accomplished through reinforcement learning based on the ROI of expert endoscopists, particularly when the CADx ROI significantly differs from that of experts in misdiagnosed T1b cases. Third, the ROI evaluations were conducted by two expert colonoscopists. The validity of this evaluation cannot be objectively verified, and it may be necessary to have it revalidated by other experts. Fourth, this study exclusively utilized high-quality images, with low-quality images excluded during the image selection stage. Consequently, this analysis is limited to lesions with high-quality images.
Conclusions
In conclusion, the present study enabled us to collect and analyze a relatively large number of T1b CRCs and revealed that optimizing annotation of the ROIs may be the key to improving diagnostic sensitivity of CAD for CRCs with deep submucosal invasion.
Footnotes
Conflict of Interest The authors declare that they have no conflict of interest.
Supplementary Material
References
- 1.Japanese Society for Cancer of the Colon and Rectum . Japanese Classification of Colorectal, Appendiceal, and Anal Carcinoma: the 3d English Edition Secondary Publication. J Anus Rectum Colon. 2019;3:175–195. doi: 10.23922/jarc.2019-018. [DOI] [PMC free article] [PubMed] [Google Scholar]
- 2.Pimentel-Nunes P, Dinis-Ribeiro M, Ponchon T et al. Endoscopic submucosal dissection: European Society of Gastrointestinal Endoscopy (ESGE) guideline. Endoscopy. 2015;47:829–854. doi: 10.1055/s-0034-1392882. [DOI] [PubMed] [Google Scholar]
- 3.Draganov P, Wang A, Othman M et al. AGA Institute clinical practice update: endoscopic submucosal dissection in the United States. Clin Gastroenterol Hepatol. 2019;17:16–25. doi: 10.1016/j.cgh.2018.07.041. [DOI] [PubMed] [Google Scholar]
- 4.Saitoh Y, Obara T, Watari J et al. Invasion depth diagnosis of depressed type early colorectal cancers by combined use of videoendoscopy and chromoendoscopy. Gastrointest Endosc. 1998;48:362–370. doi: 10.1016/s0016-5107(98)70004-5. [DOI] [PubMed] [Google Scholar]
- 5.Horie H, Togashi K, Kawamura YJ et al. Colonoscopic stigmata of 1mm or deeper submucosal invasion in colorectal cancer. Dis Colon Rectum. 2008;51:1529–1534. doi: 10.1007/s10350-008-9263-y. [DOI] [PubMed] [Google Scholar]
- 6.Matsuda T, Fujii T, Saito Y et al. Efficacy of the invasive/non-invasive pattern by magnifying chromoendoscopy to estimate the depth of invasion of early colorectal neoplasms. Am J Gastroenterol. 2008;103:2700–2706. doi: 10.1111/j.1572-0241.2008.02190.x. [DOI] [PubMed] [Google Scholar]
- 7.Mukae M, Kobayashi K, Sada M et al. Diagnostic performance of EUS for evaluating the invasion depth of early colorectal cancers. Gastrointest Endosc. 2015;81:682–690. doi: 10.1016/j.gie.2014.10.027. [DOI] [PubMed] [Google Scholar]
- 8.Backes Y, Schwartz MP, Ter Borg F et al. Multicentre prospective evaluation of real-time optical diagnosis of T1 colorectal cancer in large non-pedunculated colorectal polyps using narrow band imaging (the OPTICAL study) Gut. 2019;68:271–279. doi: 10.1136/gutjnl-2017-314723. [DOI] [PubMed] [Google Scholar]
- 9.Puig I, López-Cerón M, Arnau A et al. Accuracy of the narrow-band imaging international colorectal endoscopic classification system in identification of deep invasion in colorectal polyps. Gastroenterology. 2019;156:75–87. doi: 10.1053/j.gastro.2018.10.004. [DOI] [PubMed] [Google Scholar]
- 10.Takeda K, Kudo SE, Mori Y et al. Accuracy of diagnosing invasive colorectal cancer using computer-aided endocytoscopy. Endoscopy. 2017;49:798–802. doi: 10.1055/s-0043-105486. [DOI] [PubMed] [Google Scholar]
- 11.Ito N, Kawahira H, Nakashima H et al. Endoscopic diagnostic support system for cT1b colorectal cancer using deep learning. Oncology. 2019;96:44–50. doi: 10.1159/000491636. [DOI] [PubMed] [Google Scholar]
- 12.Lui TKL, Wong KKY, Mak LLY et al. Endoscopic prediction of deeply submucosal invasive carcinoma with use of artificial intelligence. Endosc Int Open. 2019;7:E514–E520. doi: 10.1055/a-0849-9548. [DOI] [PMC free article] [PubMed] [Google Scholar]
- 13.Nakajima Y, Zhu X, Nemoto D et al. Diagnostic performance of artificial intelligence to identify deeply invasive colorectal cancer on non-magnified plain endoscopic images. Endosc Int Open. 2020;8:E1341–E1348. doi: 10.1055/a-1220-6596. [DOI] [PMC free article] [PubMed] [Google Scholar]
- 14.Tokunaga M, Matsumura T, Nankinzan R et al. Computer-aided diagnosis system using only white-light endoscopy for the prediction of invasion depth in colorectal cancer. Gastrointest Endosc. 2021;93:647–653. doi: 10.1016/j.gie.2020.07.053. [DOI] [PubMed] [Google Scholar]
- 15.Nemoto D, Guo Z, Katsuki S et al. Computer-aided diagnosis of early-stage colorectal cancer using nonmagnified endoscopic white-light images (with videos) Gastrointest Endosc. 2023;98:90–99. doi: 10.1016/j.gie.2023.01.050. [DOI] [PubMed] [Google Scholar]
- 16.Zhou B, Khosla A, Lapedriza A . Las Vegas, NV: IEEE; 2016. Learning deep features for discriminative localization; pp. 2921–2929. [DOI] [Google Scholar]
- 17.Jaccard P. The distribution of the flora in the Alpine Zone.1. New Phytologist. 1912;11:37–50. [Google Scholar]
- 18.Selvaraju RR, Cogswell M, Abhishek D . Venice, Italy: IEEE; 2017. Grad-CAM: Visual explanations from deep networks via gradient-based localization. [DOI] [Google Scholar]
Associated Data
This section collects any data citations, data availability statements, or supplementary materials included in this article.


