

Abstract
Acute myeloid leukemia (AML) is recognized as an aggressive cancer that is characterized by significant metabolic reprogramming. Here, we applied spatial metabolomics to achieve high-throughput, in situ identification of metabolites within the liver metastases of AML mice. Alterations at metabolite and protein levels were further mapped out and validated by integrating untargeted metabolomics and proteomics. This study showed a downregulation in arginine's contribution to polyamine biosynthesis and urea cycle, coupled with an upregulation of the creatine metabolism. The upregulation of creatine synthetases Gatm and Gamt, as well as the creatine transporter Slc6a8, resulted in a marked accumulation of creatine within tumor foci. This process further enhances oxidative phosphorylation and glycolysis of leukemia cells, thereby boosting ATP production to foster proliferation and infiltration. Importantly, we discovered that inhibiting Slc6a8 can counter these detrimental effects, offering a new strategy for treating AML by targeting metabolic pathways.
Key words: Spatial metabolomics, Acute myeloid leukemia, Metabolic reprogramming, Creatine, Slc6a8, Oxidative phosphorylation, Glycolysis, Metastasis
Graphical abstract
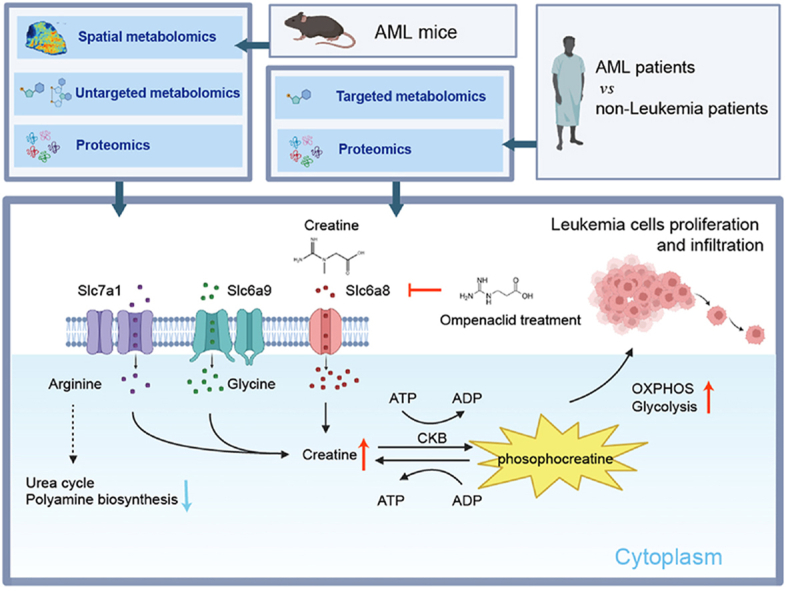
The creatine pathway significantly upregulated in the metabolic reprogramming of AML mice, driven by both biosynthesis and the creatine transporter Slc6a8. The elevated creatine supports metastatic leukemia cell survival by enhancing OXPHOS and glycolysis. The Slc6a8 inhibitor ompenaclid could effectively inhibit AML cell proliferation and infiltration both in vitro and in vivo.
1. Introduction
Acute myeloid leukemia (AML) is characterized by the swift expansion of abnormal cells within the hematopoietic system1,2. Though AML accounts for only about 1% of all cancers, it stands as the most prevalent form of acute leukemia among adults, which is typically diagnosed at a median age of 683. The five-year relative survival rate of AML was 31.7% from 2013 to 2019 (except for acute promyelocytic leukemia), but it significantly deteriorated to below 10% for individuals aged 60 and over3, 4, 5. Although hepatic involvement in AML generally presents as mild and often asymptomatic at diagnosis, postmortem studies have revealed liver infiltration in 40%–75% of cases with AML6, 7, 8. Further, liver infiltration is frequently observed in various leukemia mouse models9, 10, 11, 12, 13, and is pivotal for evaluating drug efficacy, describing disease progression, and studying pathogenesis. These findings mean the liver may serve as a potentially distinctive niche for leukemia cells. However, the roles of metabolites in AML hepatic microenvironment have yet to be elucidated.
The reprogramming of energy metabolism is a fundamental trait of cancer cells, enabling them to meet their increased ATP demands, particularly in AML cells, which exhibit distinct metabolic adaptations that fuel leukemia progression14, 15, 16. While the role of somatic mutations as pivotal drivers of AML is well-established, emerging research has shown that the altered metabolic landscape of AML cells, including leukemia stem cells (LSCs), mostly manifests independently of genetic anomalies17. AML cells and LSCs rely heavily on oxidative phosphorylation (OXPHOS) for their energy needs, with a correspondingly reduced dependence on glycolysis. Consequently, this metabolic rigidity renders them particularly vulnerable to therapeutic strategies that disrupt OXPHOS17, 18, 19.
Emerging researches highlight the centrality of metabolic dysregulation in leukemogenesis and the advancement of AML cells, linking specific metabolic pathways and metabolites with malignant transformation20,21. Thus, neoplastic and normal cells have a divergent metabolic landscape regarding amino acid, lipid, and other metabolite management. Amino acids are crucial, serving multifunctional roles that include protein biosynthesis, energy provision, nucleotide synthesis, redox balance maintenance, and regulation through homeostatic, epigenetic, and post-translational modifications22, 23, 24. This complex network of metabolic aberrations presents a promising target for innovative therapeutic strategies, emphasizing the need for comprehensive research to identify the metabolic vulnerabilities of leukemia cells 25,26.
Technological advancements in metabolomics, particularly spatial metabolomics, have led to groundbreaking discoveries that unveil the metabolic diversity within tumor environments and drug distribution in tissues27, 28, 29, 30. This method integrates metabolomic analysis with high-resolution imaging to map metabolite distributions, uncovering the dynamic interactions between cancer cells and their environmental cells31, 32, 33. The application of this technique in tumor microenvironment research is well-documented. One notable study employs spatially resolved multi-omics to explore glioblastomas, revealing distinct tumor niches characterized by specific immunological and metabolic stress signatures34. In another investigation, researchers mapped tumor metabolic remodeling and its spatial interplay with adjacent non-tumor cells, identifying a distinct “tumor–normal interface” dominated by immune cells, which showed unique metabolic signatures35.
To explore the metabolic implications of liver niche in AML, our study focused on investigating liver metastasis from AML mice using the well-established airflow-assisted desorption electrospray ionization mass spectrometry imaging (AFADESI-MSI) to explore metabolic reprogramming and interactions within the tumor microenvironment of AML and to identify further the potential drugs to block AML proliferation and infiltration.
2. Methods
2.1. Cell culture
Cell culture methodologies for various leukemia cell lines were standardized to ensure consistent growth conditions. The mouse acute myelomonocytic leukemia cell line C1498 (M4) was maintained in Dulbecco's Modified Eagle Medium (DMEM, Yuanpei, China) with 10% fetal bovine serum (FBS, Meograte, New Zealand) and 1% penicillin/streptomycin (PS, Gibco, USA). The human myelomonocytic leukemia cell line MV4-11 (M4) was cultured in Iscove's modified Dulbecco's medium (IMDM, Yuanpei, China) supplemented with 10% FBS and 1% PS. The human monocytic leukemia cell lines MOLM13 (M5) and THP1 (M5) were grown in RPMI-1640 medium (Yuanpei, China), supplemented with 10% FBS and 1% PS. All cell lines were incubated at 37 °C in a humidified atmosphere containing 5% CO2 to ensure optimal growth conditions.
2.2. Mouse model of AML
The animal experiments were conducted with the approval of the Animal Ethical Committee of the Ruijin Hospital, affiliated with the Shanghai Jiao Tong University School of Medicine (Shanghai, China) (No. RJ2023002). Male C57BL/6J mice, aged eight weeks, were procured from Gempharmatech (Nanjing, China) and accommodated under specific pathogen-free (SPF) conditions. The environment was strictly regulated for humidity, and a 12-h light/dark cycle at a consistent temperature was maintained. To establish an AML mouse model, the luciferase-tagged C1498 cell line was cultured, harvested, and washed twice before use13,36. Subsequently, 1 × 10⁶ C1498-luc cells were intravenously injected into the mice. Following intravenous injections, mice were returned to their cages and closely monitored for health changes.
2.3. Patient bone marrow mononuclear cells (BMNCs) collection and CD34+ BMNCs isolation
BMNCs were obtained from six newly diagnosed AML and ten non-leukemia patients (age and gender matched). The collection of the human samples was approved by the Ethics Committee of Ruijin Hospital, and written informed consent was obtained. BMNCs were isolated using Ficoll–Paque Plus (Cytiva, Cat# 17144003, USA), CD34+ BMNCs from non-leukemia patients were isolated through magnetic bead sorting (Miltenyi Biotec, Germany) following the manufacturer's instructions and published literature37. Due to insufficient CD34+ cells, the samples from 10 non-leukemia patients were combined into 5 samples. These samples were subsequently preserved at −80 °C for future 4D-DIA proteomics and targeted metabolomics analyses.
2.4. Preparation of liver metastasis tissue sections from AML mice
Liver metastasis samples were sectioned into serial frozen slices measuring 10 μm in thickness using a CM1950 Cryostat Microtome (Leica, Germany) at a temperature of −20 °C. These sections were then thaw-mounted onto SUPERFROST PLUS slides (Thermo Scientific, USA) and preserved within sealed slide containers at −80 °C until further examination. Before AFADESI-MSI analysis, the frozen sections were dehydrated in a vacuum desiccator at 20 °C for 1 h and acclimated to room temperature for an additional hour. Concurrently, serial sections of the liver metastasis were fixed using 4% paraformaldehyde, followed by Hematoxylin and Eosin (H&E) staining, to facilitate histological examination.
2.5. Spatial metabolomics analysis using AFADESI-MSI
The imaging of tissue metabolites was performed on an AFADESI-MSI platform coupled with a QE-HFX mass spectrometer (Thermo Scientific, USA)30,33,35,38. The spray solvent was acetonitrile and water (80:20, v/v), with the solvent flow rate precisely maintained at 5.0 μL/min. Sprayer voltages were configured at +4500 V for positive ion mode and −4500 V for negative ion mode in the mass-to-charge ratio (m/z) 100–1000 range. The AFADESI ion source's extracting gas flow was regulated at 25 L/min, while the nebulizing gas (N2) pressure was set at 0.65 MPa. For comprehensive metabolite distribution analysis, tissue sections were systematically scanned in the x-direction at a speed of 100 μm/s, with each scan followed by a 100 μm step in the y-direction, ensuring detailed and high-resolution imaging.
Raw data from AFADESI-MSI analysis were first converted into CDF format utilizing Xcalibur 4.1 software (Thermo Scientific, USA), and subsequently imported into MassImager software (Version 1.0, Chemmind Technologies Co., China) for necessary pre-processing steps including background subtraction, image reconstruction, and quantification of average metabolite expressions within specified regions of interest (ROIs)39. Metabolomic profiles from both tumor foci (TF) and peritumoral region (PR, approximately 5 mm from the tumor's periphery) were extracted from the MSI data. The average ion intensity for each area was calculated, and two-dimensional data matrices (m/z vs. ion intensity) in the.txt format were created. These matrices were then imported into Markerview 1.2.1 (AB SCIEX, USA) for peak alignment and removal of isotope ions. MetaboAnalyst 6.0 was employed for statistical analysis. The Variable Importance in Projection (VIP) score for each ion was computed to determine its significance in the OPLS-DA model, while the Student's t-test was utilized to assess differences between the groups. Consequently, ions exhibiting a VIP score ≥1.0 and a P-value <0.05 were identified as potential metabolites.
2.6. Sample preparation for untargeted metabolomics
Liver tissues were from healthy mice (HC), TF, and PR of AML mice. 10 mg of tissues were placed in a 1.5 mL centrifuge tube with a pre-added porcelain ball. Tissue homogenization was performed in ice-cold methanol/acetonitrile/water (2/2/1, v/v/v) using a 3D cryogenic grinder (Shanghai jinxing, China) for 10 cycles. After cooling for 1 h at −20 °C, the mixture underwent centrifugation at 13,000 rpm, 4 °C for 15 min to separate proteins and tissue residues by sedimentation. Subsequently, 800 μL of the supernatant was carefully moved to a new tube, and then lyophilize the supernatant in a centrifugal vacuum evaporator at 4 °C. Reconstitute the sample in 100 μL acetonitrile/water (50/50, v/v), vortex for 60 s and centrifuge for 10 min at 15,000×g and 4 °C. Transfer the supernatant to a threaded screw-neck vial with an insert for future analyses.
2.7. Untargeted metabolomics analysis using LC‒MS/MS
A hyphenated LC‒MS system equipped with LC-30A high-performance liquid chromatography (Shimadzu, Kyoto, Japan) and a Triple Q-TOF 6600+ mass spectrometer (AB SCIEX, USA) was used for metabolic profiling. Chromatographic separation was performed using an Acquity HSS T3 column (100 mm × 2.1 mm, 1.8 μm, Waters, USA). Lyophilized samples of pretreatment samples in 2.6 were reconstituted in 100 μL of acetonitrile/water (50/50, v/v), and 2 μL of the sample was injected into the system. The mobile phases were A (water with 0.1% formic acid, v/v) and B (acetonitrile with 0.1% formic acid) for both the positive (ESI+) and negative (ESI−) modes. The elution gradient initiated with 1% B for 1.5 min, linearly increased to 99% B at 13 min, and maintained 3.5 min, then came back to 1% B in 0.1 min and held for 3.4 min for post equilibration. The flow rate was set as 0.3 mL/min, and the column temperature was 40 °C. Spray voltages were set at 5.5 kV for positive and −4.5 kV for negative ion modes, respectively, with a source temperature of 550 °C. Curtain gas, gas 1, and gas 2 pressures correspondingly regulated at 40, 55, and 55 psi. Information-dependent acquisition (IDA) enabled auto-MS2 on the 10 most intense metabolite ions per full scan cycle. The m/z scan range for precursor and product ions was established from 60 to 1000 Da. The collision energy was set at 35 V for positive mode and −35 V for negative mode, with a collision energy spread of 15 V, ensuring comprehensive metabolite identification and quantification.
Metabolite identification was conducted by the methods described in our previous publication40. The raw MS data was analyzed using SCIEX OS software with an in-house metabolite spectral library for metabolite annotation by matching accurate mass, retention time, and MS/MS similarity.
2.8. Sample preparation for targeted metabolomics
5 × 10⁶ counted cells from AML BMNCs and non-leukemia CD34+ BMNCs were fragmented in 1 mL ice-cold methanol/acetonitrile/water (2/2/1, v/v/v) using Bioruptor Plus (Diagenode) for 10 cycles (30 s on, 30 s off per cycle). The subsequent procedures are identical to those outlined in part 2.6. Details of the clinical samples are provided in Supporting Information Table S2.
2.9. Targeted metabolomics analysis using LC‒MS/MS
Levels of phosphocreatine, l-arginine, creatinine, citrulline, proline, l-glutamate, glutamine, l-aspartic acid, ornithine, S-adenosylmethionine and creatine from AML BMNCs and non-leukemia CD34+ BMNCs were quantified by targeted metabolomics.
Standard curves were established for the quantitative measurement of targeted metabolites. To assess the linearity of each standard compound solution, the standard curves were plotted using the concentration gradient as the horizontal axis and the peak area ratios of the compound to its corresponding internal control as the vertical axis. The correlation coefficients for all standard curves exceeded 0.99, demonstrating excellent linearity.
2.10. Sample preparation for global proteomics
Liver tissues were from HC, TF, and PR of AML mice. Approximately 20 mg of wet-weight tissues were individually homogenized in 400 μL lysis buffer with a gentleMACS Dissociator (Miltenyi Biotec, Cat# 130-096-335). This buffer comprised RIPA Lysis and Extraction Buffer, 8 mol/L urea, 1 × complete protease inhibitor, and 1 × PhosSTOP phosphatase inhibitor. The homogenates were then centrifuged at 4000×g for 10 min at 4 °C to sediment tissue debris. The resultant supernatants were collected, and protein concentrations were quantified using the Pierce BCA Protein Assay Kit (Thermo Fisher, Cat# 23225). The extracted proteins were reduced with 10 mmol/L dithiothreitol (Sigma, Cat# 107089894001) for 30 min at 56 °C and alkylated with 15 mmol/L iodoacetamide (Sangon Biotech, Cat# A600539-0025) for 30 min at room temperature in the dark. Subsequently, samples were precipitated with cold acetone (−20 °C) for over 4 h at a 1:5 volume ratio and centrifuged at 14,000×g for 20 min at 4 °C. The pellets were resuspended in 50 mmol/L ammonium bicarbonate and digested with trypsin (Promega, Cat# V5117/V5111) for 16 h at a 1:50 enzyme-to-substrate ratio at 37 °C. Tryptic peptides were purified using Sep-Pak C18 cartridges (Waters, Cat# 186002319) and then vacuum-dried. Peptide concentrations were determined by the Pierce Quantitative Colorimetric Peptide Assay (Thermo Fisher, Cat# 23290).
BMNCs and CD34+ BMNCs samples were respectively from AML and non-leukemia patients. Approximately 5 × 10⁶ cells were individually lysed in 400 μL of the same lysis buffer on ice for 20 min. This was followed by 10 cycles of sonication at 4 °C using the Bioruptor Plus (Diagenode) to ensure thorough disruption. Lysates were centrifuged at 4000×g for 10 min at 4 °C to remove cell debris. Supernatants were collected for protein concentration determination via the Pierce BCA Protein Assay Kit (Thermo Fisher, Cat# 23225), following a similar workflow as described for tissue samples.
2.11. Global proteome analysis using LC‒MS/MS
Internal retention time (iRT) peptides (Biognosys Inc.) were spiked into the tryptic digests before loading onto the nanoElute liquid chromatography (Bruker Daltonics). Chromatographic separation was performed on a C18 analytical column equipped with an integrated CaptiveSpray emitter (1.6 μm particle size, 250 mm × 75 μm, IonOpticks, AUR2-25075C18A-CSI), employing a 60-min predefined gradient at a flow rate of 300 nL/min. The gradient comprised 0.1% formic acid in water (buffer A) and 0.1% formic acid in acetonitrile (buffer B), escalating from 2% to 22% B over 45 min, followed by a rise to 35% B in the next 5 min, reaching 80% B in another 5 min and maintaining at 80% B for a final 5 min. The column temperature was consistently maintained at 50 °C. The eluted peptides were subjected to timsTOF Pro mass spectrometry (Bruker Daltonics) that operated in dia-PASEF mode. The isolation windows were configured with a width of 25 m/z, monitoring precursor ions ranging from 375 to 1300 m/z and ion mobility from 0.61 to 1.53 V·s/cm2 across 37 windows. Collision energy was linearly increased from 20 to 59 eV. TIMS elution voltages were linearly calibrated to derive reduced ion mobility coefficients (1/k0) using three ions from the Agilent ESI-L Tuning Mix (m/z 622, 922, 1222).
The DIA raw files were subjected to direct DIA processing using Spectronaut software, version 18.5 (Biognosys, Zurich, Switzerland). The search parameters included carbamidomethylation as a fixed modification, along with acetylation of the protein N-terminus and oxidation of methionines as variable modifications. The analysis adhered to a trypsin/P proteolytic cleavage rule, allowing up to two missed cleavages and accepting peptide lengths ranging from 7 to 52 amino acids. Protein intensities were normalized through “Global Normalization” to ensure data consistency across samples. The false discovery rates (FDR) cutoff of the peptide to spectrum match (PSM), peptide, and protein group were all <0.01.
2.12. Enzyme-linked immunosorbent assay (ELISA) of creatine and creatine kinase
Plasma was obtained from healthy and AML mice. After anesthetizing the mice with 1% sodium pentobarbital, blood samples were carefully collected from the posterior orbital venous plexus and immediately transferred into ethylenediaminetetraacetic acid (EDTA)-anticoagulated Eppendorf tubes. The samples were then centrifuged at 2500 rpm for 10 min at 4 °C. After centrifugation, the plasma was promptly separated and stored at −80 °C for future analyses.
Tissue samples from HC, TF, and PR groups were immediately snap-frozen in liquid nitrogen, and approximately 0.1 g of tissue samples were homogenized with 1 mL of extraction solvent provided in the ELISA kits. The homogenates were then transferred to Eppendorf tubes and centrifuged at 12,000 rpm, 4 °C for 10 min. The supernatants were collected for further analysis.
Quantitative assessments of creatine and creatine kinase levels of plasma and tissue samples were performed using commercial ELISA kits (Creatine: LDQB-E-1183, CK: SU-BN27890, Czkwbio, China). All procedures were conducted following the manufacturer's guidelines.
2.13. Quantitative real-time PCR (qRT-PCR)
Liver tissues were from HC, TF, and PR of mice. After the total RNA was extracted, we utilized the RNA Easy Fast Tissue/Cell Kit (TIANGEN, Cat# DP451, China) according to the manufacturer's instructions. The concentration of RNA was quantified using the NanoDrop™ 8000 Spectrophotometer (Thermo Fisher, USA). After RNA extraction, 1 μg of total RNA was reverse-transcribed into cDNA using the FastKing gDNA Dispelling RT SuperMix (TIANGEN, Cat# KR118, China). The qPCR reactions were prepared using 2 × TSINGKE® Master qPCR Mix (SYBR Green I with UDG) (Tsingke Bio, Cat# TSE203, China), incorporating appropriate amounts of cDNA, forward and reverse primers (Sangon Bio). The amplification and detection of specific products were conducted on the LightCycler 480 System (Roche, Switzerland). Relative quantification of gene expression was determined by the ‒ΔΔCt method, using mouse actin as an internal control to normalize the expression levels of the target genes. The specific primer sequences utilized for the qPCR reactions are detailed in the Supporting Information Table S1.
2.14. Immunohistochemical (IHC) assay
Immunohistochemical analysis was performed on serial frozen tissue sections at a thickness of 10 μm, from part 2.2. Initially, sections were equilibrated to room temperature and subsequently fixed in methanol. Antigen retrieval was facilitated via heat induction before the immunostaining process. The sections were incubated overnight at 4 °C with primary antibodies Gatm (1:100 dilution, Proteintech, Cat# 12801-1-AP, USA), Gamt (1:200 dilution, Proteintech, Cat# 10880-1-AP, USA), and Slc6a8 (1:200 dilution, Proteintech, Cat# 20299-1-AP, USA). This was followed by incubating with universal HRP-linked secondary antibody (1:600 dilution, Agilent-DAKO, Cat# K5007, Denmark) for 1 h at room temperature. Visualization of the immunoreactivity was achieved using DAB (Agilent-DAKO, Denmark), and nuclei were counterstained with Susutin for contrast. Microscopic examination was conducted using an Optika IM-3 light microscope (Optika, Italy), and digital images were captured with BioTek Cytation 5 (Agilent, USA), utilizing Gen5 Image Software (Version 3.12, Agilent, USA) for image acquisition. Quantitative analysis of immunoreactivity was performed using ImageJ software (Version 1.53), with the percentage of area showing positive staining calculated for each marker. To ensure representativeness and statistical significance, each section analyzed included two distinct ROIs per group.
2.15. Creatine and ompenaclid (Slc6a8 inhibitor) treatment
Mice bearing acute myeloid leukemia were randomly allocated into three groups, each consisting of four animals: control group, creatine treatment group, and ompenaclid treatment group. Treatments were administered orally three times a week in 200 μL; the control group received 1 × PBS, while the creatine and ompenaclid groups were treated with 85 mg/mL creatine and 130 mg/mL ompenaclid containing water, respectively. After a treatment period of four weeks, the luciferase activity of the leukemia cells was measured using the in vivo imaging system (IVIS) (PerkinElmer, USA) to quantify the bioluminescent signal. Subsequently, all mice were included in survival analysis experiments to assess the impact of the treatments on lifespan.
2.16. CCK-8 assay
Cell proliferation rate was assessed using Cell Counting Kit-8 (CCK-8, Dojindo, Japan) according to the manufacturer's guidelines. The AML cell lines MV4-11, THP-1, MOLM-13, and C1498 were cultured in 96-well plates at a seeding density of 8000 cells per well. The cells were incubated in media supplemented with 1% FBS and treated with either 5 mmol/L creatine (MCE, China), 10 mmol/L ompenaclid (MCE, China), or a combination of 5 mmol/L creatine and 10 mmol/L ompenaclid. Treatments were applied for 12, 24, and 48 h. At each time point, 10 μL of the CCK-8 solution was added to the wells, and the plates were incubated for an additional 4 h to allow for color development. The optical density (OD) was measured at 450 nm using a SpectraMax Paradigm microplate reader (Molecular Devices, USA).
2.17. Seahorse XF-96 energetic analysis
Cells were grown in their respective medias and treated with 5 mmol/L creatine, and 10 mmol/L ompenaclid for 36 h before plating for the Seahorse assay. Cells were counted with Countess 3 Automated Cell Counter (Thermo Scientific, USA) and 25000 AML cells were plated in Cell-TAK-coated (Corning, Cat# 354240, USA) Seahorse XF-96 assay plates (Agilent, Cat# 25523, USA) with Seahorse XF DMEM media (Agilent, Cat# 103575-100)37. The oxygen consumption rate (OCR) and extracellular acidification rate (ECAR) were measured using a Seahorse 96 extracellular flux analyzer (Agilent, USA) according to Agilent Mito Stress Test and Glycolysis Test instructions (Agilent, Cat# W27623, USA). Briefly, the medium was replaced by Seahorse XF DMEM Base Medium (Agilent Technologies) supplemented with 1 mmol/L pyruvate, 2 mmol/L glutamine, and 10 mmol/L glucose 1 h before assay. Then, the plate was incubated in a 37 °C non-CO2 incubator for 45 min. OCR and ECAR were continuously measured and compounds were automatically injected into each well in the following concentration and order: 2.5 μmol/L oligomycin, 3 μmol/L FCCP, and 0.5 μmol/L Rotenone/Antimycin A; 0.5 μmol/L Rotenone/Antimycin A, 50 mmol/L 2-DG, respectively. Both OCR and ECAR values were normalized by cell counts.
2.18. Statistical analyses
The sample size for this study was meticulously calculated to ensure adequacy, leveraging both the magnitude and consistency of the observable differences across groups in all conducted experiments. All data underwent statistical analysis utilizing GraphPad Prism version 10.0, with results presented as the mean ± standard error of the mean (SEM) of the samples unless indicated otherwise. This study included a minimum of three independent experiments/samples to bolster the reliability of findings. Student's t-test and one-way or two-way analysis of variance (ANOVA) were utilized for comparison between two groups and multiple comparisons, respectively. A P-value of less than 0.05 was set as the threshold for statistical significance.
3. Results
3.1. Spatial profiling of endogenous metabolites in leukemia mice using AFADESI-MSI
To elucidate the metabolic remodeling within liver metastasis of AML mice, we implemented AFADESI-MSI (Fig. 1A). In brief, liver metastasis samples from AML mice were sectioned into 10 μm serial frozen sections and subsequently analyzed using the AFADESI platform. The results delineated the global metabolic profiles, distinguishing tumor foci from the peritumoral region (Supporting Information Fig. S1A). Additionally, H&E images were integrated into the MassImager software for advanced image fusion and spatial alignment (Fig. S1B‒S1D). Following this integration, region-specific in situ MSI were meticulously extracted from the sampling spots marked on the H&E images, facilitating a comprehensive spatial metabolomics analysis.
Figure 1.

Spatial metabolomics profiling of endogenous metabolites in leukemia mice using AFADESI-MSI. (A) The methodology and workflow of spatial metabolomics, aim to delineate metabolites for molecular histology characterization. (B, C) Enrichment analysis (B) and pathway analysis (C) of AFADESI-MSI data, and metabolites exhibiting significant differential expression (VIP>1 and P < 0.05) were analyzed using MetaboAnalyst 6.0 through the KEGG database to elucidate underlying biological pathways and interactions. (D) PCA score plots derived from AFADESI-MSI data, comparing TF with PR. PR, peritumoral region; TF, tumor foci.
We identified a total of 100 significant differential metabolites between TF and PR, as depicted in a heatmap showing distinct patterns of distribution (Fig. S1A). Metabolic pathway enrichment analysis of these differential metabolites identified significant enrichments in pathways critical for tumor metabolism, mainly including arginine biosynthesis, arginine, and proline metabolism (Fig. 1B and C). Principal component analysis (PCA) indicated that TF and PR exhibit obvious clustering and grouping trends (Fig. 1D). Moreover, when classifying these metabolites into superchemical classes, our analysis revealed a predominance of organic acids and derivatives (27.08%), as well as lipids and lipid-like molecules (32.29%), underscoring the metabolic complexity of the tumor microenvironment (Fig. S1E).
3.2. Validation of region-specific metabolic reprogramming through untargeted metabolomic
Metabolites could directly act as communication messages between cells, especially catching attention in cancer research41. Therefore, we further employed untargeted metabolomics of TF, PR, and HC liver samples to validate and supplement the results of MSI (Fig. 2A). In this study, we elucidated 33 metabolites with significant differential expression among three groups via untargeted metabolomics, as delineated by a heatmap (Supporting Information Fig. S2A). The top 10 enriched pathways, derived from both MSI and untargeted metabolomics, spotlighted common critical pathways such as arginine biosynthesis, arginine and proline metabolism, glycerophospholipid metabolism, and purine metabolism (Fig. 2B). Furthermore, top 20 pathway analysis shed light on essential metabolic pathways including histidine metabolism; cysteine and methionine metabolism; arginine biosynthesis, arginine and proline metabolism, etc (Fig. S2B and S2C). Notably, amino acid metabolism was the most prominently enriched category in the secondary classification of KEGG pathways across both analyses. PCA further affirmed the presence of distinct metabolic phenotypes within the three groups (Fig. 2C). Examination of overlapping identified metabolites highlighted a particular enrichment in arginine and proline metabolism (Fig. 2D and E), with the heatmap revealing unique distribution patterns across the groups (Fig. 2F and G). These results suggested that metabolites in the arginine and proline metabolism pathway might play important roles.
Figure 2.

Multi-omics analysis of metabolic reprogramming across tumor tissues. (A) Schematic representation of the workflow for untargeted metabolomics and proteomics. (B) Enrichment analysis showcasing significant pathways identified in spatial and untargeted metabolomics, along with a summary of their KEGG pathway secondary classifications. (C) PCA score plot derived from untargeted metabolomics data, comparing HC, TF, and PR. (D) Venn diagram highlighting the common significant differential metabolites between spatial and untargeted metabolomics. (E) Enrichment analysis of the overlapped significant differential metabolites of spatial and untargeted metabolomics. (F, G) Heatmaps illustrating the patterns of overlapped metabolites above from spatial metabolomics (F) and untargeted metabolomics (G), data analysis was performed via MetaboAnalyst 6.0 using ‘Euclidean’ distance and ‘Ward’ clustering method. (H) Venn diagram showing the significant differential proteins' overlap among comparisons: PR vs. HC, TF vs. HC, and PR vs. HC, (fold-change <0.7 or >1.5 and P-value of <0.05). (I) Gene Ontology (GO) biological process analysis for both downregulated (fold-change <0.7; P-value <0.05) and upregulated (fold-change >1.5; P-value <0.05) overlapped proteins above. (J) Summary of the top 20 enriched KEGG pathways, with a focus on the metabolism-related pathways. PR, peritumoral region; TF, tumor foci; HC, healthy control.
3.3. Detection of region-specific protein profile in tumor tissue
Due to the significant alterations at metabolic levels observed, we further investigated whether corresponding changes in protein expression occurred. Consequently, we performed 4D-DIA-based proteomics analysis for TF, PR, and HÇ. In total, we identified differential proteins across various comparisons: 2943 between PR and TF, 4753 between TF and HC, 2944 between PR and HC, with 1433 differential proteins shared across these comparisons (Fig. 2H). With shared 1433 differential proteins, we observed a downregulation in the biological processes related to the small molecule catabolic process, cellular amino acid metabolic process, and cellular amino acid catabolic process in the PR vs. TF group, according to Gene Ontology (GO) enrichment analysis (Fig. 2I). This corroborates with our previous findings in the metabolomic analysis. Additionally, the cellular component (CC) and molecular function (MF) aspects of GO analysis demonstrated a new potential mechanism (Fig. S2C and S2D). In the analysis of enriched KEGG pathways, the metabolism category was predominant, especially highlighting the significance of amino acid metabolism and energy metabolism (Fig. S2E). Among the top 20 KEGG pathways, the majority were categorized under metabolism, with two pathways related to genetic information processing (data not shown). Specifically, the biosynthesis of amino acids, arginine, proline metabolism, and arginine biosynthesis were among the top 20 pathways, which were also detected in spatial and untargeted metabolomics (Fig. 2J).
In summary, we elucidate the profound proteomic alterations within liver metastasis tissues, consistent with the results of metabolomics. These results highlight significant disruptions in arginine and proline metabolism, suggesting that this metabolic pathway may play an essential role in the tumor progression of AML.
3.4. Integrated multi-omics analysis maps unique metabolic reprogramming in the arginine toward creatine pathway
In this study, we observed significant upregulation of arginine and proline metabolism within tumor tissues of AML mice, highlighting the critical role of arginine in tumor metabolism. Consequently, we conducted a detailed analysis of tumor-associated metabolic remodeling in liver metastases from AML mice. We performed mass spectrometry imaging and proteomics to map key metabolites and regulatory enzymes throughout the arginine and proline metabolic pathways. This comprehensive mapping not only confirmed the altered metabolic landscape but also identified important metabolites that could impact tumor tissues (Fig. 3A).
Figure 3.

Visualization of reprogrammed arginine and proline metabolism in liver metastasis of AML mice. (A) Spatial metabolomics imagery alongside proteomics data underscores crucial metabolites and enzymes in the arginine and proline metabolism pathway and its extended metabolic networks. (Intensity in MS image color scale is relative value, in the names of metabolic pathways or enzymes, blue font denotes a decrease, red an increase, and black no change or undetected). (B) (B1–B8) Column charts detailing the abundance levels of metabolites detected by SM in the arginine and proline metabolism pathway. (C) (C1–C18) Column charts illustrating the protein abundance of crucial enzymes in the arginine and proline metabolism pathway. PR, peritumoral region; TF, tumor foci; HC, healthy control; Gatm, glycine amidinotransferase; Gamt, guanidinoacetate N-methyltransferase; Ckb, creatine kinase brain type; Arg1, arginase 1; Otc, ornithine transcarbamylase; Ass1, argininosuccinate synthase 1; Asl, argininosuccinate lyase; Azi2, 5-azacytidine induced 2; Agmat, agmatinase; Srm, spermidine synthase; Sms, spermine synthase; Gls, glutaminase; Glul, glutamate-ammonia ligase; Oat, ornithine aminotransferase; Aldh18a1, aldehyde dehydrogenase 18 family, member a1; Pycr, pyrroline-5-carboxylate reductase. For (B1) to (B8), with a sample size of n = 12, statistical analysis was conducted using the Student's t-test. For (C1) to (C18), where the sample size varied n = 4–6, one-way ANOVA was employed for statistical evaluation. Error bars represent the mean ± SEM. Statistical significance is denoted as follows: ∗P < 0.05, ∗∗P < 0.01, ∗∗∗P < 0.001, ∗∗∗∗P < 0.0001.
l-Arginine is more abundant in TF, as shown (Fig. 3B1), and is accompanied by citrulline, which is enriched in tumor loci and serves as a precursor for l-arginine synthesis (Fig. 3B6). Argininosuccinate synthase 1 (Ass1) and argininosuccinate lyase (Asl) are essential for arginine biosynthesis and were downregulated in TF (Fig. 3C1 and 2). Moreover, arginase 1 (Arg1), 5-azacytidine induced 2 (Azi2), ornithine transcarbamylase (Otc), and agmatinase (Agmat) that are involved in traditional pathways of arginine metabolism, such as the urea cycle and polyamine biosynthesis pathways, are significantly downregulated in the TF, except Azi2 (Fig. 3C3‒6).
Furthermore, our investigation uncovered an important arginine metabolic diversion: the creatine pathway. Although glycine amidinotransferase (Gatm) and guanidinoacetate N-methyltransferase (Gamt), central enzymes in this pathway, showed no significant alterations between PR and TF (Fig. 3C7 and 8). However, the intermediary metabolite guanidinoacetic acid displayed decreased expression, and the terminal metabolite creatine exhibited an upregulation (Fig. 3B2 and 3). Simultaneously, creatine kinase brain type (Ckb), responsible for the transformation of creatine into phosphocreatine and thus swiftly energizing cellular mechanisms, was found to be elevated in TF (Fig. 3C9). These results suggested that both creatine synthesis and utilization were upregulated in TF.
Other metabolites in this pathway also showed specific spatial distributions. Spermidine was found to be enriched in TF (Fig. 3B4), it can also be synthesized from cysteine and methionine metabolism, with S-adenosyl-l-methionine (SAM) demonstrating enhanced spatial distribution in TF (Fig. 3B5). Spermine synthase (Sms) and Spermidine synthase (Srm), enzymes involved in the conversion of SAM to spermidine, were found to be upregulated in TF (Fig. 3C10 and 11). These results explain the reduced synthesis of arginine to polyamines but the simultaneous accumulation of spermidine in TF. In addition, as a critical precursor for the biosynthesis of both arginine and proline, glutamine was downregulated in TF (Fig. 3B7). Glutamate-ammonia ligase (Glul), responsible for converting glutamate to glutamine, exhibited reduced expression in TF (Fig. 3C13). Conversely, glutaminase (Gls), which converts glutamine back to glutamate, was markedly upregulated (Fig. 3C12). Aldehyde dehydrogenase 18 family (Aldh18a1) and pyrroline-5-carboxylate reductase (Pycr), both regulators of l-proline synthesis, showed higher expression in TF (Fig. 3C15‒18), leading to the accumulation of l-proline.
This comprehensive analysis unveils a unique metabolic adaptation in liver metastasis of AML mice, highlighting a strategic shift in arginine metabolism towards the creatine pathway.
3.5. Metabolic reprogramming in AML primary cells
We extended our investigation to clinical samples, aiming to confirm the role of metabolic reprogramming in AML pathogenesis. BMNCs were collected from six AML patients (AML group) and CD34+ BMNCs were obtained from ten non-leukemia patients (Ctrl group, combined into 5 samples). 835 differential proteins between Ctrl and AML group were identified using 4D-DIA based proteomics, then integrated with 1433 overlapping differential proteins from AML mice in Fig. 2H, resulting in the identification of 145 common differential proteins (Fig. 4A). Subsequent KEGG pathway analysis of these 145 differential proteins revealed significant enrichment in specific categories, especially energy metabolism and amino acid metabolism in metabolism part (Fig. 4B). Consistent with previous findings, key metabolic pathways such as the biosynthesis of amino acids, oxidative phosphorylation, glycolysis, and arginine biosynthesis were markedly enriched (Fig. 4C).
Figure 4.

Reprogrammed metabolism was verified in AML patient samples. (A) Venn diagram showing the 145 common differential proteins between two datasets: (1) CD34+ BMNCs from non-leukemia patients (Ctrl) vs BMNCs from AML patients (fold-change <0.7 or >1.5 and P-value of <0.05); (2) 1433 overlapping differential proteins from AML mice samples mentioned in Fig. 2H. (B) A summary of secondary classifications of significant KEGG pathway derived from common differential proteins in Fig. 4B. (C)The significant enriched metabolism part of KEGG pathways in Fig. 4B. (D) Targeted metabolomics validated important metabolites in the creatine pathway and its extended metabolic networks. Red font indicates an increase in metabolite levels in AML compared to Ctrl, blue signifies a decrease, and black denotes no change. Solid lines represent a direct relationship within the metabolic pathway, while dashed lines indicate that skip over some unrelated metabolites. (E1‒E11) A total of 11 metabolites were detected. The concentrations of phosphocreatine, l-arginine, creatinine, citrulline, proline, l-glutamate, glutamine, l-aspartic acid, ornithine, S-adenosylmethionine and creatine were shown by bar chart. For (A) to (C), with a sample size of n = 5–6, statistical analysis was conducted using the Student's t-test. For (D) to (E), with a sample size of n = 5 (Ctrl group) and n = 6 (AML group), 3 technical replicates, Student's t-test was employed for statistical evaluation. Error bars represent the mean ± SEM. Statistical significance is denoted as follows: ∗P < 0.05, ∗∗P < 0.01, ∗∗∗P < 0.001, ∗∗∗∗P < 0.0001.
To further validate the metabolites identified from AML mice and enhance the clinical relevance, we established a targeted metabolomics panel including 11 key metabolites (l-arginine, creatinine, citrulline, proline, l-glutamate, glutamine, l-aspartic acid, ornithine, S-adenosylmethionine and creatine), all of which play crucial roles in the metabolic pathways illustrated in Fig. 3 (Fig. 4D). Our results in AML BMNCs and Ctrl CD34+ BMNCs showed consistency with the mice model. Compared to the Ctrl group, the AML group showed significant increases in creatine, phosphocreatine, creatinine, l-arginine, and citrulline, but decreases in proline levels (Fig. 4E1‒11).
Our analysis provides a comprehensive validation of metabolic reprogramming in AML from animal model to primary AML samples and underscores the significance of altered creatine pathways in the pathophysiology of AML.
3.6. Mechanisms of enhanced creatine levels in tumor foci
The dynamic interaction between microenvironment cells and metastatic cancer cells appears to necessitate both the local biosynthesis and active transport of creatine into cancer cells42, 43, 44, so we hypothesized creatine accumulation in AML cells occurs in two ways: synthesis from arginine and glycine through Gatm and Gamt enzymes, or import via the creatine transporter Slc6a8 (Fig. 5A). To explore the role of creatine in AML mice, the creatine concentration was quantified by ELISA. The results demonstrated a significant increase in the plasma of AML mice compared to the healthy control (Fig. 5B). Further, an increase in creatine level was also detected within TF (Fig. 5C). Consistent with earlier research43,45,46, Ckb expression, which has been implicated in various cancers, showed an elevation in both plasma and TF of AML mice. This increase in Ckb was also supported by upregulation at the RNA level (Fig. 5D, E, G).
Figure 5.

Enhancement of the creatine pathway in liver metastasis of AML mice through biosynthetic and transport mechanisms. (A) Illustration of creatine accumulation in AML cells via two ways: synthesis from arginine and glycine through Gatm and Gamt enzymes and import via the creatine transporter Slc6a8. (B, C) The concentrations of creatine in plasma (B) and liver metastasis (C) of AML mice and healthy mice were quantified using ELISA. (D, E) Levels of creatine kinase B (Ckb) in plasma (D) and liver metastasis (E) of AML mice and healthy mice were quantified using ELISA. (F) Immunohistochemical analysis was conducted to compare the expression of Gatm, Gamt, and Slc6a8 between tumor foci and the peritumoral region. (G–I) Relative mRNA expression levels of Ckb (G), Gatm (H), and Slc6a8 (I) in the liver metastasis of AML mice and healthy mice were evaluated using qRT-PCR. PR, peritumoral region; TF, tumor foci; HC, healthy control. For (B) and (D), each having a sample size of n = 6, the Student's t-test was utilized for statistical analysis. For (C) and (E), with sample sizes ranging from n = 3–8, statistical evaluation was performed using one-way ANOVA. For (F), which included a minimum sample size of 5, the Student's t-test was applied for statistical analysis. For (G) to (I), where the sample size varied between n = 3–5, one-way ANOVA was employed for statistical evaluation. Error bars represent the mean ± SEM. Statistical significance is denoted as follows: ∗P < 0.05, ∗∗P < 0.01, ∗∗∗P < 0.001, ∗∗∗∗P < 0.0001.
The study revealed that the arginine transporter Slc7a1 was upregulated in TF, facilitating an increase in arginine availability despite a downregulation in arginine biosynthesis within tumor cells (Supporting Information Fig. S3A). Simultaneously, the transporter protein Slc6a9 for glycine, another substrate for creatine synthesis, was also upregulated in the TF (Fig. S3B). In addition, key enzymes GATM and GAMT were both upregulated at the protein level within TF, and the RNA expression GATM was elevated in TF (Fig. 5F and H). Lastly, the expression of the creatine transporter Slc6a8 was found to be upregulated at both protein and RNA levels within TF (Fig. 5F and I). These findings suggest a multifaceted role of creatine in tumor energetics, encompassing both synthesis and transport mechanisms that may be potential targets for therapeutic intervention.
3.7. Creatine promotes tumor proliferation and infiltration
To investigate the dependency of leukemic cells on creatine for proliferation, various myeloid cell lines categorized into subtypes M4 (C1498, MV4-11), and M5 (MOLM-13, THP-1) were subjected to media supplemented with 5 mmol/L creatine, 10 mmol/L ompenaclid or a combination of both, over timeframes of 12, 24, and 48 h. As an inhibitor of the creatine transporter Slc6a8, ompenaclid effectively reduces creatine uptake, leading to decreased levels of intracellular creatine phosphate and ATP, and promoting apoptosis in tumor cells44,47,48.
Our findings indicated distinct results among different cell lines. In the C1498, an increase in proliferation was observed after 12 h in the creatine group, while a significant decrease in proliferation was noted at 48 h in ompenaclid group (Fig. 6A). In contrast, the MOLM-13 showed reduced proliferation in ompenaclid group after 12 h, whereas an increase in proliferation was observed at 48 h in creatine group (Fig. 6B). The MV4-11 exhibited enhanced proliferation in creatine group at 12 h, with no decrease in proliferation noted in ompenaclid group (Fig. 6C). Lastly, the THP-1 line exhibited a decrease in proliferation 24 h after the addition of ompenaclid, with no subsequent increase noted (Fig. 6D).
Figure 6.

Creatine promotes proliferation and infiltration of AML cells in vitro and in vivo. (A–D) Evaluation of cell proliferation in AML cell lines treated with either 5 mmol/L creatine, 10 mmol/L ompenaclid, or a combination of 5 mmol/L creatine and 10 mmol/L ompenaclid over durations of 12, 24, and 48 h, utilizing the CCK8 assay. (E) Representative in vivo imaging system (IVIS) luciferase images depicting AML mice administered with PBS (control group), 85 mg/mL creatine (Creatine group), or 130 mg/mL ompenaclid (Ompenaclid group) water, 200 μL via oral gavage three times per week. (F) The bar chart shows the total flux of AML mice in different groups. For (A) to (D), the sample size n = 6, two-way ANOVA was employed for statistical evaluation. For (E) and (F), with sample sizes n = 4, statistical evaluation was performed using one-way ANOVA. Error bars represent the mean ± SEM. Statistical significance is denoted as follows: ∗P < 0.05, ∗∗P < 0.01, ∗∗∗P < 0.001, ∗∗∗∗P < 0.0001.
To elucidate the impact of creatine on tumor metastasis in vivo, we employed an AML mice model injected with C1498-Luc/GFP cells. The AML mice were divided into control, creatine, and ompenaclid groups. IVIS image revealed a marked increase in metastatic dissemination when mice were supplemented with creatine compared to the control group. In contrast, mice treated with ompenaclid exhibited fewer metastasis (Fig. 6E). Notably, statistical analysis of fluorescence signal values confirmed a significant increase in metastasis in the creatine group alone compared to the control group, while the ompenaclid-treated mice showed a slight downregulation but not significant difference compared to the control group (Fig. 6F). In this study, the administration of ompenaclid under experimental conditions showed no toxic side effects, as evaluated by weight loss, body temperature changes, and hematological indices, suggesting a favorable safety (Supporting Information Fig. S4A‒S4C).
In all, our study demonstrated a clear dependency of leukemic cell lines on creatine for proliferation which can be blocked by ompenaclid. The AML mice model showed that creatine enhances metastatic potential. These results highlight the role of creatine in leukemic cell growth and metastasis, suggesting potential therapeutic targets within the creatine pathway.
3.8. Creatine enhances oxidative phosphorylation and glycolysis of leukemia cells
To assess the dynamics of cellular energy metabolism in real-time, we employed the Seahorse XF-96 Mito Stress Test and Glycolysis Test assays to measure two pivotal parameters: the extracellular acidification rate and the oxygen consumption rate.
In this study, C1498 and THP-1 cell lines were treated with 5 mmol/L creatine or 10 mmol/L ompenaclid to assess the influence of creatine on cellular energetics. Our findings demonstrate that creatine significantly increased levels of OCR, specifically, ATP production, maximal respiration, basal respiration, and spare respiratory capacity in THP-1, and ompenaclid inhibits the above changes except for spare respiratory capacity (Fig. 7A and C). Maximal respiration and spare respiratory capacity were found elevated in C1498, while ompenaclid showed no difference (Fig. 7B and D). ECAR was also found to be upregulated in compensatory glycolysis by creatine while inhibited by ompenaclid in THP-1 (Fig. 7E and G). Compensatory glycolysis was found to be downregulated in C1498 by ompenaclid, while creatine exhibited no changes (Fig. 7F and H).
Figure 7.

Creatine plays a pivotal role in enhancing both oxidative phosphorylation and glycolysis in leukemia cells. (A–H) C1498 and THP-1 were treated with either 5 mmol/L creatine, 10 mmol/L ompenaclid in media containing 1% FBS for 24 h in advance, then oxygen consumption rate (OCR) (A–D) and extracellular acidification rate (ECAR) (E–H) were detected using a Seahorse XF-96 Extracellular Flux Analyzer. Oligomycin (oligo) is a complex V inhibitor, fluoro-carbonyl cyanide phenylhydrazone (FCCP) is an uncoupling agent, and rotenone and antimycin A are complex I and complex III inhibitors, respectively. 2-DG is a competitive hexokinase inhibitor.
These findings underscore the role of creatine as an essential regulator of energy metabolism, capable of enhancing both OXPHOS and glycolysis in leukemic cells. Given that AML cells heavily rely on OXPHOS to meet their energy demands, these results highlight the potential of targeting creatine and its transporter Slc6a8 in leukemia therapy.
4. Discussion
Tumor cells possess the capability to modify their metabolic pathways to enhance the synthesis of critical energy substrates, such as amino acids, nucleotides, glycolytic intermediates, vitamins, and lipids. This metabolic reprogramming is instrumental in supporting their rapid proliferation and invasion capabilities49,50.
Recent advancements in spatial metabolomics have revolutionized our understanding of tumor and tumor microenvironment27,28,32. In our study, we employed AFADESI-MSI for high-sensitivity imaging of liver metastases of AML mice. This technique enabled us to accurately map the spatial distribution of over 4000 ions, which was consistent with preceding studies30,32,35,38,51,52. Our investigation identified 100 differential metabolites predominantly involved in cancer-associated amino acids, lipids, and carbohydrate metabolism, marking significant metabolic reprogramming of AML cells and tumor microenvironment cells. However, compared to spatial metabolomics, untargeted metabolomics identified fewer differential metabolites, primarily due to contamination of the peritumoral region with tumor cells during the physical tissue separation due to using scissors. Additionally, MSI avoids the need for tissue homogenization and metabolite extraction, thus preserving unstable metabolites that may otherwise degrade. It also eliminates the chromatographic separation required in untargeted metabolomics, facilitating the enhanced detection of highly polar metabolites that some chromatographic techniques may fail to retain. These highlight the advantage of MSI, particularly in studying small, diffuse tumor metastases.
Recent studies have illuminated the significant impact of arginine on cancer's metabolic pathways, revealing its promotion of processes crucial for tumor development22,33,53. In our research, we noted an elevation of arginine levels within tumor foci, which was further validated by clinical samples. However, a reduction was observed in the expression of enzymes responsible for arginine synthesis, specifically Ass1 and Asl. This paradox suggests a compensatory upregulation of arginine through the arginine transporter Slc7a1, a mechanism corroborated by previous studies 53, 54, 55. Additionally, we noted a reduced conversion of arginine into polyamines and the urea cycle supported by a decrease of enzymes involved: Arg1 and Otc.
We also observed a significant shift towards creatine synthesis. Key enzymes of the creatine pathway Gatm, Gamt, Ckb, and creatine itself were found to be increased significantly. The rising of creatinine and P-creatine were verified by AML BMMCs samples. These results collectively underscore a metabolic reprogramming bias towards creatine, suggesting an adaptive strategic shift that might play a pivotal role in facilitating tumor metastasis. So, our following research specifically targets the creatine metabolic pathway.
Creatine is synthesized from arginine and glycine as part of amino acid metabolism and is traditionally recognized for its crucial role in energy metabolism and muscle physiology56, 57, 58, 59. However, recent advances have unveiled its complex role in oncology, particularly highlighting how creatine biosynthesis contributes to tumor growth, survival, and maintenance of stem cell-like phenotypes44,48,60,61. Notably, the creatine kinase pathway has been identified as a metabolic vulnerability in EVI1-positive AML through the GSK3 and WNT signaling pathways45,46. This vulnerability has prompted the development of a selective covalent creatine kinase inhibitor aimed at inhibiting growth and inducing cytotoxicity in AML cells 43. Furthermore, FLT3-ITD mutations have been shown to upregulate GATM-mediated creatine biosynthesis, and pharmacological inhibition reduces the transcriptional expression of genes involved62. Despite these findings, the therapeutic implications of targeting the creatine pathway in AML are limited to specific genes and enzymes, which showed limited efficacy and were confined to preclinical study stages involving animal and cell models. This highlights the need to further explore novel targets within this pathway and consider repurposing clinically established drugs to enhance treatment strategies.
Our findings remain consistent with recent studies44,48,60,61, with elevated levels of both creatine and creatine kinase in the plasma and tumor foci of AML mice. Additionally, we found a significant upregulation of the creatine transporter Slc6a8. The previous study demonstrated that colorectal cancer cells import phosphocreatine via Slc6a8, utilizing it to support metastatic survival48. Previous studies have focused on inhibition of the enzyme Ckb or specific gene mutations, therefore, we believe inhibition of the creatine transporter Slc6a8 is very promising in AML treatment43,62. Our study primarily focused on the verification of supplementing creatine and inhibiting Slc6a8 in mice models.
Orally administered creatine in AML mice showed enhanced infiltration through in vivo imaging techniques. In vitro studies have shown that creatine supplementation enhances proliferation in AML cell lines. Lastly, leukemia cells exploited creatine to enhance both oxidative phosphorylation and glycolysis, showcasing high ATP demand. Such a mechanism is especially crucial for leukemia cells, as it caters to their accelerated metabolic demands necessitated by rapid proliferation and growth.
Ompenaclid is an oral small-molecule inhibitor targeting the Slc6a8 transporter, exhibiting substantial efficacy in inhibiting creatine import across different models48. Given its impact, ompenaclid presents a promising avenue for investigation within oncological and Duchenne muscular dystrophy research domains44,48,63. Our data indicated that while ompenaclid mitigated creatine-driven enhancements in infiltration and proliferation, its impact on reducing infiltration was modest and did not significantly prolong the lifespan of AML mice. This suggests that targeting metabolic pathways may serve best as a supplementary approach to leukemia therapy, especially for inhibition of metastasis, necessitating integration with existing chemotherapy or cell therapy strategies.
Our study acknowledges several limitations. Firstly, we also observed significant changes in lipid metabolism and polyamine synthesis. Given their crucial roles in supporting the rapid growth and proliferation of cancer cells as previously reported, these pathways are worth further exploration22, 23, 24, 25,64. Secondly, the sample size from patients used for validation was not representative enough, and multi-omics studies with larger clinical samples are recommended for future studies. Lastly, the molecular mechanism of creatine on AML cells worth to be further exploring in the next step, approaches such as thermal proteome profiling, LiP-small molecule mapping, or in situ synthesis membrane-protein affinity chromatography may be further applied to systematically detect protein targets of creatine and their interactions65, 66, 67.
5. Conclusions
Our investigation elucidates critical metabolic reprogramming in liver metastases of AML mice, with emphasis on the creatine pathway. These alterations support the proliferation of metastatic leukemia cells, shedding light on innovative therapeutic prospects. Inhibition of the creatine transporter Slc6a8 presents a strategy to disrupt leukemia cells’ energy homeostasis, which may significantly impede their metastatic spread. This approach heralds a promising direction for the development of adjunctive treatments of AML by potentially introducing novel pathways for therapeutic intervention.
Author contributions
Yucheng Bao: Writing – original draft, Visualization, Validation, Software, Methodology, Investigation, Formal analysis, Data curation, Conceptualization. Jing Qiao: Validation, Methodology, Data curation. Wenjie Gong: Methodology, Data curation. Ruihong Zhang: Validation, Methodology. Yanting Zhou: Visualization, Validation. Yinyin Xie: Validation. Yuan Xie: Validation. Jiuming He: Writing – review & editing, Validation, Supervision, Software, Methodology. Tong Yin: Writing – review & editing, Validation, Supervision, Resources, Project administration, Investigation, Funding acquisition, Formal analysis, Data curation, Conceptualization.
Conflicts of interest
The authors declare no conflicts of interest.
Acknowledgments
This research was supported by the National Natural Science Foundation of China (No. 81770124), and the Shanghai Municipal Education Commission-Gaofeng Clinical Medicine Grant Support (RC20210190, China).
Footnotes
Peer review under the responsibility of Chinese Pharmaceutical Association and Institute of Materia Medica, Chinese Academy of Medical Sciences.
Supporting information to this article can be found online at https://doi.org/10.1016/j.apsb.2024.07.004.
Contributor Information
Jiuming He, Email: hejiuming@imm.ac.cn.
Tong Yin, Email: yintong0101@163.com.
Appendix A. Supporting information
The following is the Supporting information to this article:
References
- 1.Papaemmanuil E., Gerstung M., Bullinger L., Gaidzik V.I., Paschka P., Roberts N.D., et al. Genomic classification and prognosis in acute myeloid leukemia. N Engl J Med. 2016;374:2209–2221. doi: 10.1056/NEJMoa1516192. [DOI] [PMC free article] [PubMed] [Google Scholar]
- 2.Döhner H., Weisdorf D.J., Bloomfield C.D. Acute myeloid leukemia. N Engl J Med. 2015;373:1136–1152. doi: 10.1056/NEJMra1406184. [DOI] [PubMed] [Google Scholar]
- 3.Society A.C. Key statistics for acute myeloid leukemia (aml) 2024. https://www.cancer.org/cancer/types/acute-myeloid-leukemia/about/key-statistics.html Available from:
- 4.Shimony S., Stahl M., Stone R.M. Acute myeloid leukemia: 2023 update on diagnosis, risk-stratification, and management. Am J Hematol. 2023;98:502–526. doi: 10.1002/ajh.26822. [DOI] [PubMed] [Google Scholar]
- 5.Facts SCS. Cancer stat facts: Leukemia — acute myeloid leukemia (aml). Available from: https://seer.cancer.gov/statfacts/html/amyl.html.
- 6.Murakami J., Shimizu Y. Hepatic manifestations in hematological disorders. Int J Hepatol. 2013;2013 doi: 10.1155/2013/484903. [DOI] [PMC free article] [PubMed] [Google Scholar]
- 7.Viadana E., Bross I.D., Pickren J.W. An autopsy study of the metastatic patterns of human leukemias. Oncology. 1978;35:87–96. doi: 10.1159/000225262. [DOI] [PubMed] [Google Scholar]
- 8.Ye H., Minhajuddin M., Krug A., Pei S., Chou C.H., Culp-Hill R., et al. The hepatic microenvironment uniquely protects leukemia cells through induction of growth and survival pathways mediated by lipg. Cancer Discov. 2021;11:500–519. doi: 10.1158/2159-8290.CD-20-0318. [DOI] [PMC free article] [PubMed] [Google Scholar]
- 9.Zuber J., Radtke I., Pardee T.S., Zhao Z., Rappaport A.R., Luo W., et al. Mouse models of human aml accurately predict chemotherapy response. Genes Dev. 2009;23:877–889. doi: 10.1101/gad.1771409. [DOI] [PMC free article] [PubMed] [Google Scholar]
- 10.Lu R., Wang P., Parton T., Zhou Y., Chrysovergis K., Rockowitz S., et al. Epigenetic perturbations by arg882-mutated dnmt3a potentiate aberrant stem cell gene-expression program and acute leukemia development. Cancer Cell. 2016;30:92–107. doi: 10.1016/j.ccell.2016.05.008. [DOI] [PMC free article] [PubMed] [Google Scholar]
- 11.Sanchez P.V., Perry R.L., Sarry J.E., Perl A.E., Murphy K., Swider C.R., et al. A robust xenotransplantation model for acute myeloid leukemia. Leukemia. 2009;23:2109–2117. doi: 10.1038/leu.2009.143. [DOI] [PMC free article] [PubMed] [Google Scholar]
- 12.Xiao P., Sandhow L., Heshmati Y., Kondo M., Bouderlique T., Dolinska M., et al. Distinct roles of mesenchymal stem and progenitor cells during the development of acute myeloid leukemia in mice. Blood Adv. 2018;2:1480–1494. doi: 10.1182/bloodadvances.2017013870. [DOI] [PMC free article] [PubMed] [Google Scholar]
- 13.Mopin A., Driss V., Brinster C. A detailed protocol for characterizing the murine c1498 cell line and its associated leukemia mouse model. J Vis Exp. 2016;116 doi: 10.3791/54270. [DOI] [PMC free article] [PubMed] [Google Scholar]
- 14.Hanahan D. Hallmarks of cancer: new dimensions. Cancer Discov. 2022;12:31–46. doi: 10.1158/2159-8290.CD-21-1059. [DOI] [PubMed] [Google Scholar]
- 15.Egan G., Schimmer A.D. Contribution of metabolic abnormalities to acute myeloid leukemia pathogenesis. Trends Cell Biol. 2023;33:455–462. doi: 10.1016/j.tcb.2022.11.004. [DOI] [PubMed] [Google Scholar]
- 16.Mishra S.K., Millman S.E., Zhang L. Metabolism in acute myeloid leukemia: mechanistic insights and therapeutic targets. Blood. 2023;141:1119–1135. doi: 10.1182/blood.2022018092. [DOI] [PMC free article] [PubMed] [Google Scholar]
- 17.Cole A., Wang Z., Coyaud E., Voisin V., Gronda M., Jitkova Y., et al. Inhibition of the mitochondrial protease clpp as a therapeutic strategy for human acute myeloid leukemia. Cancer Cell. 2015;27:864–876. doi: 10.1016/j.ccell.2015.05.004. [DOI] [PMC free article] [PubMed] [Google Scholar]
- 18.de Beauchamp L., Himonas E., Helgason G.V. Mitochondrial metabolism as a potential therapeutic target in myeloid leukaemia. Leukemia. 2022;36:1–12. doi: 10.1038/s41375-021-01416-w. [DOI] [PMC free article] [PubMed] [Google Scholar]
- 19.Panina S.B., Pei J., Kirienko N.V. Mitochondrial metabolism as a target for acute myeloid leukemia treatment. Cancer Metab. 2021;9:17. doi: 10.1186/s40170-021-00253-w. [DOI] [PMC free article] [PubMed] [Google Scholar]
- 20.Stuani L., Sabatier M., Sarry J.E. Exploiting metabolic vulnerabilities for personalized therapy in acute myeloid leukemia. BMC Biol. 2019;17:57. doi: 10.1186/s12915-019-0670-4. [DOI] [PMC free article] [PubMed] [Google Scholar]
- 21.Lo Presti C., Fauvelle F., Jacob M.C., Mondet J., Mossuz P. The metabolic reprogramming in acute myeloid leukemia patients depends on their genotype and is a prognostic marker. Blood Adv. 2021;5:156–166. doi: 10.1182/bloodadvances.2020002981. [DOI] [PMC free article] [PubMed] [Google Scholar]
- 22.Lieu E.L., Nguyen T., Rhyne S., Kim J. Amino acids in cancer. Exp Mol Med. 2020;52:15–30. doi: 10.1038/s12276-020-0375-3. [DOI] [PMC free article] [PubMed] [Google Scholar]
- 23.Vettore L., Westbrook R.L., Tennant D.A. New aspects of amino acid metabolism in cancer. Br J Cancer. 2020;122:150–156. doi: 10.1038/s41416-019-0620-5. [DOI] [PMC free article] [PubMed] [Google Scholar]
- 24.Tabe Y., Lorenzi P.L., Konopleva M. Amino acid metabolism in hematologic malignancies and the era of targeted therapy. Blood. 2019;134:1014–1023. doi: 10.1182/blood.2019001034. [DOI] [PMC free article] [PubMed] [Google Scholar]
- 25.Nair R., Salinas-Illarena A., Baldauf H.-M. New strategies to treat aml: novel insights into aml survival pathways and combination therapies. Leukemia. 2021;35:299–311. doi: 10.1038/s41375-020-01069-1. [DOI] [PubMed] [Google Scholar]
- 26.Chen Y., Chen J., Zou Z., Xu L., Li J. Crosstalk between autophagy and metabolism: implications for cell survival in acute myeloid leukemia. Cell Death Discov. 2024;10:46. doi: 10.1038/s41420-024-01823-9. [DOI] [PMC free article] [PubMed] [Google Scholar]
- 27.Hu T., Allam M., Cai S., Henderson W., Yueh B., Garipcan A., et al. Single-cell spatial metabolomics with cell-type specific protein profiling for tissue systems biology. Nat Commun. 2023;14:8260. doi: 10.1038/s41467-023-43917-5. [DOI] [PMC free article] [PubMed] [Google Scholar]
- 28.Alexandrov T. Spatial metabolomics: from a niche field towards a driver of innovation. Nat Metab. 2023;5:1443–1445. doi: 10.1038/s42255-023-00881-0. [DOI] [PubMed] [Google Scholar]
- 29.Guo S., Li K., Chen Y., Li B. Unraveling the drug distribution in brain enabled by maldi ms imaging with laser-assisted chemical transfer. Acta Pharm Sin B. 2022;12:2120–2126. doi: 10.1016/j.apsb.2021.11.007. [DOI] [PMC free article] [PubMed] [Google Scholar]
- 30.Jin B., Pang X., Zang Q., Ga M., Xu J., Luo Z., et al. Spatiotemporally resolved metabolomics and isotope tracing reveal cns drug targets. Acta Pharm Sin B. 2023;13:1699–1710. doi: 10.1016/j.apsb.2022.11.011. [DOI] [PMC free article] [PubMed] [Google Scholar]
- 31.Zhou Y., Jiang X., Wang X., Huang J., Li T., Jin H., et al. Promise of spatially resolved omics for tumor research. J Pharm Anal. 2023;13:851–861. doi: 10.1016/j.jpha.2023.07.003. [DOI] [PMC free article] [PubMed] [Google Scholar]
- 32.Sun C., Li T., Song X., Huang L., Zang Q., Xu J., et al. Spatially resolved metabolomics to discover tumor-associated metabolic alterations. Proc Natl Acad Sci U S A. 2019;116:52–57. doi: 10.1073/pnas.1808950116. [DOI] [PMC free article] [PubMed] [Google Scholar]
- 33.Wang X., Zhang J., Zheng K., Du Q., Wang G., Huang J., et al. Discovering metabolic vulnerability using spatially resolved metabolomics for antitumor small molecule-drug conjugates development as a precise cancer therapy strategy. J Pharm Anal. 2023;13:776–787. doi: 10.1016/j.jpha.2023.02.010. [DOI] [PMC free article] [PubMed] [Google Scholar]
- 34.Ravi V.M., Will P., Kueckelhaus J., Sun N., Joseph K., Salié H., et al. Spatially resolved multi-omics deciphers bidirectional tumor-host interdependence in glioblastoma. Cancer Cell. 2022;40:639–655.e13. doi: 10.1016/j.ccell.2022.05.009. [DOI] [PubMed] [Google Scholar]
- 35.Sun C., Wang A., Zhou Y., Chen P., Wang X., Huang J., et al. Spatially resolved multi-omics highlights cell-specific metabolic remodeling and interactions in gastric cancer. Nat Commun. 2023;14:2692. doi: 10.1038/s41467-023-38360-5. [DOI] [PMC free article] [PubMed] [Google Scholar]
- 36.Hu Q., Sun W., Wang J., Ruan H., Zhang X., Ye Y., et al. Conjugation of haematopoietic stem cells and platelets decorated with anti-PD-1 antibodies augments anti-leukaemia efficacy. Nat Biomed Eng. 2018;2:831–840. doi: 10.1038/s41551-018-0310-2. [DOI] [PMC free article] [PubMed] [Google Scholar]
- 37.Jayavelu A.K., Wolf S., Buettner F., Alexe G., Häupl B., Comoglio F., et al. The proteogenomic subtypes of acute myeloid leukemia. Cancer Cell. 2022;40:301–317.e12. doi: 10.1016/j.ccell.2022.02.006. [DOI] [PubMed] [Google Scholar]
- 38.Liu D., Huang J., Gao S., Jin H., He J. A temporo-spatial pharmacometabolomics method to characterize pharmacokinetics and pharmacodynamics in the brain microregions by using ambient mass spectrometry imaging. Acta Pharm Sin B. 2022;12:3341–3353. doi: 10.1016/j.apsb.2022.03.018. [DOI] [PMC free article] [PubMed] [Google Scholar]
- 39.He J., Huang L., Tian R., Li T., Sun C., Song X., et al. Massimager: a software for interactive and in-depth analysis of mass spectrometry imaging data. Anal Chim Acta. 2018;1015:50–57. doi: 10.1016/j.aca.2018.02.030. [DOI] [PubMed] [Google Scholar]
- 40.Qiao N., Lyu Y., Liu F., Zhang Y., Ma X., Lin X., et al. Cross-sectional network analysis of plasma proteins/metabolites correlated with pathogenesis and therapeutic response in acute promyelocytic leukemia. Front Med. 2024;18:327–343. doi: 10.1007/s11684-023-1022-x. [DOI] [PubMed] [Google Scholar]
- 41.Schmidt D.R., Patel R., Kirsch D.G., Lewis C.A., Vander Heiden M.G., Locasale J.W. Metabolomics in cancer research and emerging applications in clinical oncology. CA Cancer J Clin. 2021;71:333–358. doi: 10.3322/caac.21670. [DOI] [PMC free article] [PubMed] [Google Scholar]
- 42.Maguire O.A., Ackerman S.E., Szwed S.K., Maganti A.V., Marchildon F., Huang X., et al. Creatine-mediated crosstalk between adipocytes and cancer cells regulates obesity-driven breast cancer. Cell Metab. 2021;33:499–512.e6. doi: 10.1016/j.cmet.2021.01.018. [DOI] [PMC free article] [PubMed] [Google Scholar]
- 43.Darabedian N., Ji W., Fan M., Lin S., Seo H.S., Vinogradova E.V., et al. Depletion of creatine phosphagen energetics with a covalent creatine kinase inhibitor. Nat Chem Biol. 2023;19:815–824. doi: 10.1038/s41589-023-01273-x. [DOI] [PMC free article] [PubMed] [Google Scholar]
- 44.Li Q., Liu M., Sun Y., Jin T., Zhu P., Wan X., et al. Slc6a8-mediated intracellular creatine accumulation enhances hypoxic breast cancer cell survival via ameliorating oxidative stress. J Exp Clin Cancer Res. 2021;40:168. doi: 10.1186/s13046-021-01933-7. [DOI] [PMC free article] [PubMed] [Google Scholar]
- 45.Benajiba L., Alexe G., Su A., Raffoux E., Soulier J., Hemann M.T., et al. Creatine kinase pathway inhibition alters gsk3 and wnt signaling in evi1-positive aml. Leukemia. 2019;33:800–804. doi: 10.1038/s41375-018-0291-x. [DOI] [PMC free article] [PubMed] [Google Scholar]
- 46.Fenouille N., Bassil C.F., Ben-Sahra I., Benajiba L., Alexe G., Ramos A., et al. The creatine kinase pathway is a metabolic vulnerability in evi1-positive acute myeloid leukemia. Nat Med. 2017;23:301–313. doi: 10.1038/nm.4283. [DOI] [PMC free article] [PubMed] [Google Scholar]
- 47.Ji L., Zhao X., Zhang B., Kang L., Song W., Zhao B., et al. Slc6a8-mediated creatine uptake and accumulation reprogram macrophage polarization via regulating cytokine responses. Immunity. 2019;51:272–284.e7. doi: 10.1016/j.immuni.2019.06.007. [DOI] [PubMed] [Google Scholar]
- 48.Kurth I., Yamaguchi N., Andreu-Agullo C., Tian H.S., Sridhar S., Takeda S., et al. Therapeutic targeting of slc6a8 creatine transporter suppresses colon cancer progression and modulates human creatine levels. Sci Adv. 2021;7 doi: 10.1126/sciadv.abi7511. [DOI] [PMC free article] [PubMed] [Google Scholar]
- 49.Pavlova N.N., Thompson C.B. The emerging hallmarks of cancer metabolism. Cell Metab. 2016;23:27–47. doi: 10.1016/j.cmet.2015.12.006. [DOI] [PMC free article] [PubMed] [Google Scholar]
- 50.Pavlova N.N., Zhu J., Thompson C.B. The hallmarks of cancer metabolism: still emerging. Cell Metab. 2022;34:355–377. doi: 10.1016/j.cmet.2022.01.007. [DOI] [PMC free article] [PubMed] [Google Scholar]
- 51.Huang L., Mao X., Sun C., Li T., Song X., Li J., et al. Molecular pathological diagnosis of thyroid tumors using spatially resolved metabolomics. Molecules. 2022;27:1390. doi: 10.3390/molecules27041390. [DOI] [PMC free article] [PubMed] [Google Scholar]
- 52.He J., Sun C., Li T., Luo Z., Huang L., Song X., et al. A sensitive and wide coverage ambient mass spectrometry imaging method for functional metabolites based molecular histology. Adv Sci. 2018;5 doi: 10.1002/advs.201800250. [DOI] [PMC free article] [PubMed] [Google Scholar]
- 53.Mossmann D., Müller C., Park S., Ryback B., Colombi M., Ritter N., et al. Arginine reprograms metabolism in liver cancer via rbm39. Cell. 2023;186:5068–5083.e23. doi: 10.1016/j.cell.2023.09.011. [DOI] [PMC free article] [PubMed] [Google Scholar]
- 54.Chen C.L., Hsu S.C., Ann D.K., Yen Y., Kung H.J. Arginine signaling and cancer metabolism. Cancers. 2021;13:3541. doi: 10.3390/cancers13143541. [DOI] [PMC free article] [PubMed] [Google Scholar]
- 55.Werner A., Pieh D., Echchannaoui H., Rupp J., Rajalingam K., Theobald M., et al. Cationic amino acid transporter-1-mediated arginine uptake is essential for chronic lymphocytic leukemia cell proliferation and viability. Front Oncol. 2019;9:1268. doi: 10.3389/fonc.2019.01268. [DOI] [PMC free article] [PubMed] [Google Scholar]
- 56.Andrews R., Greenhaff P., Curtis S., Perry A., Cowley A.J. The effect of dietary creatine supplementation on skeletal muscle metabolism in congestive heart failure. Eur Heart J. 1998;19:617–622. doi: 10.1053/euhj.1997.0767. [DOI] [PubMed] [Google Scholar]
- 57.Bottomley P.A., Lee Y., Weiss R.G. Total creatine in muscle: imaging and quantification with proton mr spectroscopy. Radiology. 1997;204:403–410. doi: 10.1148/radiology.204.2.9240527. [DOI] [PubMed] [Google Scholar]
- 58.Wyss M., Kaddurah-Daouk R. Creatine and creatinine metabolism. Physiol Rev. 2000;80:1107–1213. doi: 10.1152/physrev.2000.80.3.1107. [DOI] [PubMed] [Google Scholar]
- 59.Kazak L., Cohen P. Creatine metabolism: energy homeostasis, immunity and cancer biology. Nat Rev Endocrinol. 2020;16:421–436. doi: 10.1038/s41574-020-0365-5. [DOI] [PubMed] [Google Scholar]
- 60.Zhang L., Zhu Z., Yan H., Wang W., Wu Z., Zhang F., et al. Creatine promotes cancer metastasis through activation of smad2/3. Cell Metab. 2021;33:1111–1123.e4. doi: 10.1016/j.cmet.2021.03.009. [DOI] [PubMed] [Google Scholar]
- 61.Rashidi A., Billingham L.K., Zolp A., Chia T.Y., Silvers C., Katz J.L., et al. Myeloid cell-derived creatine in the hypoxic niche promotes glioblastoma growth. Cell Metab. 2024;36:62–77.e8. doi: 10.1016/j.cmet.2023.11.013. [DOI] [PMC free article] [PubMed] [Google Scholar]
- 62.Zhang Y., Newsom K.J., Zhang M., Kelley J.S., Starostik P. Gatm-mediated creatine biosynthesis enables maintenance of flt3-itd-mutant acute myeloid leukemia. Mol Cancer Res. 2022;20:293–304. doi: 10.1158/1541-7786.MCR-21-0314. [DOI] [PubMed] [Google Scholar]
- 63.Creisméas A., Gazaille C., Bourdon A., Lafoux A., Allais M., Razavet V.L., et al. Dmd ‒animal models: Ep.89 trpc1 and trpc3 involvement in dmd physiopathology and as potential targets for treatment in complement to raav-microdystrophin. Neuromusc Disord. 2021;31 [Google Scholar]
- 64.Nisticò C., Chiarella E. An overview on lipid droplets accumulation as novel target for acute myeloid leukemia therapy. Biomedicines. 2023;11:3186. doi: 10.3390/biomedicines11123186. [DOI] [PMC free article] [PubMed] [Google Scholar]
- 65.Franken H., Mathieson T., Childs D., Sweetman G.M., Werner T., Tögel I., et al. Thermal proteome profiling for unbiased identification of direct and indirect drug targets using multiplexed quantitative mass spectrometry. Nat Protoc. 2015;10:1567–1593. doi: 10.1038/nprot.2015.101. [DOI] [PubMed] [Google Scholar]
- 66.Piazza I., Kochanowski K., Cappelletti V., Fuhrer T., Noor E., Sauer U., et al. A map of protein-metabolite interactions reveals principles of chemical communication. Cell. 2018;172:358–372.e23. doi: 10.1016/j.cell.2017.12.006. [DOI] [PubMed] [Google Scholar]
- 67.Gu Y., Wang R., Chen P., Li S., Chai X., Chen C., et al. In situ synthesis and unidirectional insertion of membrane proteins in liposome-immobilized silica stationary phase for rapid preparation of microaffinity chromatography. Acta Pharm Sin B. 2022;12:3682–3693. doi: 10.1016/j.apsb.2022.04.010. [DOI] [PMC free article] [PubMed] [Google Scholar]
Associated Data
This section collects any data citations, data availability statements, or supplementary materials included in this article.