

Abstract
Objectives:
Age is important for prognosis in community-onset pneumonia, but how it influences admission decisions in the emergency department (ED) is not well characterized. Using clinical data from the electronic health record in a national cohort, we examined pneumonia hospitalization patterns, variation, and relationships with mortality among older versus younger Veterans.
Methods:
In a retrospective cohort of patients ≥18 years presenting to EDs with a diagnosis of pneumonia at 118 VA Medical Centers 1/1/2006–12/31/2016, we compared observed, predicted, and residual hospitalization risk for Veterans < 70,70–79, ≥ 80 years of age using generalized estimating equations and machine learning models with 71 patient factors. We examined facility variation in residual hospitalization across facilities and explored whether facility differences in hospitalization risk correlated with differences in 30-day mortality.
Results:
Among 297,498 encounters, 165,003(55%) were for Veterans <70 years, 61,076(21%) 70–80, and 71,419(24%) >=80. Hospitalization rate was 52%, 67%, and 76%, respectively. After adjusting for other patient factors, age 70–79 had an odds ratio of 1.39(1.34,1.44) and ≥80 had an odds ratio of 2.1(2.0,2.2) compared to age <70. There was substantial variation in hospitalization across facilities among Veterans <70 (<35% hospitalization at the lowest decile of facilities versus >66% at the highest decile) that was similar but with higher risk for patients 70–79 years (54% versus 82%) and ≥80 years (59% versus 85%) and remained after accounting for patient factors, with no consistently positive or negative associations with facility-level 30-day mortality.
Conclusions:
Older Veterans with community-onset pneumonia experience high risk of hospitalization, with widespread facility variation that has no clear relationship to short-term mortality.
Keywords: Pneumonia, Emergency Department, Hospitalization, Older adult, Epidemiology
INTRODUCTION:
Pneumonia is the leading cause of death from infectious disease in the United States1 and a common cause of hospitalization. For the older patient, the consequences of pneumonia are even greater, due to both increased vulnerability to infection and end-organ complications2 3 4 as well as complications of treatment, including hospitalization.5 We previously identified reductions in hospitalizations and mortality for Veterans seeking care at VA Emergency Departments, but younger Veterans had greater reductions than older patients.6 The purpose of this study was to use clinical data from the electronic health record (EHR) to:
Describe the risk of hospitalization for older compared to younger patients in a cohort of Veterans presenting with pneumonia to 118 Veterans Affairs (VA) Emergency Departments (EDs).
Examine facility variation in hospitalization risk and associations between facility-level hospitalization and mortality among older Veterans compared to younger Veterans.
METHODS:
Setting:
The VA network is the largest integrated healthcare network in the United States, serving nearly 8.5 million Veterans at more than 1700 clinics, 152 VA Medical Centers (VAMCs), and 21 regional VA Integrated Service Networks (VISNs) with over 500,000 hospitalizations annually.7 All VA emergency departments have access to radiology, laboratory, and the ability to hospitalize patients to acute care beds at an adjoined VA hospital, with over 1M visits per year. All health care settings in the VA share the same EHR, Veterans Health Information Systems and Technology Architecture (VistA). Data were accessed from VistA through the Veterans Informatics and Computing Infrastructure, a computing environment that stores clinical data for research purposes.8 The research was approved by VA and University of Utah Institutional Review Boards.
Participants:
We identified all patient encounters at VA EDs from 1 January 2006 to 31 December 2016 that underwent chest imaging, including chest X-rays or computerized tomography (CT) scans within 24 hours before and after the encounter time. To ensure that the patient was evaluated by a clinician, we required at least one clinical document to be signed by a physician, nurse practitioner, or physician assistant associated with the ED visit. To capture new diagnoses, we included only the first encounter with chest imaging for a given patient within a 3-month period. Pneumonia diagnoses were identified based upon established diagnostic codes assigned in the ED, 9,10 or the clinical diagnosis of pneumonia within the assessment and plan section of the ED physician document identified by natural language processing (NLP), developed and used in previous work.11
Measurements
Hospitalization and mortality
We defined a hospitalization as any admission to an acute medical, surgical, or intensive care unit (ICU), with either an inpatient or observation status, that occurred within 24 hours of the ED encounter. We identified deaths from any cause that occurred within 30, 90, and 365 days from the initial encounter using the VA Vital Status file.
Patient Characteristics contributing to illness severity, and hospitalization and mortality risk models
To characterize patient illness severity, risk of hospital admission, and risk of death, we extracted baseline patient characteristics (age, gender, marital status, nursing home residence, previous hospitalization in 90 days, and 38 comorbid conditions) as well as acute physiologic variables (vital signs, pulse oximetry, oxygen supplementation, and 21 laboratory values). To define comorbidities, we extracted all International Classification of Disease (ICD) 9-CM12 and ICD-10-CM13 codes given to each patient within the year prior to the ED encounter and classified them according to categories developed by the Agency for Healthcare Research and Quality 14. In addition to medical comorbidities traditionally viewed as risk factors for pneumonia mortality and hospitalization such as heart and lung disease, we also included psychosocial comorbidities including psychiatric diseases, substance use, and homelessness.
We extracted the first vital sign (respiratory rate, heart rate, systolic blood pressure, diastolic blood pressure, pulse oximetry) recorded between 6 hours before and 12 hours after the initial encounter time. We extracted the first laboratory result within 6 hours before and 12 hours after the initial encounter time, and included laboratory values previously proposed to predict pneumonia or sepsis severity, 15–18 19 including albumin, bilirubin, blood urea nitrogen, creatinine, C-reactive peptide, glucose, hematocrit, lactic acid, arterial pH, PaO2, PaCO2, serum bicarbonate, platelet count, potassium, sodium, troponin, white blood cell count, brain natriuretic peptide, erythrocyte sedimentation rate (ESR), and liver transaminases. All patient characteristics are listed in Table 1.
Table 1. Patient characteristics overall and for Veterans age <70, 70–79, and ≥80 years.
All variables used for risk modeling are shown. Frequencies in percent (confidence intervals) and median values (interquartile range) are shown.
| % missing | All patients: N=297498 | Age <70: N=165,003 | Age 70–80: N=61076 | Age>=80: N=71419 | |
|---|---|---|---|---|---|
|
| |||||
| Demographics | |||||
| Age | 0 | 68 (60, 79) | 61 (54, 65) | 74 (72, 77) | 85 (82, 89) |
| Gender | 0 | 95.3 (95.2–95.3)% | 92.9 (92.8–93.1)% | 98.3(98.2–98.4)% | 98(97.9–98.1)% |
| Married | 0 | 44.9(44.8–45.1)% | 1.6(41.3–41.8)% | 51.3(50.9–51.7)% | 47.3(47–47.7)% |
| Homelessness | 0 | 5.6(5.5–5.7)% | 8.2(8.1–8.3)% | 2.8(2.7–2.9)% | 2.1(2–2.2)% |
| Nursing Home Resident | 0 | 1.6(1.5–1.6)% | 1.2(1.2–1.3)% | 1.8(1.6–1.9)% | 2.2(2.1–2.3)% |
| Prior hospitalization within 90 days | 0 | 10.2(10.1–10.4)% | 9.3(9.1–9.4)% | 11.9(11.6–12.1)% | 11.1(10.9–11.4)% |
| Comorbidities * | |||||
| Acquired Immunodeficiency Syndrome | 0 | 1.4(1.4–1.5)% | 2.4(2.3–2.4)% | 0.5(0.4–0.5)% | 0.1(0.1–0.1)% |
| Alcohol Use Disorders | 0 | 6.8(6.7–6.9)% | 10.4(10.2–10.5)% | 3.6(3.4–3.7)% | 1.2(1.1–1.2)% |
| Anxiety | 0 | 20(19.9–20.1)% | 26.1(25.9–26.3)% | 14(13.7–14.3)% | 10.9(10.7–11.2)% |
| Asthma | 0 | 5.5(5.4–5.6)% | 6.5(6.4–6.6)% | 4.6(4.4–4.8)% | 3.9(3.8–4)% |
| Autoimmune Disorders | 0 | 2.2(2.1–2.2)% | 2(1.9–2)% | 2.7(2.5–2.8)% | 2.2(2.1–2.3)% |
| Bipolar Disorder | 0 | 4.3(4.2–4.4)% | 6.2(6.1–6.3)% | 2.7(2.6–2.8)% | 1.4(1.3–1.4)% |
| Bronchiectasis | 0 | 0.3(0.3–0.3)% | 0.2(0.2–0.3)% | 0.5(0.4–0.5)% | 0.4(0.3–0.4)% |
| Cancer - metastatic | 0 | 2.8(2.7–2.8)% | 2.8(2.8–2.9)% | 3.4(3.3–3.6)% | 2(1.9–2.1)% |
| Cancer - non-metastatic | 0 | 18.9(18.8–19.1)% | 14.7(14.5–14.8)% | 25.4(25–25.7)% | 23.3(23–23.6)% |
| Cardiac Dysrhythmias | 0 | 3.4(3.3–3.4)% | 2(2–2.1)% | 4(3.9–4.2)% | 5.8(5.7–6)% |
| Cerebrovascular Disease | 0 | 11.8(11.7–12)% | 7.5(7.4–7.7)% | 15.6(15.3–15.9)% | 18.6(18.3–18.9)% |
| Chronic Obstructive Pulmonary Disease | 0 | 39.3(39.1–39.5)% | 35(34.8–35.3)% | 49.4(49–49.8)% | 40.5(40.1–40.8)% |
| Chronic Pulmonary Disease | 0 | 42.3(42.2–42.5)% | 38.8(38.6–39.1)% | 51.6(51.2–52)% | 42.6(42.2–43)% |
| Congestive Heart Failure | 0 | 16.9(16.7–17)% | 11.3(11.1–11.4)% | 21.3(20.9–21.6)% | 26(25.7–26.3)% |
| Coronary Artery Disease | 0 | 22.4(22.3–22.6)% | 14.8(14.6–14.9)% | 28.2(27.8–28.5)% | 35.2(34.8–35.5)% |
| Delirium Disorders | 0 | 10(9.9–10.1)% | 3.9(3.8–3.9)% | 10.3(10.1–10.6)% | 24.1(23.7–24.4)% |
| Dementia | 0 | 2.6(2.5–2.6)% | 0.6(0.6–0.6)% | 2.8(2.7–2.9)% | 7(6.8–7.2)% |
| Diabetes with complications | 0 | 10.5(10.4–10.6)% | 9.9(9.7–10)% | 13.3(13–13.6)% | 9.5(9.3–9.7)% |
| Diabetes without complications | 0 | 31(30.8–31.1)% | 28.9(28.7–29.2)% | 37.6(37.2–38)% | 30(29.7–30.3)% |
| Hemiplegia/paralysis | 0 | 1(0.9–1)% | 1(1–1.1)% | 1.1(1–1.2)% | 0.8(0.7–0.9)% |
| ILD | 0 | 0.6(0.6–0.7)% | 0.4(0.3–0.4)% | 0.9(0.9–1)% | 1.1(1–1.1)% |
| Liver Disease | 0 | 0.7(0.7–0.8)% | 1(1–1.1)% | 0.5(0.5–0.6)% | 0.2(0.2–0.2)% |
| Liver Disease without complications | 0 | 1.9(1.8–1.9)% | 2.7(2.6–2.7)% | 1.3(1.3–1.4)% | 0.5(0.4–0.6)% |
| Marijuana Use Disorders | 0 | 2.7(2.7–2.8)% | 4.7(4.6–4.8)% | 0.5(0.5–0.6)% | 0(0–0.1)% |
| Mood Disorders | 0 | 25.9(25.7–26)% | 32.1(31.9–32.3)% | 20.3(20–20.7)% | 16.3(16.1–16.6)% |
| Myocardial Infarction | 0 | 26(25.8–26.2)% | 18.8(18.6–19)% | 34.3(33.9–34.7)% | 35.6(35.2–35.9)% |
| Neutropenia | 0 | 0.6(0.6–0.6)% | 0.6(0.6–0.6)% | 0.7(0.6–0.8)% | 0.4(0.4–0.5)% |
| Opioid Overdose | 0 | 0(0–0.1)% | 0.1(0–0.1)% | 0(0–0)% | 0(0–0)% |
| Opioid Use Disorders | 0 | 2.1(2–2.1)% | 3.4(3.3–3.5)% | 0.6(0.6–0.7)% | 0.1(0.1–0.1)% |
| Osteoporosis | 0 | 0.4(0.3–0.4)% | 0.3(0.2–0.3)% | 0.4(0.3–0.4)% | 0.6(0.5–0.6)% |
| Pathological Fracture | 0 | 3.7(3.6–3.8)% | 2.8(2.7–2.9)% | 4.6(4.5–4.8)% | 5(4.8–5.2)% |
| Peptic Ulcer Disease | 0 | 1.6(1.5–1.6)% | 1.3(1.2–1.3)% | 1.8(1.7–1.9)% | 2(1.9–2.1)% |
| Peripheral Vascular Disease | 0 | 10.7(10.6–10.8)% | 6.8(6.7–7)% | 15.4(15.1–15.7)% | 15.5(15.3–15.8)% |
| Renal Disease | 0 | 13.3(13.2–13.5)% | 9.2(9.1–9.3)% | 16.3(16–16.5)% | 20.4(20.1–20.7)% |
| Schizophrenia or Psychosis | 0 | 5.7(5.6–5.8)% | 6.2(6–6.3)% | 4.7(4.5–4.8)% | 5.6(5.4–5.8)% |
| Solid Organ Transplant | 0 | 0.4(0.4–0.5)% | 0.5(0.4–0.5)% | 0.4(0.4–0.5)% | 0.4(0.4–0.5)% |
| Stem Cell Transplant | 0 | 0.1(0–0.1)% | 0.1(0.1–0.1)% | 0(0–0)% | 0 (0(0–0)% |
| Tobacco Use Disorders | 0 | 23.3(23.2–23.5)% | 31.3(31.1–31.5)% | 19.9(19.6–20.2)% | 7.9(7.7–8.1)% |
| Physiologic measures * | |||||
| Temperature (F) | 3.4 | 98.3 (97.7, 99.4) | 98.4 (97.7, 99.5) | 98.3 (97.6, 99.3) | 98.2 (97.6, 99.3) |
| Pulse (beats/min) | 2.8 | 90 (77, 104) | 93 (80, 107) | 89 (76, 103) | 85 (73, 99) |
| Respiration Rate (breaths/min) | 3.1 | 20 (18, 22) | 20 (18, 22) | 20 (18, 22) | 20 (18, 22) |
| Systolic Blood Pressure (mmHg) | 3 | 132 (117, 149) | 133 (118, 148) | 133 (116, 150) | 132 (115, 150) |
| Pulse Oximetry (% | 15.8 | 95 (92, 97) | 96 (93, 97) | 95 (92, 97) | 95 (92, 97) |
| Supplemental O2 | 0 | 11.3(11.2–11.4)% | 8.7(8.5–8.8)% | 14.3(14–14.5)% | 14.7(14.4–15)% |
| Arterial PaO2 (mmHg) | 81.5 | 66.5 (57, 80) | 65.7 (56, 78) | 66.8 (57, 80.3) | 68.1 (58, 83.4) |
| Arterial pH | 80.9 | 7.4 (7.4, 7.5) | 7.4 (7.4, 7.5) | 7.4 (7.4, 7.5) | 7.4 (7.4, 7.5) |
| Blood Urea Nitrogen (mg/dL) | 11.8 | 18 (13, 27) | 15 (11, 22) | 20 (15, 28) | 24 (18, 33) |
| Sodium (mmol/L) | 11.5 | 137 (134, 140) | 137 (134, 139) | 137 (135, 140) | 138 (135, 140) |
| Glucose (mg/dL) | 11.1 | 119 (101, 151) | 116 (99, 147) | 122 (103, 157) | 122 (104, 153) |
| Hematocrit (% | 10.6 | 39 (34.9, 42.8) | 40 (35.9, 43.6) | 38.7 (34.6, 42.4) | 37.4 (33.6, 41) |
| Albumin (g/L) | 33.3 | 3.5 (3.1, 3.9) | 3.6 (3.1, 4) | 3.5 (3.1, 3.9) | 3.4 (3, 3.8) |
| Alanine Aminotransferase (IU/L) | 33.2 | 22 (16, 34) | 25 (17, 38) | 21 (15, 31) | 19 (14, 28) |
| Aspartate Aminotransferase (IU/L) | 34.3 | 25 (19, 36) | 26 (19, 38) | 24 (18, 33) | 24 (18, 33) |
| Bilirubin (mg/dL) | 32.9 | 0.7 (0.5, 1) | 0.7 (0.5, 1) | 0.7 (0.5, 1) | 0.7 (0.5, 1) |
| Brain Natriuretic Peptide (pg/ml) | 64.8 | 221.2 (72, 722) | 134 (42.3, 495) | 236 (85.2, 747.8) | 377.2 (148, 1059) |
| Bicarbonate (mEg/L) | 11.6 | 26 (23.6, 28) | 26 (24, 28) | 26 (24, 29) | 26 (23, 28) |
| Creatinine (mg/dL) | 11.4 | 1.1 (0.9, 1.4) | 1 (0.8, 1.3) | 1.1 (0.9, 1.5) | 1.3 (1, 1.7) |
| C-reactive Peptide (mg/dL) | 97.4 | 42.2 (14, 132.8) | 40.4 (13, 133) | 47 (16.3, 141) | 41.7 (15, 125.4) |
| Erythrocyte Sedimentation Rate (mm/hr) | 96.6 | 46 (22, 80) | 45 (20, 80) | 49 (25, 81) | 46 (25, 78) |
| Lactic Acid (mmol/L) | 81.4 | 1.6 (1.1, 2.3) | 1.5 (1.1, 2.2) | 1.6 (1.1, 2.3) | 1.7 (1.2, 2.4) |
| Arterial PaCO2 (mmHg) | 80.9 | 38.7 (33, 46.6) | 39 (33, 47.1) | 39 (33.3, 47.2) | 38 (32.9, 44.9) |
| Platelet Count (K/uL | 11.6 | 217 (169, 279) | 225 (176, 288) | 214 (167, 276) | 204 (160, 261) |
| Potassium (mmol/L) | 11.6 | 4.1 (3.7, 4.4) | 4 (3.7, 4.3) | 4.1 (3.8, 4.5) | 4.2 (3.9, 4.5) |
| Troponin (ng/ml) | 47.6 | 0 (0, 0) | 0 (0, 0) | 0 (0, 0) | 0 (0, 0.1) |
| White Blood Cell (K/uL) | 11 | 10.4 (7.5, 14.2) | 10.4 (7.5, 14.2) | 10.6 (7.7, 14.4) | 10.2 (7.4, 14.1) |
| Computerizd PSI score | 0 | 86 (66, 109) | 68 (57, 90) | 96 (79, 114) | 110 (93, 127) |
| SIRS/sepsis Criteria* | 0 | 41.3(41.2–41.5)% | 42.5(42.2–42.7)% | 25663 (42(41.6–42.4)% | 27232 (38.1(37.8–38.5)% |
| Facility characteristics | |||||
| Low-Complexity (2, 3) | 0 | 23.5(23.4–23.7)% | 22.2(22–22.4)% | 25.2(24.9–25.6)% | 25.1(24.8–25.4)% |
| Rural | 0 | 11.7(11.5–11.8)% | 10.9(10.8–11.1)% | 13.2(12.9–13.5)% | 12.1(11.8–12.3)% |
| Processes | |||||
| Receipt of guideline-concordant antibiotics*in 24 hours | 0 | 65.6(65.5–65.8)% | 62.9(62.6–63.1)% | 68.4(68–68.8)% | 69.7(69.3–70)% |
| Receipt of broad-spectrum antibiotics* in 24 hours | 0 | 23.8(23.7–24)% | 20.4(20.2–20.6)% | 25.7(25.3–26)% | 30.3(30–30.6)% |
| Blood Culture obtained | 0 | 66.4(66.2–66.5)% | 60.4(60.2–60.7)% | 70.6(70.3–71)% | 76.5(76.1–76.8)% |
| Respiratory culture obtained | 0 | 17.8(17.6–17.9)% | 17.1(16.9–17.3)% | 19.7(19.4–20.1)% | 17.5(17.2–17.8)% |
| Outcomes | |||||
| 30-day Mortality | 0 | 6.6(6.5–6.7)% | 3.8(3.7–3.9)% | 7.1(6.9–7.3)% | 12.7(12.5–13)% |
| 90-day Mortality | 0 | 11.8(11.7–11.9)% | 7(6.9–7.1)% | 13.2(12.9–13.5)% | 21.7(21.4–22)% |
| 1-year Mortality | 0 | 22.9(22.7–23)% | 14.3(14.1–14.5)% | 26.2(25.8–26.5)% | 39.9(39.5–40.2)% |
| Hospitalization | 0 | 60.4(60.2–60.6)% | 51.5(51.2–51.7)% | 66.6(66.3–67)% | 75.7(75.3–76)% |
| 7-day secondary hospitalization (among outpatients) | 0 | 10.9(10.8–11.1)% | 9.5(9.3–9.6)% | 12.2(11.9–12.4)% | 13.3(13.1–13.6)% |
| ICU admission (among inpatients) | 39.6 | 13.7(13.5–13.8)% | 15.1(14.9–15.3)% | 13.9(13.6–14.3)% | 11.3(11–11.5)% |
SIRS= Systemic Inflammatory Response Syndrome. Patients deemed to have SIRS if any two of the criteria were met: Temperature > 100.4F (38c), Pulse > 90 bpm, Respiratory rate > 20 bpm, White Blood Cell count > 12 or < 4 K/uL.. Guideline-concordant empiric antibiotics = combination therapy with beta-lactam plus macrolide or doxycycline, or monotherapy with fluoroquinolone. Broad-spectrum antibiotics = any anti-pseudomonal or anti-MRSA antibiotic.
STATISTICAL ANALYSIS:
Summary statistics
Patient characteristics, hospitalizations and outcomes were summarized overall and for Veterans age < 70, 70–80, and ≥80 years. For each group, the following were calculated: the proportion and 95% confidence interval (CI) of patient encounters with each comorbidity; median and interquartile range (IQR) of each vital sign and laboratory result; an adapted electronic pneumonia severity index (PSI) score previously validated in prior work; and proportion (CI) of encounters meeting the criteria for systemic inflammatory response syndrome (SIRS) with the exception of mental status were calculated for each group. 20
Missing value handling
Frequency of missing vital signs and laboratory values are reported in Table 1. Because missing physiologic values are not missing at random but are, in most cases, missing because the clinicians deemed the patient to be not sufficiently ill to warrant measurement, we encoded the missing value by filling a 0 at the missing place and created an indicator of missing for each variable.
Examining age as a predictor of hospitalization
We first explored individual relationships between a patient’s older age and hospitalization after accounting for other patient factors using multivariable logistic regression modeling with generalized estimating equations (GEE) clustered by facility. Age as a patient factor was categorized into 3 groups: age<70, 70–79, and ≥80 years. The model also included the 70 other patient characteristics and 26 missing indicators. Continuous variables were categorized into normal, low and/or high, based upon literature review and clinical judgment, similar to previous work. 21
Patient risk models for hospitalization and mortality
Next, we explored the degree to which hospitalization was unexplained by patient factors by building individual predictive models. Since hospitalization is largely a function of patient vulnerability and illness severity, observed variation in hospitalization may be attributable to differences in patient populations. We aimed to explore the degree to which facility differences in hospitalization rates are explained by facility differences in patient factors (e.g, comorbidities and severity of illness), versus non-patient factors (e.g, contextual facility or provider factors such as organizational capacity or attitudes toward inpatient versus outpatient care) – and to compare this for patients in different age groups. To do this, we compared observed hospitalization rates with what would be expected based on patient factors alone. For each individual patient encounter, we built models to calculate the predicted probability of (1) hospitalization and (2) 30-day mortality based upon the 71 observable patient characteristics and 26 missing indicators from the EHR (Table 1). Models were trained and tested using a 50:50 derivation:validation split. Machine learning modeling was used due to its ability to model nonlinear relationships and interactions between continuous and discrete variables, and our previous experience of greater accuracy than logistic regression for this population.21 We used the Extreme Gradient Boosting algorithm (XGBoost),22 an approach we previously validated in this population, to develop population models to predict the probabilities of hospitalization and 30-day mortality. Model performance was assessed with the area under the receiver operator curve (AUROC) in the validation sets, similar to the approach previously reported.21
Analysis of variation in hospitalization rates
To describe variation in hospitalization before and after accounting for patient factors, we calculated the observed and model-predicted probability of hospitalization for each VA facility. We then compared the observed versus predicted hospitalization for each facility by calculating the residual hospitalization percent– that is, the positive or negative difference between the observed outcomes and the predicted outcomes based upon patient factors alone. This was calculated as:
where predicted hospitalization is equal to the mean probability of hospitalization among all patients presenting to a given facility based upon the patient factors alone. We also calculated residual 30-day mortality for each facility in the same fashion:
To visualize geographic variation, we generated maps displaying observed, predicted, and residual hospitalization rates.
Next, we explored sources of unexplained variation. Practice variation that is unexplained by patient characteristics can arise from individual providers varying their practice within facilities (individual attitudes and behaviors), facilities varying within geographic areas (ie, local practice norms, culture, or organizational influences), or from geographic variation (cultural and organizational influences on provider attitudes and behavior, patient preferences, or practice). To explore sources of variation in hospitalization that was unexplained by patient factors – ie, the degree to which variation occurred at the level of the provider, facility, or VISN (Veterans Integrated Service Network)23 – we fitted mixed effect hierarchical logistic regression models that included hospitalization as the outcome, the logit-scaled hospitalization risk predicted by the XGboosting model as fixed effect, and the provider, facility, and VISN as random effects. We fit one model for each of the three age categories. To visualize the proportion of the overall variation that was attributed to each level – ie, the degrees to which the variation was contributed by provider, facility, or VISNs-level variation – we displayed density curves with the variance attributed to provider, facility, and VISN alone, as well as their summed total variance. We constructed the density curves by:
Obtaining the variance of the random effects on VISN, VA medical center and provider levels from the mixed-effects logistic regression model, assuming the random effect follows normal distribution on the logit scale; where the mean of the normal distribution is calculated as logit(p) where p is raw overall probability of hospitalization and logit() is a logistic function.
Generating the density functions of the normal distributions were then generated using the mean and appropriate variance.
Applying the inverse logit transformation to this normal density to obtain the density function on the probability scale.
Relationships between hospitalization and mortality
We then explored whether differences in facility hospitalization risk correlated with differences in mortality before and after accounting for patient factors. We generated caterpillar plots of facility observed hospitalization, residual hospitalization, and residual mortality, ranked by residual hospitalization. We generated facility-level scatter plots visualizing the observed hospitalization versus mortality, predicted hospitalization versus mortality, and residual hospitalization mortality. We used Pearson’s correlation coefficient to quantify correlations between facility-level hospitalization and mortality and test for statistical significance.
RESULTS:
Among 24M ED encounters during the study period, 297,334 had an initial diagnosis of pneumonia (Figure 1). The median (IQR) age was 68 (60–79) years, 95% were male. 41% met SIRS/sepsis criteria. Overall hospitalization was 61%, 30-day mortality was 6.6%, 90-day mortality 12%, and 1-year mortality 23%.
Figure 1.

Study Population.
Older Veterans had greater comorbidity burden and presented with higher overall pneumonia severity index scores than younger patients (ePSI 96 for 70–79 years and 110 for ≥80 years, compared to 68 for Veterans <70 years) (Table 1). However, with the exception of blood urea nitrogen and brain natriuretic peptide, the majority of the physiologic variables were similar to younger patients. Older Veterans did not demonstrate a greater prevalence of sepsis or ICU admission (Table 1). In contrast, hospitalization was substantially higher (67% and 76%, versus 51%) as were 30-day, 90-day and 1-year mortality. Among those patients not hospitalized, secondary admission within 7 days was also higher (12% and 13% versus 9% for patients <70 years).
GEE logistic regression revealed age as a strong independent risk factor for hospitalization after accounting for patient characteristics: age 70–79 had an odds ratio of 1.39(1.34,1.44) and ≥80 had an odds ratio of 2.1(2,2.2) compared to age <70, which exceeded all other comorbidities including cancer and other immunocompromising conditions. Full results of the regression analysis are available in Supplement A.
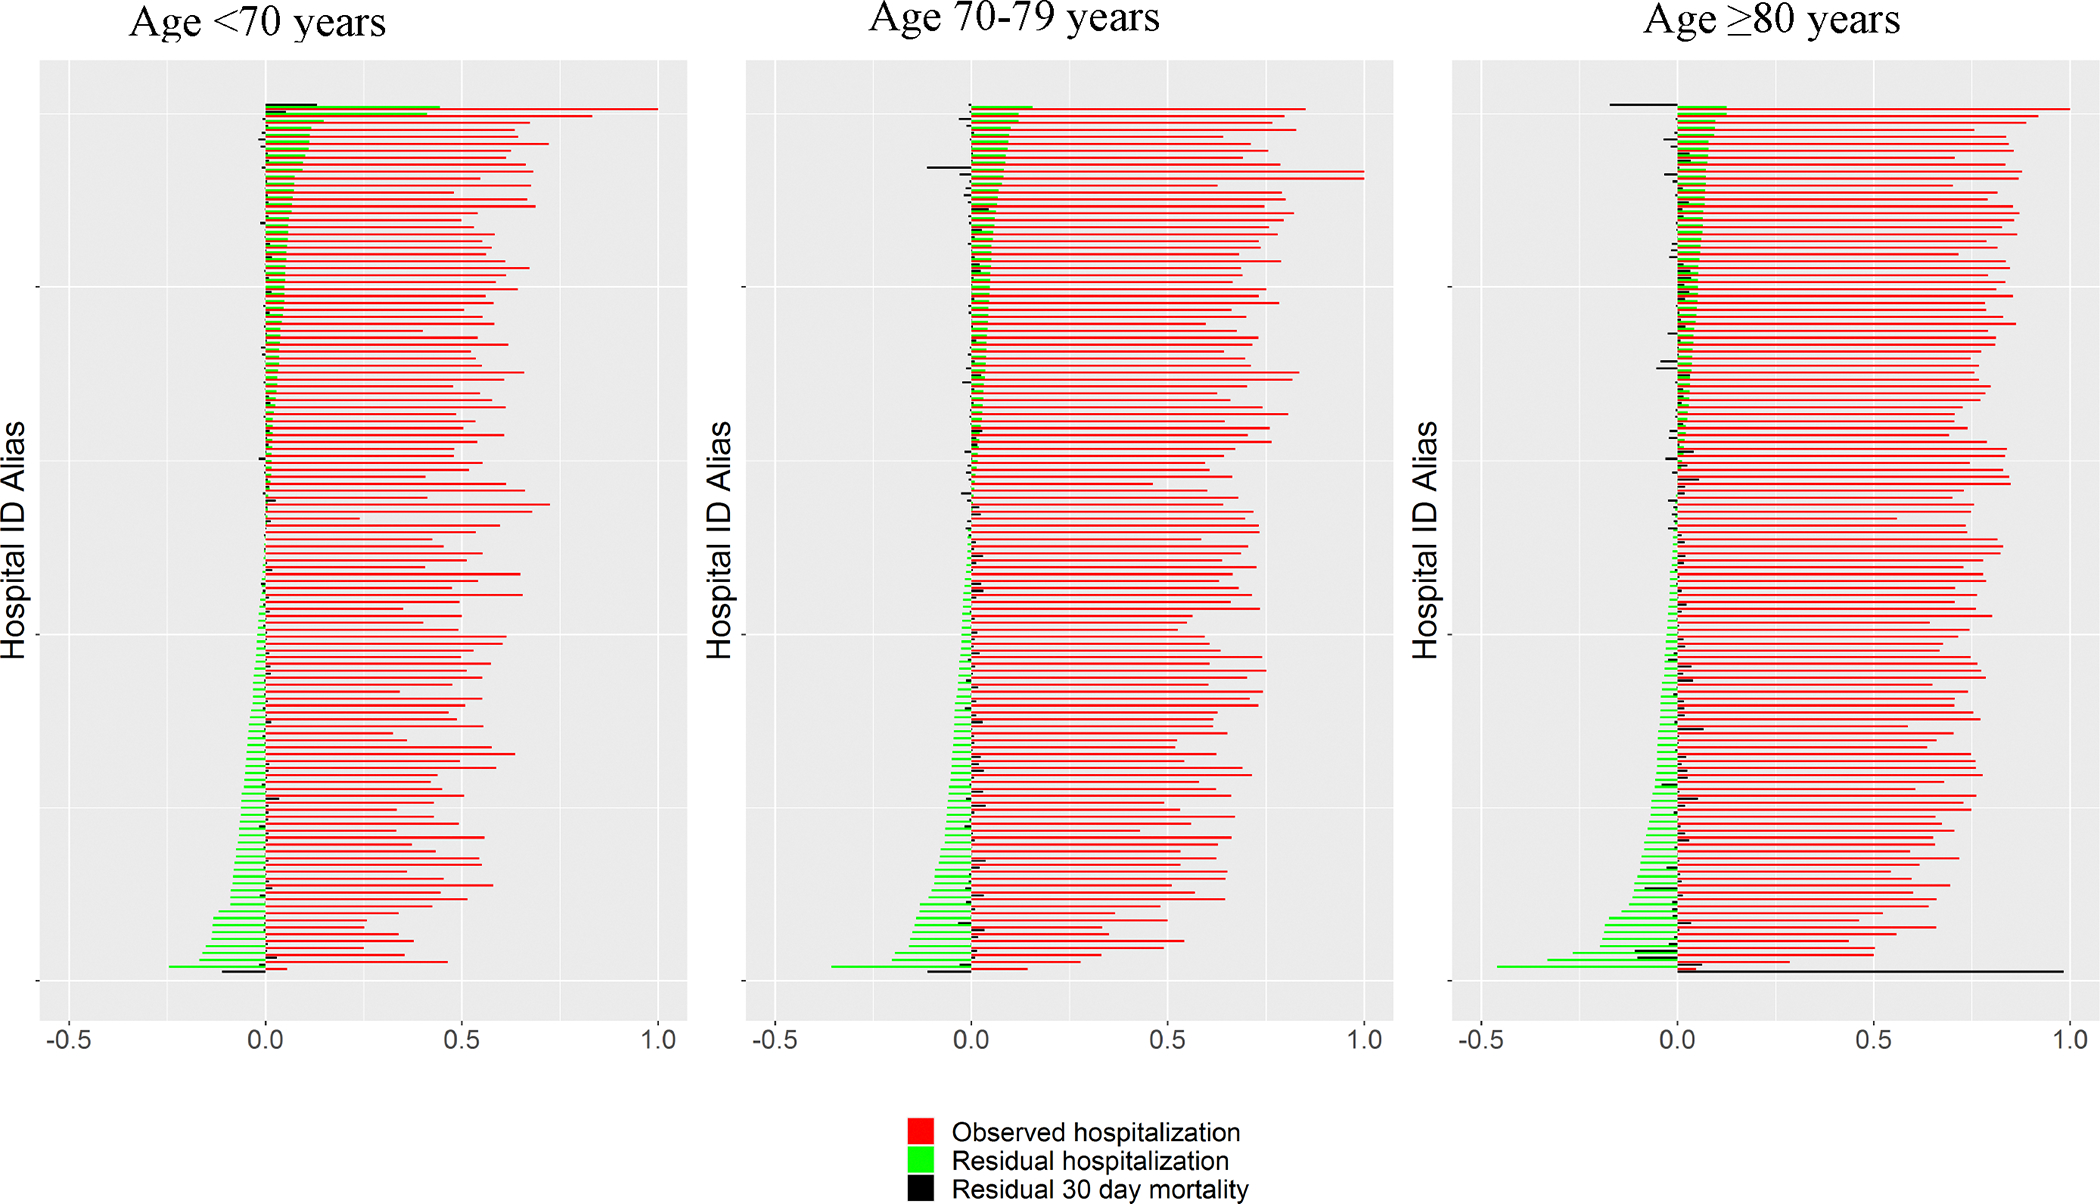
Machine learning models predicting hospitalization and mortality demonstrated high overall accuracy for both (AUROC 0.89and 0.87, respectively) and were well calibrated across age groups. Variation in observed and residual hospitalization was widespread for all age groups. For Veterans <70 years, the hospitalization rate of the highest-admitting decile of facilities was >66.0% compared to <35.3% for the lowest-admitting decile. Older Veterans 70–79 years and ≥80 years of age experienced similar variation albeit with higher hospitalization (78.8% and 84.7% for upper decile and 50.5% and 59.4% for lowest decile, respectively). The caterpillar plot of Figure 2 demonstrates variation in hospitalization across facilities for all age groups (green lines), with no consistent relationship to residual mortality (black lines). Figure 3 demonstrates widespread geographic variation in both observed and residual variation across facilities within the lower 48 United States, suggesting that variation in facility hospitalization rates is largely unexplained by differences in measured patient characteristics. Lower-admitting facilities for younger patients were also lower-admitting facilities for older patients (Figure 3). Figure 4 demonstrates the mixed effect regression model decomposing the different levels of healthcare delivery. As seen by the wider distribution, facility- and provider-level variation were greater than VISN-level variation and contributed equally to the total variation for younger Veterans (black line), although provider variation contributed to a slightly greater degree for Veterans 70–79 (blue dash) and facility variation contributed to a greater degree for Veterans ≥80 (red dash).
Figure 2.
Facility variation in hospitalization. Observed (top row) and residual (observed – predicted – bottom row) hospitalization rates for each facility are shown for Veterans <70 years(left column), Veterans ≥70 years (middle column), and Veterans ≥80 years(right column). Marker size is in proportion to the total number of encounters. Color of facility are assigned based on quantile of observed or residual hospitalization
Figure 3.

Geographic variation in hospitalization for overall cohort, Veterans ≥70 years, and Veterans ≥80 years, ranked by residual (observed – predicted from patient characteristics) hospitalization risk (green). Negative values denote a lower-than-predicted hospitalization rate. Red bars indicate observed proportion of patients hospitalized and black bars indicate residual 30-day mortality risk.
Figure 4.

Sources of variation in hospitalization.
Variation attributed to provider (red dash), facility (red line), and VISN (grey dash) levels. Black line indicated sum of variation. Wider curves represent greater variation.
As demonstrated by the scatter plots in Figure 5 depicting relationships between facility-level mortality versus hospitalization, there was a strong correlation for all age groups between observed facility hospitalization and observed mortality in all age groups (<70:R=.67, 70–80: R=.68, ≥80: R=.65, all p<0.0001) (top row). There was also a strong correlation between predicted facility hospitalization and mortality for all age groups (middle row). However, there was no correlation between residual hospitalization risk and residual mortality in younger Veterans or Veterans ≥80 and a small, slightly significant negative correlation between residual hospitalization and residual mortality among Veterans age 70–79. ( bottom row: <70: R=0.23, p=.014; 70–80: R=.08, p=.42; ≥80: R=.12, p=.21).
Figure 5.

Facility-level mortality versus hospitalization.
Observed (Top row), predicted (Middle row), and residual (Bottom row) 30-day mortality versus hospitalization are shown for Veterans <70 years (left column), Veterans ≥70 years (middle column), and Veterans ≥80 years (right column). Bubble size is in proportion to number of ED encounters. Color of facility represents the degree of residual (observed –predicted) hospitalization. Pearson’s correlation coefficient and test of statistical significance describes the overall relationship between facility mortality and hospitalization.
CONCLUSION/DISCUSSION:
In a national cohort of Veterans presenting to emergency departments for pneumonia, we found that older Veterans carry a much higher risk of hospitalization and death than younger patients. Despite this overall risk, when we explored variation, hospitalization risk varied widely across facilities and demonstrated no clear relationship to 30-day mortality. This finding suggests a high degree of uncertainty and consideration of non-patient factors that influence the hospitalization decision. Further work is needed to determine which patients may benefit or be harmed from hospitalization, particularly for older patients.
Our findings build upon other outcome studies that have reported the high burden of pneumonia in older adults. The population incidence of pneumonia resulting in hospitalization is over double for patients over 65.24 25 We found that over a third of patients ≥70 died within a year of their encounter with pneumonia, which mirrors findings from Ramirez et al.26 Because most large population studies rely upon hospital discharge codes to characterize pneumonia populations, outcomes in ED populations are harder to characterize due to less reliable signals of diagnosis, but our findings that over half of all ED diagnoses resulted in a hospitalization regardless of age is within the range of reports from other healthcare systems.27 28,29
Despite the higher mortality, older patients had similar physiologic derangements to younger patients, which could support the concept that older patients may present with a less robust host response to infection due to immunosenescence. This observation is particularly important when considering physiologic-based risk assessments to support decision-making, as these could result in under-recognition of severe pneumonia in older patients. Age is a major risk factor for pneumonia treatment failure, which is as high as 10% and associated with a high mortality. 30 31 We found that older Veterans who were not hospitalized had higher rates of 7-day secondary hospitalizations than younger patients. Older patients may have more barriers to safe outpatient management strategies that rely on oral intake, transportation for follow up, oxygen or other support systems, all of which are reasons for admitting low-risk patients for pneumonia.32–34 Providers thus have many good reasons to approach older patients with caution, and it is not surprising that a pneumonia diagnosis alone can be felt to warrant admission for some patients, providers and settings.35 While risk of outpatient failure is higher for older patients, however, so is the risk of complications during a hospitalizations.5 Older patients who are hospitalized also experience more hospital readmissions, which may be due to initial acute event or additional complications that arise.36 Long et al estimated the incidence of hospital complications, which include hospital-acquired infection, pressure injuries, delirium, and falls, to be at least double for patients over 6537 38 Over 1/3 pneumonia patients are severely frail, which is a strong predictor of rocky post- hospitalization trajectories regardless of the initial reason for admission.39
Our study found widespread variation across a large integrated healthcare system that was unexplained by patient factors, indicating uncertainty surrounding when a hospitalization is warranted, and that providers are viewing this decision very differently across the system. Facility and geographic effects overshadowed the provider-level variation, suggesting that the setting characteristics – including both inpatient and outpatient organizational capacity, local cultural attitudes toward inpatient or outpatient care, and other barriers to inpatient or outpatient management – could be influencing the decision to admit more than individual provider attitudes and behavior.
We failed to establish a consistent relationship between variation in hospitalization risk and risk of 30-day mortality. This could suggest that there does not seem to be a clearly superior or inferior approach. However, given the heterogeneity in pneumonia, it is more likely that some patients benefit from more aggressive strategies while others may be harmed. The findings that patients 70–79 had a slight but statistically significant negative correlation between residual hospitalization and mortality raises the possibility that hospitalization may modify clinical outcomes more readily in this group than in younger or older patients. However, we did not see a consistent pattern with other decades of age. Outcomes beyond mortality are important to consider and need further study, as different strategies may impact other outcomes that may be disproportionately more important to older patients, such as patient experience, return to independence, or social function. Several studies have suggested outpatient management for more patients with pneumonia may safely reduce unnecessary admissions and costs and improve patient experience. 40 Innovations that leverage decision support to assist clinicians with guideline-based objective severity assessment has been one strategy that has shown some promise to reduce low-risk admissions, 27,41,42 although the specific impact of these tools on older patients may need to be carefully considered. Another innovation that could support safe outpatient discharges includes hospital-at home programs.29,41 While they have not shown impact on mortality, hospital at-home programs have shown promise to reduce rehospitalizations43 patient quality of life, 44,45 and repeat ED visits.46
We previously found a decrease in hospitalizations that was not explained by lower illness severity and was also accompanied by lower 7-day readmissions and mortality.6 Provider and patients may be shifting toward outpatient management of pneumonia, possibly motivated by quantitative assessments of illness severity,47 an increase in out-of-hospital care support systems,48,49 or changes in inpatient capacity.50 7-day secondary admissions were stable overall, suggesting that this trend toward outpatient management is safe, and possibly beneficial compared to hospitalization for many patients with pneumonia. However, these trends were more obvious in younger Veterans, potentially indicating that for older patients, strategies for safe outpatient management of pneumonia are more challenging.
Our study has several limitations. It was a retrospective analysis of clinical data from the EHR which, while comprehensive, does not contain all information used to consider hospitalization. While our cohort selection approach did not rely upon hospital discharge diagnosis codes and demonstrates high accuracy to characterize Veterans with pneumonia, it can still be subject to sampling and measurement error compared to a prospective study. On the other hand, prospective studies requiring consent can under-represent those patients less likely to participate. We leveraged variation across a large healthcare system to explore relationships between hospitalization thresholds and outcomes, finding no compelling relationship between lower or higher hospitalization thresholds and short-term mortality; however, our analysis did not attempt to identify and include all confounding factors in the predictive models and are not equivalent to causal analyses. More work must be done to shed light on mechanisms of the benefits versus the harms of hospitalizations. However, this study indicates that widespread variation in approaches to the hospitalization decision exists for community-onset pneumonia in older Veterans, suggesting a great opportunity to learn from emergent strategies.
Supplementary Material
Supplement A: Generalized estimating equation including age ≥70
Supplement B: Generalized estimating equation including age ≥80
Impact Statement:
Older Veterans with pneumonia have a high risk of hospitalization, with widespread facility-level variation with no clear relationship with mortality. These findings illustrate a need to further examine the benefits and harms of hospitalization for older adults.
ACKNOWLEDGMENTS:
This work was supported by the VA HSR&D Informatics, Decision-Enhancement, and Analytic Sciences (IDEAS) Center of Innovation (CIN 13–414). BE Jones is supported by VA HSR&D career development award (150HX001240).
Contributor Information
Barbara E. Jones, Division of Pulmonary & Critical Care, University of Utah and VA, Salt Lake City Healthcare System, 50 North Medical Drive, Salt Lake City UT 84132.
Jian Ying, Division of Epidemiology, University of Utah.
McKenna Nevers, Division of Epidemiology, University of Utah.
Elizabeth Rutter, Division of Emergency Medicine, University of Utah and VA Salt Lake City Healthcare System.
Alec Chapman, Division of Epidemiology, University of Utah and VA Salt Lake City Healthcare System.
Rachel Brenner, Division of Geriatrics, University of Utah and VA Salt Lake City Healthcare System.
Matthew H Samore, Division of Epidemiology, University of Utah and VA Salt Lake City Healthcare System.
Tom Greene, Department of Population Health Sciences, University of Utah.
REFERENCES
- 1.Centers for Disease Control and Prevention, National Center for Health Statistics. Underlying Cause of Death 1999–2015 on CDC WONDER Online Database, released December, 2016. Data are from the Multiple Cause of Death Files, 1999–2015, as compiled from data provided by the 57 vital statistics jurisdictions through the Vital Statistics Cooperative Program. Accessed at http://wonder.cdc.gov/ucd-icd10.html on Oct 23, 2017 1:06:11 AM.
- 2.Murray MA, Chotirmall SH. The Impact of Immunosenescence on Pulmonary Disease. Mediators Inflamm. 2015;2015:692546. doi: 10.1155/2015/692546 [DOI] [PMC free article] [PubMed] [Google Scholar]
- 3.Lowery EM, Brubaker AL, Kuhlmann E, Kovacs EJ. The aging lung. Clin Interv Aging. 2013;8:1489–96. doi: 10.2147/cia.S51152 [DOI] [PMC free article] [PubMed] [Google Scholar]
- 4.Gavazzi G, Krause KH. Ageing and infection. Lancet Infect Dis. Nov 2002;2(11):659–66. doi: 10.1016/s1473-3099(02)00437-1 [DOI] [PubMed] [Google Scholar]
- 5.Creditor MC. Hazards of hospitalization of the elderly. Ann Intern Med. Feb 1 1993;118(3):219–23. doi: 10.7326/0003-4819-118-3-199302010-00011 [DOI] [PubMed] [Google Scholar]
- 6.Jones BE, Ying J, Nevers MR, et al. Trends in Illness Severity, Hospitalization, and Mortality for Community-Onset Pneumonia at 118 US Veterans Affairs Medical Centers. J Gen Intern Med. Mar 9 2022:1–9. doi: 10.1007/s11606-022-07413-8 [DOI] [PMC free article] [PubMed] [Google Scholar]
- 7. https://www.va.gov/HEALTH/docs/VHA_Quality_and_Safety_Report_2013.pdf .
- 8.Accessed July 27, 2017. https://www.hsrd.research.va.gov/for_researchers/vinci/
- 9.Ruhnke GW, Coca-Perraillon M, Kitch BT, Cutler DM. Trends in mortality and medical spending in patients hospitalized for community-acquired pneumonia: 1993–2005. Med Care. Dec 2010;48(12):1111–6. doi: 10.1097/MLR.0b013e3181f38006 [DOI] [PMC free article] [PubMed] [Google Scholar]
- 10.Lindenauer PK, Lagu T, Shieh MS, Pekow PS, Rothberg MB. Association of diagnostic coding with trends in hospitalizations and mortality of patients with pneumonia, 2003–2009. JAMA. Apr 4 2012;307(13):1405–13. doi: 10.1001/jama.2012.384 [DOI] [PubMed] [Google Scholar]
- 11.Jones BE, South BR, Shao Y, et al. Development and Validation of a Natural Language Processing Tool to Identify Patients Treated for Pneumonia across VA Emergency Departments. Appl Clin Inform. Jan 2018;9(1):122–128. doi: 10.1055/s-0038-1626725 [DOI] [PMC free article] [PubMed] [Google Scholar]
- 12.World Health Organization. Basic tabulation list with alphabetical index. World Health Organization; obtainable from WHO Publications Centre; 1978:331 p. [Google Scholar]
- 13.World Health Organization. International statistical classification of diseases and related health problems. 10th revision, 2nd edition. ed. World Health Organization; 2004. [Google Scholar]
- 14.Davies SM, Geppert J, McClellan M, McDonald KM, Romano PS, Shojania KG. Refinement of the HCUP Quality Indicators. 2001. AHRQ Technical Reviews. [PubMed] [Google Scholar]
- 15.Singer M, Deutschman CS, Seymour CW, et al. The Third International Consensus Definitions for Sepsis and Septic Shock (Sepsis-3). JAMA. Feb 23 2016;315(8):801–10. doi: 10.1001/jama.2016.0287 [DOI] [PMC free article] [PubMed] [Google Scholar]
- 16.Charles PG, Wolfe R, Whitby M, et al. SMART-COP: a tool for predicting the need for intensive respiratory or vasopressor support in community-acquired pneumonia. Clin Infect Dis. Aug 1 2008;47(3):375–84. doi: 10.1086/589754 [DOI] [PubMed] [Google Scholar]
- 17.Vincent JL, Moreno R, Takala J, et al. The SOFA (Sepsis-related Organ Failure Assessment) score to describe organ dysfunction/failure. On behalf of the Working Group on Sepsis-Related Problems of the European Society of Intensive Care Medicine. Intensive Care Med. Jul 1996;22(7):707–10. doi: 10.1007/BF01709751 [DOI] [PubMed] [Google Scholar]
- 18.Angus DC, Linde-Zwirble WT, Lidicker J, Clermont G, Carcillo J, Pinsky MR. Epidemiology of severe sepsis in the United States: analysis of incidence, outcome, and associated costs of care. Crit Care Med. Jul 2001;29(7):1303–10. [DOI] [PubMed] [Google Scholar]
- 19.Fine MJ, Auble TE, Yealy DM, et al. A prediction rule to identify low-risk patients with community-acquired pneumonia. N Engl J Med. Jan 23 1997;336(4):243–50. doi: 10.1056/NEJM199701233360402 [DOI] [PubMed] [Google Scholar]
- 20.Bone RC, Balk RA, Cerra FB, et al. Definitions for Sepsis and Organ Failure and Guidelines for the Use of Innovative Therapies in Sepsis. Chest. 1992/06/01/ 1992;101(6):1644–1655. doi: 10.1378/chest.101.6.1644 [DOI] [PubMed] [Google Scholar]
- 21.Jones BE, Ying J, Nevers M, et al. Computerized Mortality Prediction for Community-acquired Pneumonia at 117 VA Medical Centers. Ann Am Thorac Soc. Feb 26 2021;doi: 10.1513/AnnalsATS.202011-1372OC [DOI] [PMC free article] [PubMed] [Google Scholar]
- 22.Chen T, Guestrin C. XGBoost: A Scalable Tree Boosting System. 2016:785–794. [Google Scholar]
- 23.Accessed 9 11 22, 2022. https://www.va.gov/HEALTH/visns.asp
- 24.Storms AD, Chen J, Jackson LA, et al. Rates and risk factors associated with hospitalization for pneumonia with ICU admission among adults. BMC Pulm Med. Dec 16 2017;17(1):208. doi: 10.1186/s12890-017-0552-x [DOI] [PMC free article] [PubMed] [Google Scholar]
- 25.McLaughlin JM, Khan FL, Thoburn EA, Isturiz RE, Swerdlow DL. Rates of hospitalization for community-acquired pneumonia among US adults: A systematic review. Vaccine. Jan 22 2020;38(4):741–751. doi: 10.1016/j.vaccine.2019.10.101 [DOI] [PubMed] [Google Scholar]
- 26.Ramirez JA, Wiemken TL, Peyrani P, et al. Adults Hospitalized with Pneumonia in the United States: Incidence, Epidemiology & Mortality. Clin Infect Dis. Jul 28 2017;doi: 10.1093/cid/cix647 [DOI] [PubMed] [Google Scholar]
- 27.Yealy DM, Auble TE, Stone RA, et al. Effect of increasing the intensity of implementing pneumonia guidelines: a randomized, controlled trial. Ann Intern Med. Dec 20 2005;143(12):881–94. [DOI] [PubMed] [Google Scholar]
- 28.Dean NC, Jones JP, Aronsky D, et al. Hospital admission decision for patients with community-acquired pneumonia: variability among physicians in an emergency department. Ann Emerg Med. Jan 2012;59(1):35–41. doi: 10.1016/j.annemergmed.2011.07.032 [DOI] [PMC free article] [PubMed] [Google Scholar]
- 29.Dean NC, Jones BE, Jones JP, et al. Impact of an Electronic Clinical Decision Support Tool for Emergency Department Patients With Pneumonia. Ann Emerg Med. Nov 2015;66(5):511–20. doi: 10.1016/j.annemergmed.2015.02.003 [DOI] [PubMed] [Google Scholar]
- 30.Menendez R, Torres A, Zalacain R, et al. Risk factors of treatment failure in community acquired pneumonia: implications for disease outcome. Thorax. Nov 2004;59(11):960–5. doi: 10.1136/thx.2003.017756 [DOI] [PMC free article] [PubMed] [Google Scholar]
- 31.Dinh A, Duran C, Ropers J, et al. Factors Associated With Treatment Failure in Moderately Severe Community-Acquired Pneumonia: A Secondary Analysis of a Randomized Clinical Trial. JAMA Network Open. 2021;4(10):e2129566–e2129566. doi: 10.1001/jamanetworkopen.2021.29566 [DOI] [PMC free article] [PubMed] [Google Scholar]
- 32.Aujesky D JBM, Whittle J, Obrosky DS, Yealy DM, Fine MJ. Reasons Why Emergency Department Providers Do Not Rely on the Pneumonia Severity Index to Determine the Initial Site of Treatment for Patients with Pneumonia. Clinical Infectious Diseases. 2009;49(10):e100–e108. [DOI] [PubMed] [Google Scholar]
- 33.Fine MJ. Pneumonia in the elderly: the hospital admission and discharge decisions. Semin Respir Infect. Dec 1990;5(4):303–13. [PubMed] [Google Scholar]
- 34.Fine MJ, Hough LJ, Medsger AR, et al. The hospital admission decision for patients with community-acquired pneumonia. Results from the pneumonia Patient Outcomes Research Team cohort study. Arch Intern Med. Jan 13 1997;157(1):36–44. [PubMed] [Google Scholar]
- 35.Schaberg T, Gialdroni-Grassi G, Huchon G, Leophonte P, Manresa F, Woodhead M. An analysis of decisions by European general practitioners to admit to hospital patients with lower respiratory tract infections. The European Study Group of Community Acquired Pneumonia (ESOCAP) of the European Respiratory Society. Thorax. Oct 1996;51(10):1017–22. doi: 10.1136/thx.51.10.1017 [DOI] [PMC free article] [PubMed] [Google Scholar]
- 36.Averin A, Shaff M, Weycker D, Lonshteyn A, Sato R, Pelton SI. Mortality and readmission in the year following hospitalization for pneumonia among US adults. Respiratory Medicine. 2021;185doi: 10.1016/j.rmed.2021.106476 [DOI] [PubMed] [Google Scholar]
- 37.Bail K, Goss J, Draper B, Berry H, Karmel R, Gibson D. The cost of hospital-acquired complications for older people with and without dementia; a retrospective cohort study. BMC Health Services Research. 2015/03/08 2015;15(1):91. doi: 10.1186/s12913-015-0743-1 [DOI] [PMC free article] [PubMed] [Google Scholar]
- 38.Long SJ, Brown KF, Ames D, Vincent C. What is known about adverse events in older medical hospital inpatients? A systematic review of the literature. International Journal for Quality in Health Care. 2013;25(5):542–554. doi: 10.1093/intqhc/mzt056 [DOI] [PubMed] [Google Scholar]
- 39.Park CM, Dhawan R, Lie JJ, et al. Functional status recovery trajectories in hospitalised older adults with pneumonia. BMJ Open Respiratory Research. 2022;9(1):e001233. doi: 10.1136/bmjresp-2022-001233 [DOI] [PMC free article] [PubMed] [Google Scholar]
- 40.Rosón B, Carratalà J, Dorca J, Casanova A, Manresa F, Gudiol F. Etiology, Reasons for Hospitalization, Risk Classes, and Outcomes of Community-Acquired Pneumonia in Patients Hospitalized on the Basis of Conventional Admission Criteria. Clinical Infectious Diseases. 2001;33(2):158–165. doi: 10.1086/321808 [DOI] [PubMed] [Google Scholar]
- 41.Dean NC, Suchyta MR, Bateman KA, Aronsky D, Hadlock CJ. Implementation of admission decision support for community-acquired pneumonia. Chest. May 2000;117(5):1368–77. [DOI] [PubMed] [Google Scholar]
- 42.Dean NC, Vines CG, Carr JR, et al. A Pragmatic, Stepped-Wedge, Cluster-controlled Clinical Trial of Real-Time Pneumonia Clinical Decision Support. American Journal of Respiratory and Critical Care Medicine. 2022;205(11):1330–1336. doi: 10.1164/rccm.202109-2092OC [DOI] [PMC free article] [PubMed] [Google Scholar]
- 43.Aimonino Ricauda N, Tibaldi V, Leff B, et al. Substitutive “hospital at home” versus inpatient care for elderly patients with exacerbations of chronic obstructive pulmonary disease: a prospective randomized, controlled trial. J Am Geriatr Soc. Mar 2008;56(3):493–500. doi: 10.1111/j.1532-5415.2007.01562.x [DOI] [PubMed] [Google Scholar]
- 44.Tibaldi V, Isaia G, Scarafiotti C, et al. Hospital at home for elderly patients with acute decompensation of chronic heart failure: a prospective randomized controlled trial. Arch Intern Med. Sep 28 2009;169(17):1569–75. doi: 10.1001/archinternmed.2009.267 [DOI] [PubMed] [Google Scholar]
- 45.Arsenault-Lapierre G, Henein M, Gaid D, Le Berre M, Gore G, Vedel I. Hospital-at-Home Interventions vs In-Hospital Stay for Patients With Chronic Disease Who Present to the Emergency Department: A Systematic Review and Meta-analysis. JAMA Netw Open. Jun 1 2021;4(6):e2111568. doi: 10.1001/jamanetworkopen.2021.11568 [DOI] [PMC free article] [PubMed] [Google Scholar]
- 46.Kuecker CM, Kashyap A, Seckel E. Implementation of a Protocol to Manage Patients at Risk for Hospitalization Due to an Ambulatory Care Sensitive Condition. Fed Pract. Aug 2020;37(8):380–383. doi: 10.12788/fp.0030 [DOI] [PMC free article] [PubMed] [Google Scholar]
- 47.Aujesky D, Auble TE, Yealy DM, et al. Prospective comparison of three validated prediction rules for prognosis in community-acquired pneumonia. Am J Med. Apr 2005;118(4):384–92. doi: 10.1016/j.amjmed.2005.01.006 [DOI] [PubMed] [Google Scholar]
- 48.Mader SL, Medcraft MC, Joseph C, et al. Program at home: a Veterans Affairs Healthcare Program to deliver hospital care in the home. J Am Geriatr Soc. Dec 2008;56(12):2317–22. doi: 10.1111/j.1532-5415.2008.02006.x [DOI] [PubMed] [Google Scholar]
- 49.Cooper DF, Granadillo OR, Stacey CM. Home-based primary care: the care of the veteran at home. Home Healthc Nurse. May 2007;25(5):315–22. doi: 10.1097/01.NHH.0000269965.16119.e5 [DOI] [PubMed] [Google Scholar]
- 50.Busby J, Purdy S, Hollingworth W. A systematic review of the magnitude and cause of geographic variation in unplanned hospital admission rates and length of stay for ambulatory care sensitive conditions. BMC Health Serv Res. Aug 13 2015;15:324. doi: 10.1186/s12913-015-0964-3 [DOI] [PMC free article] [PubMed] [Google Scholar]
Associated Data
This section collects any data citations, data availability statements, or supplementary materials included in this article.
Supplementary Materials
Supplement A: Generalized estimating equation including age ≥70
Supplement B: Generalized estimating equation including age ≥80