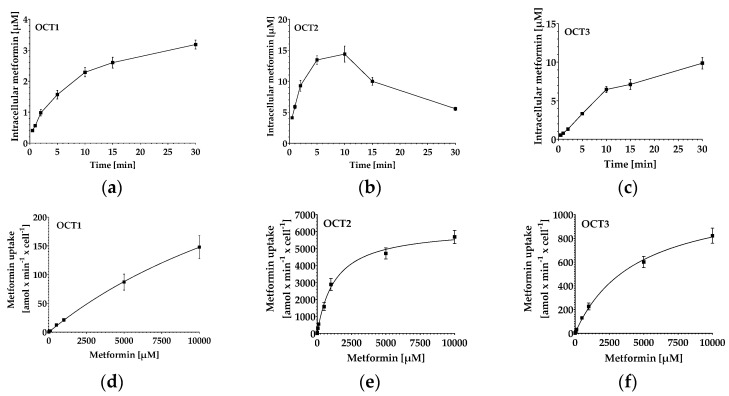
Figure 5.
Uptake kinetics of metformin in OCT-overexpressing HEK293 cell lines. (a–c) Time-dependent uptake of metformin (20 µM for OCT1 and OCT3, 2 µM for OCT2). Data depict mean ± S.E.M. of n = 9–18. (d–f) Concentration-dependent uptake of metformin in OCT-overexpressing HEK293 cell lines. Cells were incubated for 5 min (OCT2 and OCT3) or 10 min (OCT1) with metformin. Data depict mean ± S.E.M. of n = 9.

