Abstract
A new hexaploid cytotype of Aegilops crassa has been identified in Türkiye. To assess the ploidy levels of native populations, 50 samples from Adıyaman, Batman, Bitlis, Diyarbakır, Hakkari, Mardin, Siirt, Şanlıurfa, Şırnak, and Van were analyzed using flow cytometry and cytogenetic techniques. DNA content was determined by comparison with standard plants. Results confirmed two cytotypes in Türkiye: tetraploid populations from Batman, Bitlis, Diyarbakır, Hakkari, Mardin, Siirt, Şanlıurfa, and Şırnak, and hexaploid accessions from Adıyaman and Van. Ten metaphase plates were analyzed. The tetraploid cytotype exhibited chromosome lengths of 8.95 ± 0.27 to 13.96 ± 0.13 µm, a total genome length of 165.51 ± 0.34 µm, and nuclear DNA content of 18.53 ± 0.29 to 20.37 ± 0.49 pg. Most chromosomes were metacentric, except for chromosomes 7, 8, 10, and 12, which were submetacentric. Two satellite pairs were found on chromosomes 4 and 10. The hexaploid cytotype showed chromosome lengths of 8.90 ± 0.16 to 14.06 ± 0.06 µm, a total genome length of 230.47 ± 0.23 µm, and nuclear DNA content of 33.40 ± 0.52 to 35.01 ± 0.31 pg. Most chromosomes were also metacentric, with three satellite pairs on chromosomes 3, 6, and 10. In conclusion, both tetraploid (2n = 2x = 28) and hexaploid (2n = 6x = 42) cytotypes of Ae. crassa exist in Türkiye, with the hexaploid cytotype having potential for wheat breeding programs.
Keywords: Aegilops crassa, cytotype, tetraploid, hexaploid, DNA content, flow cytometry
1. Introduction
The genus Aegilops, commonly referred to as “goat grass” [1], encompasses numerous grass species with significant historical and botanical relevance. Aegilops was notably mentioned in Theophrastus’ botanical treatise Enquiry into Plants, a pivotal reference for botanical knowledge in antiquity and the Middle Ages [2]. The name Aegilops is derived from the Greek term “aegilos”, which may translate as “a herb cherished by goats” or “a herb resembling a goat”, in reference to the characteristic whiskery-awned spikelets of certain species [3,4]. Taxonomic classifications of Aegilops have evolved significantly since Linnaeus [5], with various taxonomists offering distinct perspectives. Zhukovsky [6] described 20 species, organizing them into nine sections, while Eig [7] recognized 22 species, distributed across two subgenera and six sections. Subspecies-level classifications have further diverged, with van Slageren [8] presenting a distinct perspective. Hammer [9] proposed a classification system that distinguishes taxa based on differences in chromosome numbers, morphology, or geographical distribution, recognizing them as separate subspecies.
Species within the Aegilops genus form an allopolyploid series, encompassing diploids (2n = 2x = 14), allotetraploids (2n = 4x = 28), and allohexaploids (2n = 6x = 42) [10]. Aegilops crassa (Ae. crassa), one of the species within this genus, commonly known as Persian goat grass, is the focus of the current research. It is an annual, robust plant that typically reaches heights of 20–40 cm (excluding spikes). Morphologically, Ae. crassa shares a close resemblance with Ae. tauschii, though it is highly variable across diagnostic traits such as spikelet structure and awn development. This variability prompted Eig [7] to classify Ae. crassa into two varieties: var. typica and var. palaestina (now considered Ae. vavilovii Zhuk). Hammer [9] later subdivided Ae. crassa into subspecies and forms, further highlighting its morphological diversity. As a steppic element, Ae. crassa is predominantly distributed across semi-desert regions of western Asia, extending into Transcaucasia, Turkmenistan, Uzbekistan, and other regions [11,12,13]. Recent studies, including those utilizing SSR, ISSR, and nuclear microsatellite markers, have documented extensive variation within Ae. crassa populations in Iran [14,15,16,17]. The species thrives in diverse habitats, including degraded steppe, forest edges, and disturbed sites, and it demonstrates significant drought tolerance, flourishing in areas with annual rainfall between 150 and 350 mm. Two cytotypes of Ae. crassa have been identified: an allotetraploid (2n = 4x = 28; DcDcXcXc) and an auto-allohexaploid (2n = 6x = 42; DcDcXcXcDD), both of which display morphological similarities [2].
Although Ae. crassa is widely distributed throughout Türkiye, no efforts have been made to differentiate between these two cytotypes in 90% of the country’s regions. Furthermore, due to the morphological similarities between these two cytotypes, many botanists are uncertain about their separation. Therefore, it is essential to conduct flow cytometry and karyological analyses to confirm this differentiation. As a result, there exists a significant research gap regarding the identification and classification of Aegilops cytotypes across various regions of Türkiye. To address this gap, the present study aims to investigate and identify these cytotypes through comprehensive chromosomal and karyotypic analysis, focusing on the nuclear genome characteristics of tetraploid and hexaploid cytotypes. Additionally, this research seeks to identify chromosomal markers and satellite chromosomes that distinguish these cytotypes, thereby contributing valuable insights into the genetic diversity and chromosomal structure of this species in Türkiye.
2. Results
2.1. Determination of Nuclear DNA Content
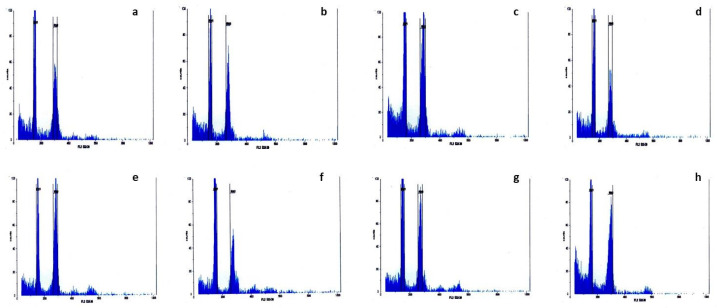
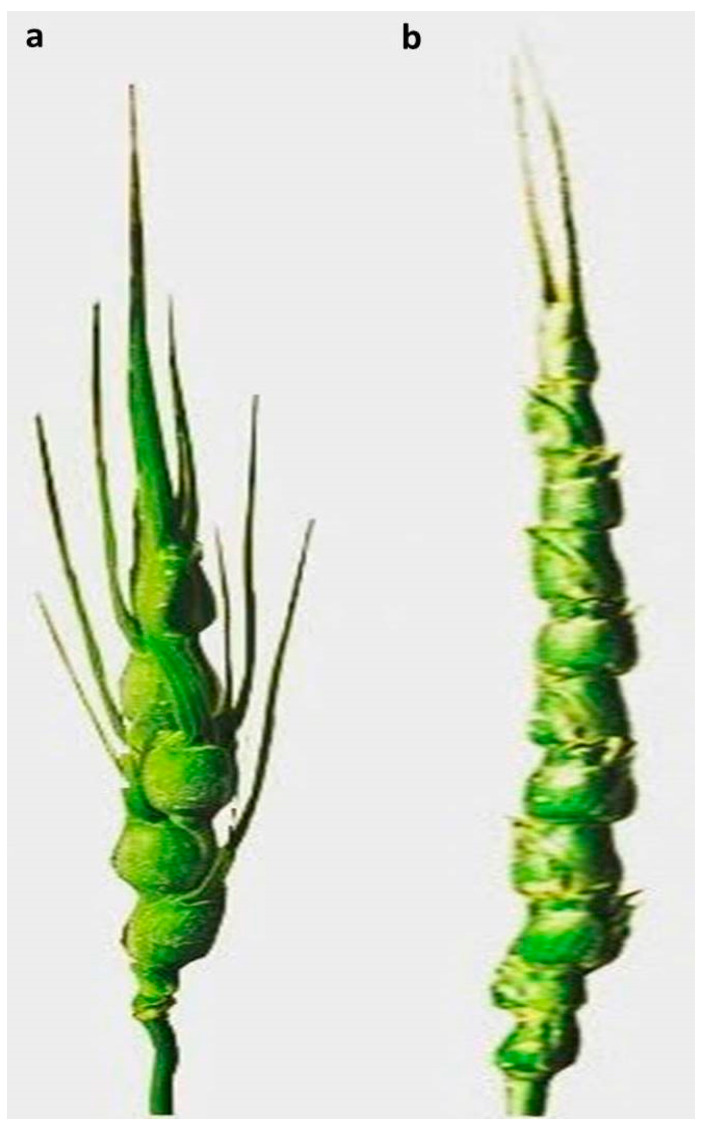
By simultaneously analyzing the control (standard) plant and the test samples, the fluorescence intensity and G1 peak of each Ae. crassa sample were compared to those of the standard (Figure 1 and Figure 2). The absolute nuclear DNA content of each sample, expressed in picograms (pg), was calculated using the average fluorescence intensity values of the G1 peaks from both the standard and the sample. These values were compiled into a corresponding table (Table 1). The nuclear DNA content analysis of Ae. crassa accessions collected from different regions of Türkiye revealed two distinct ploidy levels, tetraploid and hexaploid, among the 50 populations sampled from ten regions. All populations from Batman, Bitlis, Diyarbakır, Hakkari, Mardin, Siirt, Şanlıurfa, and Şırnak were tetraploid, while all accessions from Adıyaman and Van were hexaploid (Table 1; Figure 1 and Figure 2). The spike morphology of both tetraploid and hexaploid cytotypes, which shows the differences between the two ploidy levels, is indicated in Figure 3.
Figure 1.
Flow cytometry histograms of relative fluorescence intensity were obtained from the analysis of DAPI-stained chromosome suspensions prepared from the standard plant (Hordeum vulgare) and tetraploid Ae. crassa samples. (a) Batman, (b) Bitlis, (c) Diyarbakır, (d) Hakkari, (e) Mardin, (f) Siirt, (g) Şanlıurfa, and (h) Şırnak.
Figure 2.
Flow cytometry histograms of relative fluorescence intensity; obtained from the analysis of DAPI-stained chromosome suspensions prepared from the standard plant (Hordeum vulgare) and hexaploid Ae. crassa samples. (a) Adiyaman, (b) Van.
Table 1.
The mean nuclear DNA content of Ae. crassa in accessions of Türkiye.
| Accessions | 2n | MDC (pg/2C) ± SE | Accessions | 2n | MDC (pg/2C) ± SE | Accessions | 2n | MDC (pg/2C) ± SE |
|---|---|---|---|---|---|---|---|---|
| Adıyaman | 42 | 33.41 ± 0.52 | Hakkari | 28 | 20.33 ± 0.30 | Şırnak | 28 | 18.55 ± 0.28 |
| Batman | 28 | 20.49 ± 0.48 | Mardin | 28 | 19.72 ± 0.27 | Van | 42 | 34.05 ± 0.31 |
| Bitlis | 28 | 20.13 ± 0.08 | Siirt | 28 | 19.49 ± 0.40 | |||
| Diyarbakır | 28 | 19.91 ± 0.18 | Şanlıurfa | 28 | 18.67 ± 0.53 |
MDC: mean DNA content; SE: standard error; pg: picogram.
Figure 3.
The spike of Ae. crassa; (a): Ae. crassa (4x); (b): Ae. crassa (6x).
Table 1 presents the mean nuclear DNA content (MDC) of Ae. crassa across various accessions collected from different regions of Türkiye. The values are expressed in picograms per two haploid C (pg/2C) and include the corresponding standard errors (SE) to provide insight into the variability of DNA content within each accession. The data indicate notable differences in mean DNA content between the tetraploid and hexaploid accessions. Specifically, the accession from Van exhibits the highest nuclear DNA content at 34.05 ± 0.31 pg/2C, while the accessions from Şırnak demonstrate the lowest DNA contents, measuring 18.55 ± 0.28 pg/2C.
2.2. Karyo-Morphometric Analyses
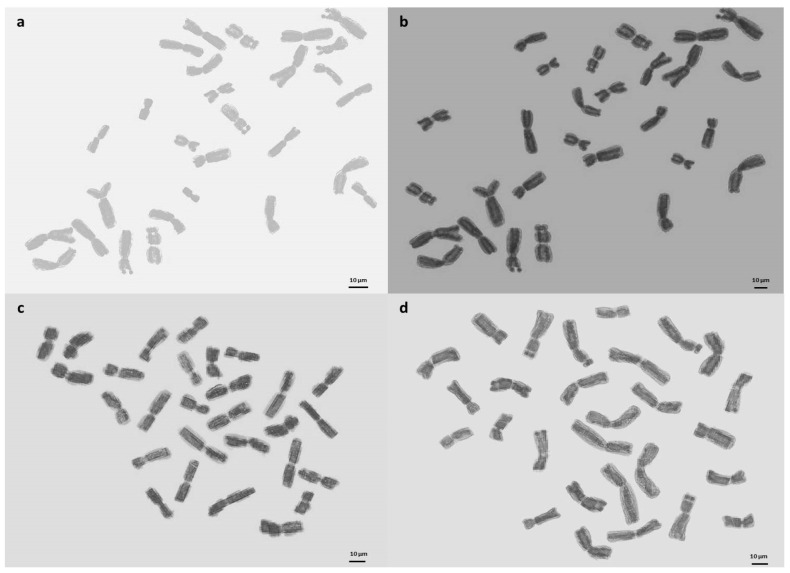
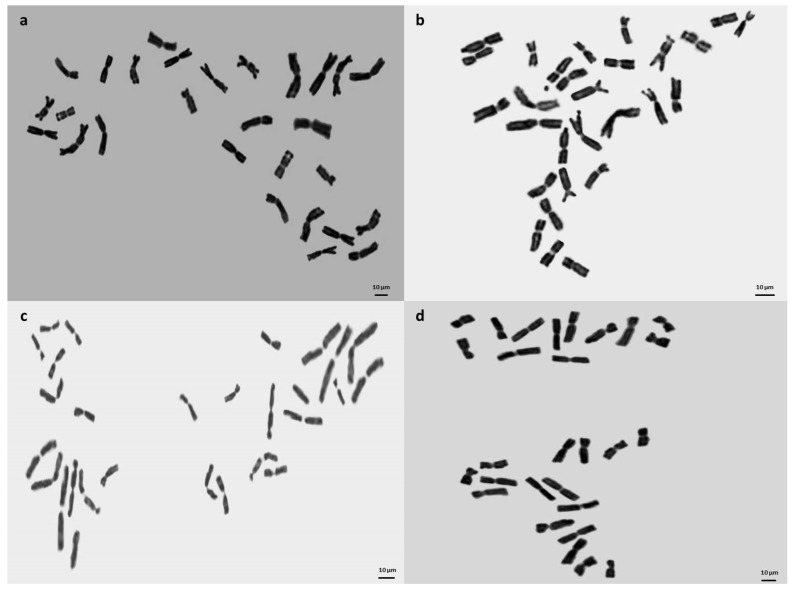
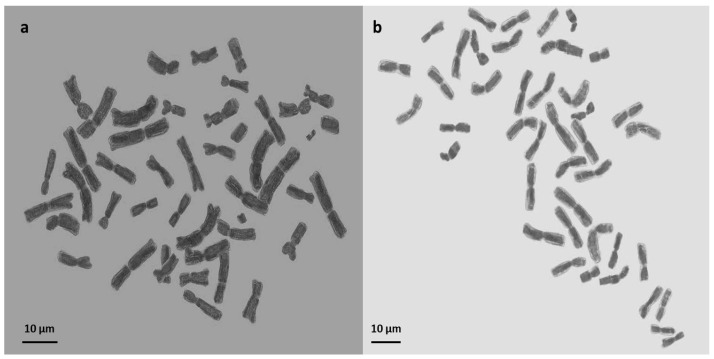
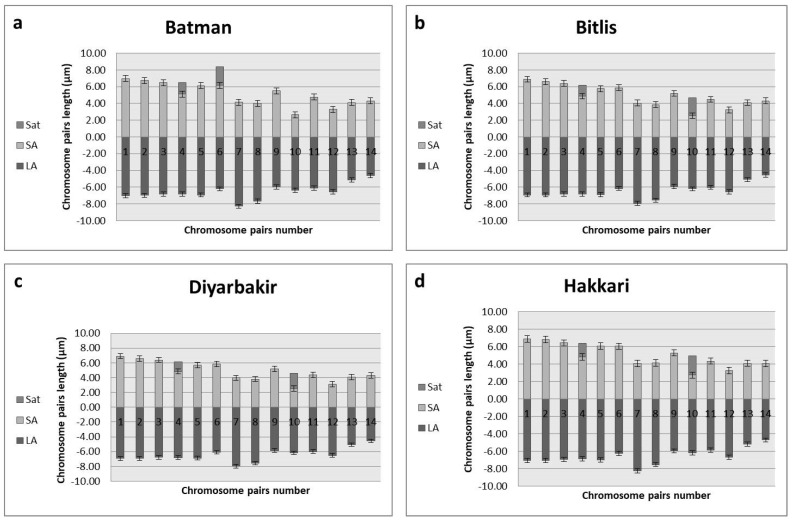
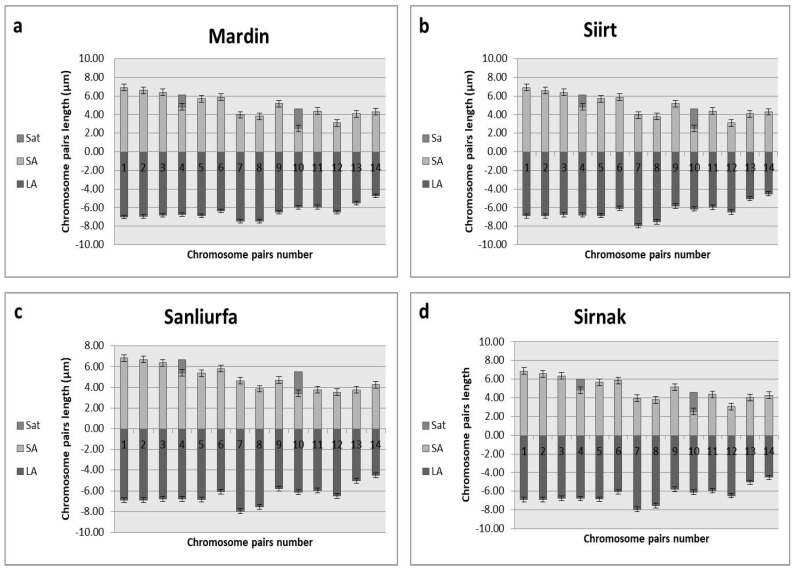
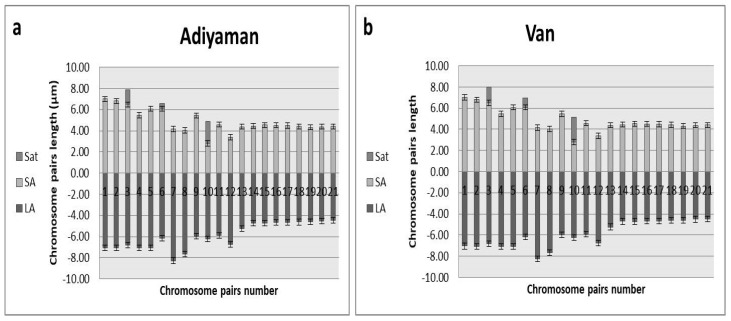
To validate the ploidy levels determined by flow cytometry, cytological studies were conducted on both tetraploid and hexaploid samples. These analyses corroborated the flow cytometry findings, confirming that the indigenous Turkish Ae. crassa samples exhibit two distinct ploidy levels: tetraploid and hexaploid. Micrographies of tetraploid and hexaploid metaphase plates for each cytotype were constructed using five metaphase cells from each sample, with one representative metaphase plate selected and illustrated for each region (Figure 4, Figure 5 and Figure 6). The karyo-morphometric analyses of all spread chromosomes from the optimal metaphase plates revealed the two distinct ploidy levels for Ae. crassa: 2n = 4x = 28 (tetraploid) and 2n = 6x = 42 (hexaploid) (Table 2 and Table 3). These analyses facilitated the identification of eight tetraploid and two hexaploid cytotypes across the different regions. The haploid idiograms of the two cytotypes were established from the mean measurements obtained from the somatic metaphase chromosomes of the identified cytotypes across ten different accessions (Figure 7, Figure 8 and Figure 9).
Figure 4.
Micrographies of tetraploid metaphase plates (2n = 4x = 28) of Ae. crassa cytotype 1. (a) Batman; (b) Bitlis; (c) Diyarbakir; (d) Hakkari. Scale bar = 10 μm.
Figure 5.
Micrographies of tetraploid metaphase plates (2n = 4x = 28) of Ae. crassa cytotype 1. (a) Mardin; (b) Siirt; (c) Şanliurfa; (d) Şirnak. Scale bar = 10 μm.
Figure 6.
Micrographies of hexaploid metaphase plates (2n = 6x = 42) of Ae. crassa cytotype 2. (a) Adiyaman; (b) Van. Scale bar =10 μm.
Table 2.
Karyo-morphometric parameters in tetraploid accessions of Ae. crassa.
| Chr. No | TCL ± SE (µm) | LA ± SE (µm) | SA ± SE (µm) | AR ± SE (µm) | Sat | CI (SA/LA +SA) × 100 + SE | Chr. Type | KF |
|---|---|---|---|---|---|---|---|---|
| 1 | 13.96 ± 0.13 | 7.00 ± 0.05 | 6.96 ± 0.09 | 1.01 ± 0.03 | - | 49.84 ± 0.15 | m | 18m + 6sm + 2msat + 2smsat |
| 2 | 13.72 ± 0.12 | 6.98 ± 0.11 | 6.74 ± 0.08 | 1.04 ± 0.01 | - | 49.10 ± 0.49 | m | |
| 3 | 13.30 ± 0.59 | 6.82 ± 0.18 | 6.49 ± 0.43 | 1.05 ± 0.05 | - | 48.73 ± 1.22 | m | |
| 4 | 13.31 ± 0.21 | 6.81 ± 0.17 | 5.12 ± 0.06 | 1.33 ± 02 | 1.38 | 38.49 ± 0.69 | m | |
| 5 | 13.07 ± 0.31 | 6.93 ± 0.28 | 6.14 ± 0.16 | 1.13 ± 0.02 | - | 47.01 ± 1.25 | m | |
| 6 | 12.36 ± 0.16 | 6.20 ± 0.09 | 6.16 ± 0.07 | 1.01 ± 06 | - | 49.87 ± 0.09 | m | |
| 7 | 12.43 ± 0.24 | 8.27 ± 0.05 | 4.16 ± 0.19 | 1.99 ± 0.04 | - | 33.45 ± 0.87 | sm | |
| 8 | 11.70 ± 0.33 | 7.67 ± 0.28 | 4.03 ± 0.05 | 1.90 ± 0.03 | - | 34.46 ± 0.52 | sm | |
| 9 | 11.50 ± 0.54 | 5.98 ± 0.09 | 5.52 ± 0.46 | 1.09 ± 0.07 | - | 47.95 ± 1.71 | m | |
| 10 | 11.26 ± 0.46 | 6.38 ± 0.35 | 2.66 ± 0.19 | 2.41 ± 0.05 | 2.22 | 23.70 ± 2.58 | sm | |
| 11 | 10.85 ± 0.73 | 6.09 ± 0.41 | 4.76 ± 0.31 | 1.28 ± 0.07 | - | 43.86 ± 0.13 | m | |
| 12 | 9.87 ± 0.31 | 6.56 ± 0.23 | 3.31 ± 0.09 | 1.98 ± 0.11 | - | 33.57 ± 0.34 | sm | |
| 13 | 9.23 ± 0.39 | 5.13 ± 0.11 | 4.11 ± 0.28 | 1.25 ± 0.09 | - | 44.44 ± 1.20 | m | |
| 14 | 8.95 ± 0.27 | 4.63 ± 0.11 | 4.31 ± 0.16 | 1.07 ± 0.02 | - | 48.21 ± 0.36 | m | |
| Total | 165.51 ± 0.34 | 6.53 ± 0.05 | 5.03 ± 0.02 | 1.40 ± 0.03 | 3.60 | 42.33 ± 0.83 |
Chr. No: chromosome pairs number; TCL: total chromosome length; SE: standard error; LA: chromosome long arm; SA: chromosome short arm; AR: arm ratio; Sat: satellite; CI: centromeric index; KF: karyotype formula; m: metacentric; sm: submetacentric.
Table 3.
Karyo-morphometric parameters in hexaploid accessions of Ae. crassa.
| Chr. No | TCL | LA | SA | AR | CI (SA/LA + SA) ×100 + SE | SAT | Chr. Type | KF |
|---|---|---|---|---|---|---|---|---|
| 1 | 14.06 ± 0.06 | 7.05 ± 0.04 | 7.01 ± 0.02 | 1.00 ± 0.01 | 49.88 ± 0.08 | - | m | 2n = 6x = 42 = 30m + 6sm + 4msat + 2smsat |
| 2 | 13.86 ± 0.23 | 7.06 ± 0.07 | 6.80 ± 0.17 | 1.04 ± 0.02 | 49.06 ± 0.42 | - | m | |
| 3 | 14.70 ± 0.58 | 6.81 ± 0.19 | 6.49 ± 0.42 | 1.05 ± 0.01 | 44.15 ± 1.31 | 1.39 | m | |
| 4 | 12.52 ± 0.99 | 7.06 ± 0.36 | 5.46 ± 0.65 | 1.30 ± 0.02 | 43.54 ± 1.74 | - | m | |
| 5 | 13.16 ± 0.38 | 7.09 ± 0.33 | 6.07 ± 0.05 | 1.17 ± 0.03 | 46.14 ± 1.00 | - | m | |
| 6 | 12.75 ± 0.44 | 6.15 ± 0.12 | 6.07 ± 0.18 | 1.01 ± 0.01 | 47.60 ± 0.50 | 0.53 | m | |
| 7 | 12.43 ± 0.24 | 8.27 ± 0.05 | 4.16 ± 0.19 | 1.99 ± 0.04 | 33.45 ± 0.87 | - | sm | |
| 8 | 11.70 ± 0.33 | 7.67 ± 0.28 | 4.03 ± 0.05 | 1.90 ± 0.03 | 34.46 ± 0.52 | - | sm | |
| 9 | 11.44 ± 0.44 | 5.99 ± 0.10 | 5.45 ± 0.35 | 1.10 ± 0.02 | 47.62 ± 1.19 | - | m | |
| 10 | 11.13 ± 0.25 | 6.23 ± 0.11 | 2.80 ± 0.05 | 2.23 ± 0.02 | 25.13 ± 0.27 | 2.11 | sm | |
| 11 | 10.50 ± 0.22 | 5.91 ± 0.15 | 4.58 ± 0.08 | 1.29 ± 0.05 | 43.67 ± 0.38 | - | m | |
| 12 | 10.16 ± 0.25 | 6.77 ± 0.21 | 3.39 ± 0.04 | 2.00 ± 0.04 | 33.37 ± 0.44 | - | sm | |
| 13 | 9.61 ± 0.30 | 5.23 ± 0.10 | 4.38 ± 0.20 | 1.20 ± 0.02 | 45.53 ± 0.71 | - | m | |
| 14 | 9.16 ± 0.12 | 4.71 ± 0.04 | 4.45 ± 0.09 | 1.06 ± 0.01 | 48.61 ± 0.37 | - | m | |
| 15 | 9.24 ± 0.21 | 4.71 ± 0.14 | 4.53 ± 0.03 | 1.04 ± 0.03 | 49.03 ± 0.11 | - | m | |
| 16 | 9.19 ± 0.24 | 4.68 ± 0.15 | 4.51 ± 0.01 | 1.04 ± 0.01 | 49.08 ± 1.4 | - | m | |
| 17 | 9.14 ± 0.14 | 4.65 ± 0.16 | 4.49 ± 0.05 | 1.04 ± 0.02 | 49.12 ± 1.21 | - | m | |
| 18 | 9.04 ± 12 | 4.63 ± 07 | 4.41 ± 0.06 | 1.05 ± 0.02 | 48.78 ± 0.41 | - | m | |
| 19 | 8.91 ± 17 | 4.59 ± 0.02 | 4.32 ± 0.07 | 1.06 ± 0.05 | 48.48 ± 0.22 | - | m | |
| 20 | 8.89 ± 21 | 4.51 ± 0.11 | 4.38 ± 0.02 | 1.03 ± 0.06 | 49.25 ± 0.03 | - | m | |
| 21 | 8.90 ± 16 | 4.49 ± 0.08 | 4.40 ± 0.11 | 1.02 ± 0.08 | 49.49 ± 0.20 | - | m | |
| Total | 230.47 ± 0.23 | 5.92 ± 0.03 | 4.87 ± 0.04 | 1.27 | 44.55 ± 0.48 | 4.03 |
Chr. No: chromosome pairs number; TCL: total chromosome length; SE: standard error; LA: chromosome long arm; SA: chromosome short arm; AR: arm ratio; Sat: satellite; CI: centromeric index; KF: karyotype formula; m: metacentric; sm: submetacentric.
Figure 7.
Haploid ideogram of tetraploid cytotypes of Ae. crassa (2n = 4x = 28); (a) Batman; (b) Bitlis; (c) Diyarbakir; (d) Hakkari.
Figure 8.
Haploid ideogram of tetraploid cytotypes of Ae. crassa (2n = 4x = 28); (a) Mardin; (b) Siirt; (c) Şanliurfa; (d) Şirnak.
Figure 9.
Haploid ideogram of hexaploid cytotypes of Ae. crassa (2n = 6x = 42); (a) Adiyaman; (b) Van.
In the chromosomal analysis of the two cytotypes, the tetraploid cytotype exhibited a longest chromosome measuring 13.96 ± 0.13 μm, while the shortest chromosome measured 8.95 ± 0.27 μm; both chromosomes were classified as metacentric. In contrast, for the hexaploid cytotype, the longest chromosome measured 14.06 ± 0.06 μm, and the shortest measured 8.90 ± 0.16 μm, with both also being metacentric.
2.3. Cytotype and Idiogram Characters
2.3.1. Cytotype 1: Ae. crassa (2n = 4x = 28), Tetraploid
Cytotype 1 was identified in populations sampled from the southeastern regions of Türkiye. This cytotype is characterized by relatively large chromosomes, ranging in length from 9.87 μm to 13.96 μm, with a total mean chromosome length of 165.51 μm. The karyotype consists of nine pairs of metacentric chromosomes, three pairs of submetacentric chromosomes, one pair of metacentric chromosomes with satellites, and one pair of submetacentric chromosomes with satellites.
2.3.2. Cytotype 2: Ae. crassa (2n = 6x = 42), Hexaploid
Cytotype 2 was identified in populations sampled from a province in the southern region of Türkiye (Adıyaman) and in the easternmost province (Van). The chromosomes range in length from 8.96 μm to 14.06 μm, with a mean total length of 230.47 μm. The karyotype formula comprises fifteen pairs of metacentric chromosomes, three pairs of submetacentric chromosomes, two pairs of metacentric chromosomes with satellites, and one pair of submetacentric chromosomes with satellites.
2.4. Comparision of DNA Content and Karyological Parameters in Two Cytotypes of Ae. crassa
The results indicated that the tetraploid genotypes of Ae. crassa collected from different regions in Türkiye exhibited significant differences in DNA content (p < 0.01) (Table 4). However, the karyological parameters did not show significant variations among the regions.
Table 4.
Analysis of variance in DNA content and karyological parameters of tetraploid genotypes of Ae. crassa collected from different regions in Türkiye.
| S.O.V | Df | Mean of Square | |||||
|---|---|---|---|---|---|---|---|
| DNA Content | TCL | LA | SA | AR | CI | ||
| Region | 7 | 1.58 ** | 13.84 ns | 0.01 ns | 0.02 ns | 0.0009 ns | 0.14 ns |
| Error | 16 | 0.12 | 45.96 | 0.03 | 0.09 | 0.007 | 1.19 |
| Total | 23 | ||||||
| F | 12.92 | 0.30 | 0.38 | 0.21 | 0.13 | 0.12 | |
TCL: total chromosome length; LA: chromosome long arm; SA: chromosome short arm; AR: arm ratio; CI: centromere index; **: significant at p < 0.01; ns: not significant.
The comparison of average DNA content across different regions (Table 5) revealed that the highest DNA content was found in the tetraploid genotypes from the Batman region, with a mean value of 20.49 ± 0.28 pg, categorizing it in a separate statistical group. Conversely, the lowest DNA content was recorded in the genotypes collected from the Şırnak region.
Table 5.
The comparison of DNA content and karyological parameter averages in Ae. crassa tetraploid genotypes collected from different regions in Türkiye.
| Region | DNA Content | TCL | LA | SA | AR | CI |
|---|---|---|---|---|---|---|
| Batman | 20.49 ± 0.28 a | 165.51 ± 1.20 a | 6.53 ± 0.05 a | 5.03 ± 0.03 a | 1.39 ± 0.01 a | 42.33 ± 0.08 a |
| Hakkari | 20.34 ± 0.17 ab | 165.38 ± 1.18 a | 6.57 ± 0.07 a | 4.97 ± 0.07 a | 1.41 ± 0.03 a | 41.80 ± 0.60 a |
| Bitlis | 20.13 ± 0.05 ab | 161.99 ± 3.43 a | 6.45 ± 0.09 a | 4.87 ± 0.17 a | 1.43 ± 0.05 a | 41.81 ± 0.59 a |
| Diyarbakir | 19.91 ± 0.11 ab | 161.08 ± 4.30 a | 6.43 ± 0.10 a | 4.84 ± 0.20 a | 1.44 ± 0.06 a | 41.71 ± 0.69 a |
| Mardin | 19.72 ± 0.16 ab | 160.94 ± 4.43 a | 6.43 ± 0.11 a | 4.83 ± 0.21 a | 1.44 ± 0.06 a | 41.69 ± 0.70 a |
| Siirt | 19.49 ± 0.24 bc | 160.79 ± 4.57 a | 6.42 ± 0.11 a | 4.83 ± 0.21 a | 1.44 ± 0.06 a | 41.69 ± 0.70 a |
| Sanliurfa | 18.67 ± 0.31 cd | 160.58 ± 4.78 a | 6.41 ± 0.12 a | 4.82 ± 0.22 a | 1.44 ± 0.06 a | 41.70 ± 0.69 a |
| Sirnak | 18.55 ± 0.16 d | 160.24 ± 5.11 a | 6.40 ± 0.13 a | 4.81 ± 0.23 a | 1.44 ± 0.06 a | 41.70 ± 0.70 a |
TCL: total chromosome length; LA: chromosome long arm; SA: chromosome short arm; AR: arm ratio; CI: centromere index. Values with the same letters in each column are not statistically different at p < 0.01 based on Duncan’s multiple range test (DMRT).
The results indicated that the hexaploid genotypes of Ae. crassa collected from various regions in Türkiye do not exhibit significant differences in DNA content or other karyological parameters at p < 0.01 (Table 6).
Table 6.
Analysis of variance on DNA content and karyological parameters of hexaploid genotypes of Ae. crassa collected from different regions in Türkiye.
| S.O.V | df | Mean of Square | |||||
|---|---|---|---|---|---|---|---|
| DNA Content | TCL | LA | SA | AR | CI | ||
| Region | 1 | 0.60 ns | 4040.41 ns | 0.09 ns | 0.05 ns | 0.00009 ns | 0.14 ns |
| Error | 4 | 0.18 | 823.15 | 0.04 | 0.04 | 0.006 | 0.06 |
| Total | 5 | ||||||
| F | 3.26 | 4.91 | 2.37 | 1.32 | 0.01 | 2.43 | |
TCL: total chromosome length; LA: chromosome long arm; SA: chromosome short arm; AR: arm ratio; CI: centromere index; ns: not significant.
The comparison of average DNA content across different regions (Table 7) revealed that the highest DNA content was observed in the hexaploid genotypes from the Van region, with a mean value of 35.05 ± 0.18 pg. Conversely, the lowest DNA content was recorded in the genotypes collected from the Adıyaman region.
Table 7.
The comparison of DNA content and karyological parameter averages in Ae. crassa hexaploid genotypes collected from different regions in Türkiye.
| Region | DNA Content | TCL | LA | SA | AR | CI |
|---|---|---|---|---|---|---|
| Adiyaman | 34.42 ± 0.30 a | 188.28 ± 22.45 a | 5.92 ± 0.05 a | 4.87 ± 0.04 a | 1.34 ± 0.04 a | 44.55 ± 0.06 a |
| Van | 35.05 ± 0.18 a | 240.18 ± 6.69 | 6.17 ± 0.16 a | 5.04 ± 0.15 a | 1.34 ± 0.05 a | 44.24 ± 0.19 a |
TCL: total chromosome length; LA: chromosome long arm; SA: chromosome short arm; AR: arm ratio; CI: centromere index. Values with the same letters in each column are not statistically different at p < 0.01 based on Duncan’s multiple range test (DMRT).
3. Discussion
Chromosomal findings are used in two primary ways for the classification and differentiation of cytotypes. The first method is descriptive, where chromosomal characteristics are compared to other morphological traits, such as the number of chromosomes being analogous to the number of stamens. This includes considerations of chromosome shape and type alongside phenotypic traits like leaf and petal shapes or the presence of various phenolic compounds. The second method provides specific insights from chromosome number and homology, which are crucial for understanding pairing behavior during meiosis. Mating behavior influences the reproductive success of hybrids, thereby shaping the reproductive strategies and diversity patterns within populations. Both aspects are essential for interpreting chromosomal data, with the analytical aspect being more significant in systematic biological (phylogenetic) studies, while the descriptive aspect holds greater importance for taxonomic (phenetic) purposes. Given that species are typically defined by their chromosomal number, this trait is a valuable taxonomic characteristic. Within a species, distinguishing different cytotypes involves examining chromosome morphology through classical cytogenetics, focusing on features such as chromosome length, type, centromere position, satellite presence, and the analysis of the plant’s morphological traits. Together, these methods provide a reliable diagnostic approach for identifying cytotypes [18,19,20,21]. According to these issues, a review of the opinions and findings of prominent scientists in plant taxonomy and biosystematics is conducted first, followed by a comparison of the findings of the present study with those of other researchers. Additionally, due to the significant morphological similarities between the tetraploid and hexaploid cytotypes in Ae. crassa, many researchers who have investigated this topic utilize flow cytometry and karyological analyses alongside apparent morphological findings to confirm this critical distinction.
The diversity within Aegilops is profound, characterized by a complex allopolyploid series of diploid (2n = 2x = 14), allotetraploid (2n = 4x = 28), and allohexaploid (2n = 6x = 42) species [10]. This polyploidy highlights the genomic complexity and evolutionary dynamics within the genus. Nuclear genome sizes vary significantly among Aegilops species, with diploids ranging from 4.84 to 7.52 pg, tetraploids from 9.59 to 12.64 pg, and hexaploids from 16.22 to 17.13 pg [11,12]. These findings emphasize the genetic richness and adaptability present in Aegilops species. Chromosome morphology within Aegilops is predominantly symmetric, with centromeres located in median or submedian positions. However, certain species, such as Ae. caudata, Ae. umbellulata, Ae. comosa, and Ae. uniaristata, along with their derived allopolyploids, exhibit asymmetric karyotypes [18,22]. Ae. crassa exists in two cytotypes: an allotetraploid (2n = 4x = 28, genome DcDcXcXc) and an auto-allohexaploid (2n = 6x = 42, genome DcDcXcXcDD) [2]. While both cytotypes share morphological similarities, the tetraploid form exhibits more robust, moniliform spikes, whereas the hexaploid form presents more cylindrical spikes [23]. Geographically, the tetraploid cytotype is more widespread, whereas the hexaploid cytotype is restricted to northern Afghanistan and northeastern Iran, reflecting their different evolutionary timelines, representative of an ancient allotetraploid and a more recent hexaploid derivative [24,25]. The origin of the allotetraploid Ae. crassa is attributed to hybridization between two diploid species, while the hexaploid likely emerged from a hybridization event between the tetraploid Ae. crassa and Ae. tauschii. F1 hybrids from these crosses were initially sterile but regained fertility following chromosome doubling, resulting in fertile polyploids. This genomic composition was verified through cytogenetic studies showing the presence of seven ring bivalents in F1 hybrids between tetraploid Ae. crassa and Ae. tauschii [26,27].
The first chromosome count for the tetraploid Ae. crassa was reported by Emme [28], although no mention was made of satellite chromosomes. Later, Chennaveeraiah [18] conducted a more detailed karyotypic analysis, identifying a symmetrical karyotype with two pairs of satellite chromosomes: one pair with a median centromere, and another with a submedian centromere. In contrast, for the hexaploid cytotype, three pairs of satellite chromosomes were observed, with both cytotypes sharing submedian chromosomes and lacking subterminal ones [2]. Species within the Aegilops genus are invaluable to wheat breeding programs, as they contribute critical traits such as pest resistance, tolerance to abiotic and biotic stress, and enhanced grain quality [29,30,31,32,33,34,35]. The identification and reporting of Aegilops cytotypes from various regions are crucial for advancing research in plant breeding, taxonomy, systematics, and biodiversity. While the allotetraploid cytotype of Ae. crassa is broadly distributed, the hexaploid cytotype is geographically restricted to specific areas in northern Afghanistan and northeastern Iran. The occurrence of mixed populations in these regions suggests that the hexaploid cytotype likely originated there.
Türkiye ranks first globally in terms of the wild wheat species it hosts, with all the relatives that contribute to modern wheat and that formed the first gene pool found within the country. The presence of both tetraploid and hexaploid cytotypes of Ae. crassa in Türkiye was first documented by Badaev et al. in 1998. Tetraploid cytotype samples were recorded in the Urfa region, while hexaploid cytotypes were found in the Menemen region of Izmir [36]. Subsequent reports have confirmed the presence of both Ae. crassa cytotypes in other regions, including Adıyaman, Ankara, and Siirt (tetraploid cytotype), as well as Kırıkkale and Tufanbeyli (hexaploid cytotype) [37]. Studies have also identified Aegilops species across three ploidy levels, namely, diploid, tetraploid, and hexaploidy, from various regions of Türkiye. However, in this particular research, only the hexaploid cytotype (6x = 42) of Ae. crassa has been documented [38,39,40].
In the current study, the nuclear DNA content of the tetraploid cytotype ranged from 18.53 to 20.37 pg, consistent with previous findings by Eilam et al. [11,12], who reported a value of 21.72 pg, as well as Najafi et al. (2022) [41], who measured 20.08 pg. In contrast, the nuclear DNA content of the hexaploid cytotype ranged from 33.40 to 35.01 pg. These results are comparable to the findings of Kimber and Tsunewaki [42] (33.63 pg) and Najafi et al. (2022) [41] (31.59 pg), indicating a similar degree of variation in nuclear DNA content between different studies and geographic populations. In terms of chromosomal structure, our study found that chromosomes in the tetraploid cytotype were predominantly metacentric, except for chromosomes 7, 8, 10, and 12, which were submetacentric. Two pairs of satellite chromosomes were observed on the short arms of chromosomes 4 and 10, with average sizes of 1.38 µm and 2.22 µm, respectively. These findings contrast with those of Ranjbar et al. [14], who reported no satellite chromosomes in their tetraploid cytotypes, as well as Emme [28], who similarly did not mention the presence of satellite chromosomes in tetraploid cytotypes.
For the hexaploid cytotype, the chromosome lengths in our study ranged from 8.90 ± 0.16 to 14.06 ± 0.06 µm, with a total genome length of 230.47 µm. These results are comparable to those of Ranjbar et al. [14], who reported chromosome lengths ranging from 7.53 ± 0.34 to 12.95 ± 0.56 µm and a total genome length of 217.39 µm. The chromosomal structure of the hexaploid cytotype was mainly metacentric, but chromosomes 7, 8, 10, and 12 were submetacentric. Additionally, three pairs of satellite chromosomes were identified on the short arms of chromosomes 3, 6, and 10, with average sizes of 1.39 µm, 0.53 µm, and 2.11 µm, respectively. These findings are consistent with those reported by Ranjbar et al. [14], supporting the similarity of hexaploid cytotypes across studies.
4. Materials and Methods
4.1. Plant Materials
In this study, 50 accessions of Ae. crassa were collected from diverse regions of Türkiye during the 2020–2021 growing seasons (Table 8). The research was conducted at two key facilities: nuclear DNA content was measured using flow cytometry (PARTEC, CyFlow Space, Nürnberg, Germany) at the Plant Genetics and Cytogenetics Laboratory, Faculty of Agriculture, Namık Kemal University, Türkiye. Chromosome analysis was carried out at the Cytogenetics Laboratory, Faculty of Agriculture, Van Yüzüncü Yıl University, Türkiye. The accessions were cultivated under controlled greenhouse conditions for morphological characterization. DNA extraction was performed to estimate nuclear DNA content via flow cytometry, and karyotypic analysis was conducted to evaluate chromosomal characteristics.
Table 8.
Geographical distribution of accessions.
| Region | Location | Latitude | Longitude | Altitude |
|---|---|---|---|---|
| ADIYAMAN | 1 | 37.8239 | 38.2623 | 966.2011 |
| 2 | 37.7621 | 38.1534 | 736.7393 | |
| 3 | 37.7635 | 38.3279 | 718.2860 | |
| 4 | 37.8293 | 38.6978 | 723.6678 | |
| 5 | 37.8124 | 38.6126 | 707.6066 | |
| BATMAN | 1 | 38.0373 | 41.2986 | 747.9836 |
| 2 | 37.9634 | 41.2459 | 699.2628 | |
| 3 | 37.8254 | 41.2138 | 666.3896 | |
| 4 | 37.8299 | 41.3870 | 842.9821 | |
| 5 | 37.9671 | 41.1704 | 665.2117 | |
| BİTLİS | 1 | 38.4308 | 42.0540 | 1954.2890 |
| 2 | 38.5212 | 42.1943 | 1814.6393 | |
| 3 | 38.5087 | 41.9611 | 1976.5944 | |
| 4 | 38.7826 | 42.2836 | 1878.1182 | |
| 5 | 38.8209 | 42.6488 | 2037.6939 | |
| DİYARBAKIR | 1 | 38.0020 | 39.9795 | 822.2459 |
| 2 | 37.8743 | 40.6415 | 667.6980 | |
| 3 | 37.9559 | 40.2812 | 761.9961 | |
| 4 | 37.8989 | 40.0394 | 852.0756 | |
| 5 | 37.9111 | 40.4119 | 764.4158 | |
| HAKKARİ | 1 | 37.6239 | 43.7402 | 2600.4914 |
| 2 | 37.6481 | 44.0084 | 2573.5108 | |
| 3 | 37.6523 | 44.2537 | 2379.4649 | |
| 4 | 37.2783 | 44.3920 | 1916.4349 | |
| 5 | 37.3685 | 43.5230 | 1506.9818 | |
| MARDİN | 1 | 37.3022 | 40.8184 | 784.7081 |
| 2 | 37.2583 | 40.7325 | 598.9476 | |
| 3 | 37.2184 | 40.5560 | 533.5359 | |
| 4 | 37.2987 | 40.9240 | 1043.6800 | |
| 5 | 37.1949 | 40.7059 | 562.3227 | |
| SİİRT | 1 | 37.9444 | 41.9436 | 883.3417 |
| 2 | 37.9410 | 41.8861 | 794.8792 | |
| 3 | 37.9089 | 41.9026 | 880.4117 | |
| 4 | 37.9515 | 41.9979 | 1156.4062 | |
| 5 | 37.9346 | 42.0207 | 1133.9996 | |
| ŞANLIURFA | 1 | 37.1521 | 38.6951 | 752.8925 |
| 2 | 36.9794 | 38.9961 | 405.6635 | |
| 3 | 36.8344 | 39.0286 | 332.9841 | |
| 4 | 37.0007 | 39.1763 | 405.4978 | |
| 5 | 36.9870 | 38.5686 | 559.8538 | |
| ŞIRNAK | 1 | 37.5201 | 42.4320 | 1199.5495 |
| 2 | 37.5232 | 42.4485 | 1318.2267 | |
| 3 | 37.5113 | 42.4393 | 1118.5371 | |
| 4 | 37.5188 | 42.4521 | 1320.2921 | |
| 5 | 37.5113 | 42.4393 | 1118.5389 | |
| VAN | 1 | 38.5303 | 43.3539 | 1706.7117 |
| 2 | 38.5171 | 43.4002 | 1845.3378 | |
| 3 | 38.4132 | 43.2710 | 1832.9277 | |
| 4 | 38.3805 | 43.3157 | 1969.6559 | |
| 5 | 38.4436 | 43.5536 | 2422.8174 |
4.2. Ploidy Determination Using Flow Cytometry and Nuclear DNA Content Estimation
Nuclear DNA content was determined using flow cytometry following standard protocols [43,44,45]. Fresh leaf tissues from Ae. crassa (test material) and barley (Hordeum vulgare, 2n = 2x = 14) were utilized as the internal standard, with a known nuclear DNA content of 10.68 pg. The leaf samples were placed between damp filter papers in petri dishes and stored under laboratory conditions prior to analysis. Nuclear DNA content was measured using propidium iodide (PI) staining, following the manufacturer’s protocol. Briefly, 20 mg of fresh green leaf tissue from both the test and standard plants were chopped on ice with 500 μL of extraction buffer and crushed with a scalpel for 30–60 s. The resulting homogenate was gently shaken for 10–15 s, filtered through 50 µm filters (Celltrics, PARTEC, Nürnberg, Germany), and incubated in the dark with 2 mL of DAPI staining solution for 30–60 min. The samples were then analyzed using a flow cytometer, which produced a distinct G1 peak. The fluorescence intensity corresponding to the nuclei of the standard plant was established as a reference, and the G1 peak for each sample was recorded. Nuclear DNA content (in pg) was calculated based on the fluorescence intensity ratio between the G1 peaks of the sample and the standard, using the following equation:
To quantify the nuclear DNA content for each sample from the various regions, three replicates were performed. The mean value was then calculated based on measurements taken from five distinct locations within each region.
4.3. Karyo-Morphometric Analyses
For chromosome analysis, root tip meristems were pretreated with 8-hydroxyquinoline solution and subsequently fixed in Lewitsky solution. After pretreatment, the root tips were rinsed with distilled water and hydrolyzed in 1N HCl for 10 min at 60 °C. The root tips were then stained with aceto-orcein. For each accession, ten metaphase plates were prepared, and chromosome counting was performed using the squash method. Various chromosomal parameters were measured, including somatic chromosome number, total chromosome length (TCL), long arm length (LA), short arm length (SA), satellite length (Sat), arm ratio (AR), centromeric index, chromosome types, and karyotype formula. These measurements were carried out using MicroMeasure 3.3 software [46,47].
4.4. Statistical Analysis
Nuclear DNA content and chromosome analyses were performed with three replicates for each experiment. The study was designed following a completely randomized design (CRD). Data were subjected to one-way ANOVA, and mean values were compared using Duncan’s multiple range test at a significance level of p < 0.01. All statistical analyses were conducted using StatGraphics version XVII.
5. Conclusions
This study provides significant insights into the nuclear DNA content, chromosomal structure, and distribution of Ae. crassa cytotypes, particularly in Türkiye. Our findings emphasize the genetic diversity and complexity of both tetraploid and hexaploid cytotypes, which have important implications for taxonomy, plant breeding, and the conservation of genetic resources. Notably, the identification of satellite chromosomes in the tetraploid cytotype, previously unreported, offers a new perspective on the chromosomal architecture of Aegilops. The observed genetic variability and geographic distribution of hexaploid cytotypes underscore the evolutionary potential of Aegilops species in enhancing stress tolerance and resistance in wheat breeding programs. Further research into the genomic mechanisms underlying these variations will be crucial for advancing our understanding of polyploid evolution and for leveraging Aegilops genetic resources in crop improvement strategies. Moreover, detailed data on the distribution of tetraploid and hexaploid cytotypes across different regions of Türkiye remains limited. Continued investigation in this area is essential and encourages researchers to explore further.
Data Availability Statement
The original contributions presented in this study are included in the article. Further inquiries can be directed to the corresponding author.
Conflicts of Interest
The author declares no conflicts of interest.
Funding Statement
This research received no external funding.
Footnotes
Disclaimer/Publisher’s Note: The statements, opinions and data contained in all publications are solely those of the individual author(s) and contributor(s) and not of MDPI and/or the editor(s). MDPI and/or the editor(s) disclaim responsibility for any injury to people or property resulting from any ideas, methods, instructions or products referred to in the content.
References
- 1.Abrouk M., Wang Y., Cavalet-Giorsa E., Troukhan M., Kravchuk M., Krattinger S.G. Chromosome-scale assembly of the wild wheat relative Aegilops umbellulata. Sci. Data. 2023;10:739. doi: 10.1038/s41597-023-02658-2. [DOI] [PMC free article] [PubMed] [Google Scholar]
- 2.Feldman M., Levy A.A. Aegilops L. Wheat Evolution and Domestication. Springer International Publishing; Berlin/Heidelberg, Germany: 2023. pp. 213–364. [Google Scholar]
- 3.Bor N.L. Gramineae. Flora of Iraq. Ministry of Agriculture & Agrarian Reform; Baghdad, Iraq: 1968. pp. 1–588. [Google Scholar]
- 4.Watson L., Dallwitz M.J. The Grass Genera of the World. C.A.B. International; Wallingford, UK: 1992. p. 1038. [Google Scholar]
- 5.Linnaeus C. Children 1000; 1739. [(accessed on 28 October 2024)]. Available online: https://unixploria.net/onewebmedia/Carl_Linnaeus%20%281%29.pdf.
- 6.Zhukovsky P.M. A criticat-systematical survey of the species of the genus Aegilops L. Bull. Appl. Bot. Gen. Pl. Br. 1928;18:417–609. [Google Scholar]
- 7.Eig A. Monographisch-kritische Übersicht der Gatteung Aegilops. Repert. Spec. Nov. Regni Veg. Beih. 1929;55:1. [Google Scholar]
- 8.Van Slageren M.W. Wild Wheats: A Monograph of Aegilops L. and Aamblyopyrum (Jaub. & Spach) Eig (Poaceae) Wageningen Agricultural University; Wageningen, The Netherlands: 1994. pp. 1–512. [Google Scholar]
- 9.Hammer K. Vorarbeiten zur monographischen Darstellung von Wildpflanzensortimenten: Aegilops L. Resistenzuntersuchungen. Die Kult. 1985;33:123–131. doi: 10.1007/BF01997266. [DOI] [Google Scholar]
- 10.Kihara H. Considerations on the evolution and distribution of Aegilops species based on the analyzer method. Cytologia. 1954;19:336–357. doi: 10.1508/cytologia.19.336. [DOI] [Google Scholar]
- 11.Eilam T., Anikster Y., Millet E., Manisterski J., Sagi-Assif O., Feldman M. Genome size and genome evolution in diploid Triticeae species. Genome. 2007;50:1029–1037. doi: 10.1139/G07-083. [DOI] [PubMed] [Google Scholar]
- 12.Eilam T., Anikster Y., Millet E., Manisterski J., Feldman M. Nuclear DNA amount and genome downsizing in natural and synthetic allopolyploids of the genera Aegilops and Triticum. Genome. 2008;51:616–627. doi: 10.1139/G08-043. [DOI] [PubMed] [Google Scholar]
- 13.Kilian B., Mammen K., Millet E., Sharma R., Graner A., Salamini F., Hammer K., Özkan H. Aegilops. In: Kole C., editor. Wild Crop Relatives: Genomic and Breeding Resources, Cereals. Volume 24. Springer; Berlin, Germany: 2011. pp. 1–76. [Google Scholar]
- 14.Ranjbar M., Naghavi M.R., Zali A., Aghaei M.J. Multivariate analysis of morphological variation in accessions of Aegilops crassa from Iran. Pak. J. Biol. Sci. 2007;10:1126–1129. doi: 10.3923/pjbs.2007.1126.1129. [DOI] [PubMed] [Google Scholar]
- 15.Bordbar F., Rahiminejad M.R., Saeidi H., Blattner F.R. Phylogeny and genetic diversity of D-genome species of Aegilops and Triticum (Triticeae, Poaceae) from Iran based on microsatellites, ITS, and trn LF. Plant System. Evol. 2011;291:117–131. doi: 10.1007/s00606-010-0375-1. [DOI] [Google Scholar]
- 16.Naghavi M., Mardi M., Pirseyedi S., Tabatabaei S. Evaluation of genetic diversity in the subspecies of Aegilops tauschii using microsatellite markers. Cereal Res. Commun. 2008;36:21–31. doi: 10.1556/CRC.36.2008.1.3. [DOI] [Google Scholar]
- 17.Naghavi M.R., Aghaei M.J., Taleei A.R., Omidi M., Mozafari J., Hassani M.E. Genetic diversity of the D-genome in T. aestivum and Aegilops species using SSR markers. Gen. Res. Crop Evol. 2009;56:499–506. doi: 10.1007/s10722-008-9381-3. [DOI] [Google Scholar]
- 18.Chennaveeraiah M.S. Karyomorphologic and cytotaxonomic studies in Aegilops. Acta. Horti Gotoburg. 1960;23:85–178. [Google Scholar]
- 19.Stace C.A. Plant Taxonomy and Biosystematics. Cambridge University Press; Cambridge, UK: 1989. [Google Scholar]
- 20.Khosravi A.R. Plant Taxonomy and Biosystematics. Cambridge University Press; Cambridge, UK: 2009. [Google Scholar]
- 21.Stebbins G.L. Chromosomal Evolution in Higher Plants. Edward Amold; London, UK: 1971. [Google Scholar]
- 22.Senjaninova-Korczagina M. Karyo-systematical investigation of the genus Aegilops L. Bull. Appl. Bot. Gen. Plant Breed. 1932;II:1–90. [Google Scholar]
- 23.Kihara H. Interspecific relationship in Triticum and Aegilops. Seiken Ziho. 1963;15:1–12. [Google Scholar]
- 24.Tsunewaki K. Genome-plasmon interactions in wheat. Jpn. J. Gen. 1993;68:1–34. doi: 10.1266/jjg.68.1. [DOI] [Google Scholar]
- 25.Tsunewaki K. Plasmon analysis in the Triticum-Aegilops complex. Breed. Sci. 2009;59:455–470. doi: 10.1270/jsbbs.59.455. [DOI] [Google Scholar]
- 26.Kihara H. Genomanalyse bei Triticum und Aegilops IX Systematischer Aufbau der Gattung Aegilops auf genomanalytischer Grundlage. Cytologia. 1949;14:135–144. doi: 10.1508/cytologia.14.135. [DOI] [Google Scholar]
- 27.Kihara H. Completion of genome-analysis of three 6x species of Aegilops. Seiken Ziho. 1957;8:3. [Google Scholar]
- 28.Emme H.K. Die Resultate der zytologischen Untersuchungen einiger Aegilops-Arten. Zeitschr. Russ. Bot. Ges. 1924;8:193–197. [Google Scholar]
- 29.Monneveux P., Zaharieva M., Rekika D. The utilisation of Triticum and Aegilops species for the improvement of durum wheat. In: Royo C., Nachit M.N., Di Fonzo N., Araus J.L., editors. Durum Wheat Improvement in the Mediterranean Region: New Challenges. CIHEAM; Zaragoza, Spain: 2000. pp. 71–81. [Google Scholar]
- 30.Schneider A., Molnár I., Molnár-Láng M. Utilisation of Aegilops (goatgrass) species to widen the genetic diversity of cultivated wheat. Euphytica. 2008;163:1–19. doi: 10.1007/s10681-007-9624-y. [DOI] [Google Scholar]
- 31.Zhang P., Dundas I.S., McIntosh R.A., Xu S.S., Park R.F., Gill B.S., Friebe B. Wheat–Aegilops introgressions. In: Molnár-Láng M., Ceoloni C., Doležel J., editors. Alien Introgression in Wheat: Cytogenetics, Molecular Biology, and Genomics. Springer; Berlin/Heidelberg, Germany: 2015. pp. 221–243. [Google Scholar]
- 32.Olivera P.D., Rouse M.N., Jin Y. Identification of new sources of resistance to wheat stem rust in Aegilops spp. in the tertiary genepool of wheat. Front. Plant Sci. 2018;9:1719. doi: 10.3389/fpls.2018.01719. [DOI] [PMC free article] [PubMed] [Google Scholar]
- 33.Kishii M. An update of recent use of Aegilops species in wheat breeding. Front. Plant Sci. 2019;10:585. doi: 10.3389/fpls.2019.00585. [DOI] [PMC free article] [PubMed] [Google Scholar]
- 34.Kumar A., Kapoor P., Chunduri V., Sharma S., Garg M. Potential of Aegilops sp. for improvement of grain processing and nutritional quality in wheat (Triticum aestivum) Front. Plant Sci. 2019;10:308. doi: 10.3389/fpls.2019.00308. [DOI] [PMC free article] [PubMed] [Google Scholar]
- 35.Badaeva E.D., Chikida N.N., Belousova M.K., Ruban A.S., Surzhikov S.A., Zoshchuk S.A. A new insight on the evolution of polyploid Aegilops species from the complex Crassa: Molecular-cytogenetic analysis. Plant System. Evol. 2021;307:3. doi: 10.1007/s00606-020-01731-2. [DOI] [Google Scholar]
- 36.Badaeva E.D., Friebe B., Zoshchuk S.A., Zelenin A.V., Gill B.S. Molecular cytogenetic analysis of tetraploid and hexaploid Aegilops crassa. Chromosome Res. 1998;6:629–637. doi: 10.1023/A:1009257527391. [DOI] [PubMed] [Google Scholar]
- 37.Najafi S. Doctoral Dissertation. Ankara University; Ankara, Turkey: 2012. Karyotype Characterization of Some Aegilops Species Originating from Turkey and Iran. [Google Scholar]
- 38.Cabi E. Taxonomic Revision of the Tribe Triticeae Dumortier (Poaceae) in Turkey. Middle East Technical University; Ankara, Türkiye: 2010. [Google Scholar]
- 39.Güner A., Aslan S., editors. The Plant List of Turkey: (Vascular Plants) Nezahat Gökyiǧit Botanical Garden Publications; Istanbul, Türkiye: 2012. [Google Scholar]
- 40.Özberk F., Karagöz A., Özberk İ., Atlı A. From Wheat Genetic Resources to Local and Cultivated Varieties; Wheat and Bread in Turkey. J. Field Crops Cent. Res. Inst. 2016;25:218–233. [Google Scholar]
- 41.Najafi S., Ulker M., Oral E., Tuncturk R., Tuncturk M., Sayyed R.Z., Perveen K., Poczai P., Cseh A. Estimation of Nuclear DNA Content in Some Aegilops Species: Best Analyzed Using Flow Cytometry. Genes. 2022;13:1980. doi: 10.3390/genes13111980. [DOI] [PMC free article] [PubMed] [Google Scholar]
- 42.Kimber G., Tsunewaki K. Genome Symbols and Plasma Types in the Wheat Group; Proceedings of the 7th International Wheat Genetics Symposium; Cambridge, UK. 13–19 July 1988. [Google Scholar]
- 43.Doležel J., Binarová P., Lcretti S. Analysis of nuclear DNA content in plant cells by flow cytometry. Biol. Plant. 1989;31:113–120. doi: 10.1007/BF02907241. [DOI] [Google Scholar]
- 44.Doležel J., Greilhuber J., Lucretti S., Meister A., Lysák M.A., Nardi L., Obermayer R. Plant genome size estimation by flow cytometry: Inter-laboratory comparison. Ann. Bot. 1998;82:17–26. doi: 10.1093/oxfordjournals.aob.a010312. [DOI] [Google Scholar]
- 45.Doležel J., Greilhuber J., Suda J. Estimation of nuclear DNA content in plants using flow cytometry. Nature Prot. 2007;2:2233–2244. doi: 10.1038/nprot.2007.310. [DOI] [PubMed] [Google Scholar]
- 46.Zarco C.R. A new method for estimating karyotype asymmetry. Taxon. 1986;35:526–530. doi: 10.2307/1221906. [DOI] [Google Scholar]
- 47.Reeves A. MicroMeasure: A new computer program for the collection and analysis of cytogenetic data. Genome. 2001;44:439–443. doi: 10.1139/g01-037. [DOI] [PubMed] [Google Scholar]
Associated Data
This section collects any data citations, data availability statements, or supplementary materials included in this article.
Data Availability Statement
The original contributions presented in this study are included in the article. Further inquiries can be directed to the corresponding author.


