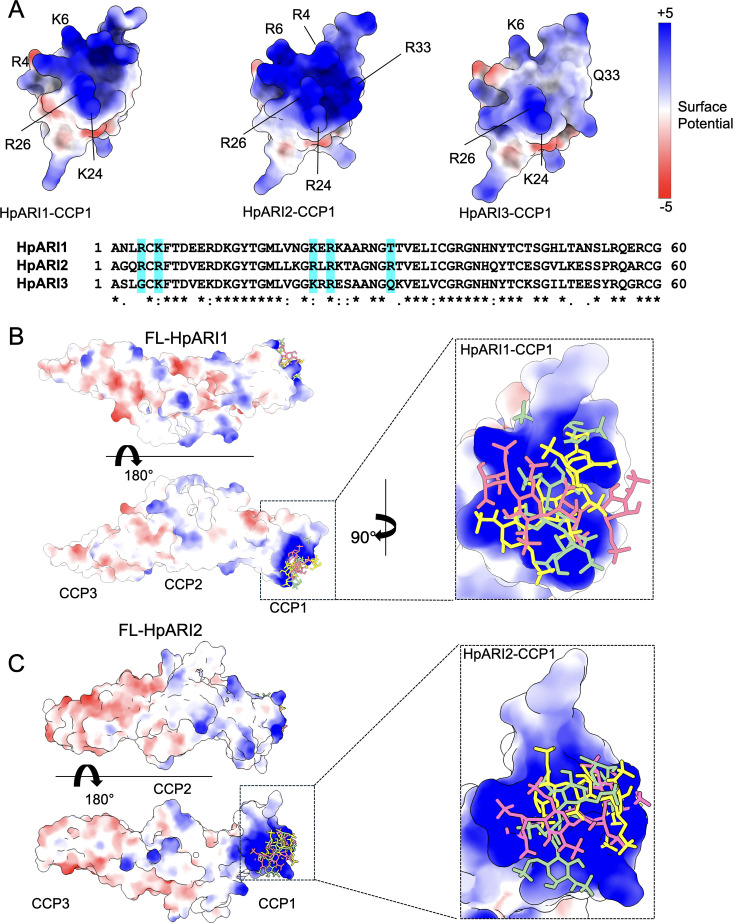
Figure 5. Molecular modelling of HpARI2 interaction of heparin oligosaccharide.
(A) The top panel shows electrostatic surface rendering of AlphaFold models of the CCP1 domains of HpARI1-3. Blue and red surfaces indicate positive and negative surfaces, respectively. The lower panel shows an amino acid sequence alignment of HpARI family proteins with residues contributing to electropositive patch highlighted in cyan. (B, C) Electrostatic surface representation of an AlphaFold model of heparin tetrasaccharide docked on full-length HpARI1 (B) and HpARI2 (C). Three different docking solutions are shown. The right-hand panels show the spread of these models with heparins shown as coloured sticks on a surface representation of the CCP1 domain.

