

Abstract
Background:
Environmental chemical exposures have been associated with metabolic outcomes, and typically, their binding to nuclear hormone receptors is considered the molecular initiating event (MIE) for a number of outcomes. However, more studies are needed to understand the influence of such exposures on cell membrane-bound adiponectin receptors (AdipoRs), which are critical metabolic regulators.
Objective:
We aimed to clarify the potential interactions between AdipoRs and environmental chemicals, specifically organophosphorus flame retardants (OPFRs), and the resultant effects.
Methods:
Employing in silico simulation, cell thermal shift, and noncompetitive binding assays, we screened eight OPFRs for interactions with AdipoR1 and AdipoR2. We tested two key events underlying AdipoR modulation upon OPFR exposure in a liver cell model. The Toxicological Prioritization Index (ToxPi)scoring scheme was used to rank OPFRs according to their potential to disrupt AdipoR-associated metabolism. We further examined the inhibitory effect of OPFRs on AdipoR signaling activation in mouse models.
Results:
Analyses identified pi–pi stacking and pi–sulfur interactions between the aryl-OPFRs 2-ethylhexyl diphenyl phosphate (EHDPP), triphenyl phosphate (TPhP), and tricresyl phosphate (TCP) and the transmembrane cavities of AdipoR1 and AdipoR2. Cell thermal shift assays showed a rightward shift in the AdipoR proteins’ melting curves upon exposure to these three compounds. Although the binding sites differed from adiponectin, results suggest that aryl-OPFRs noncompetitively inhibited the binding of the endogenous peptide ligand ADP355 to the receptors. Analyses of key events underlying AdipoR modulation revealed that glucose uptake was notably lower, whereas lipid content was higher in cells exposed to aryl-OPFRs. EHDPP, TCP, and TPhP were ranked as the top three disruptors according to the ToxPi scores. A noncompetitive binding between these aryl-OPFRs and AdipoRs was also observed in wild-type (WT) mice. In db/db mice, the finding of lower blood glucose levels after ADP355 injection was diminished in the presence of a typical aryl-OPFR (TCP). WT mice exposed to TCP demonstrated lower AdipoR1 signaling, which was marked by lower phosphorylated AMP-activated protein kinase (pAMPK) and a higher expression of gluconeogenesis-related genes. Moreover, WT mice exposed to ADP355 demonstrated higher levels of pAMPK protein and peroxisome proliferator-activated receptor- messenger RNA. This was accompanied by higher glucose disposal and by lower levels of long-chain fatty acids and hepatic triglycerides; these metabolic improvements were negated upon TCP co-treatment.
Conclusions:
In silico, in vitro, and in vivo assays suggest that aryl-OPFRs act as noncompetitive inhibitors of AdipoRs, preventing their activation by adiponectin, and thus function as antagonists to these receptors. Our study describes a novel MIE for chemical-induced metabolic disturbances and highlights a new pathway for environmental impact on metabolic health. https://doi.org/10.1289/EHP14634
Introduction
Anthropogenic compounds, particularly endocrine disruption chemicals (EDCs), are being recognized for their unprecedented impact on the increasing worldwide prevalence of metabolic syndromes,1 and the mechanisms underlying EDC-associated metabolic disruption are being investigated as matters of global significance.2 The potential modes of action of EDC-elicited metabolic disruption have been well studied in relation to nuclear receptors,1 which are broad targets for EDCs. Indeed, most of the molecular initiating events (MIEs) in metabolic diseases associated with environmental exposures have been attributed to alterations of nuclear receptors, such as those documented in the Collaborative Adverse Outcome Pathway (AOP) Wiki database (version 2.7),3 including effects on aryl hydrocarbon receptor (AOP 57), glucocorticoid receptor (AOP 318), liver X-activated receptor (LXR; AOP 34), constitutive androstane receptor (AOP 61), and pregnant X receptor/steroid and xenobiotic receptor (PXR/SXR; AOP 60). This, to a large extent, narrows the knowledge on the mechanism of toxicity, given that related receptors for endogenous hormones extend beyond nuclear receptors to include membrane receptors. The potential role of membrane receptors in the MIE or key events in EDC-induced metabolic disruption remains largely unknown.
Organophosphate flame retardants (OPFRs) are prototypical EDCs.4 They are additive flame retardants that are widely applied in building materials, furniture foam, electronic devices, textiles, and plasticizers.5 As of 2018, world production of OPFRs reached 1,050,000 tons, occupying of the flame retardant market.6 Given their environmental ubiquity and bio-accessibility,7–9 OPFR exposure poses a significant health concern. Epidemiological evidence has indicated that certain OPFRs are positively and linearly associated with plasma sphingolipid levels in adults.10 Thus, in the past decade, metabolic outcomes and related mechanisms have been studied in OPFR-exposed mice,11,12 fish,13 and cell lines.14,15 As with most EDCs, however, mechanistic exploration of OPFRs has shown that their metabolic toxicity is primarily mediated through nuclear receptors. For instance, in the presence of triphenyl phosphate (TPhP), which acts as an LXR antagonist, atherosclerotic lesion formation was induced in apolipoprotein E null () mice following 13 wk of TPhP exposure at doses of 10 or .16 Exposure to a mixture of TPhP, tricresyl phosphate (TCP), and tris (1,3-dichloro-2-propyl) phosphate (TDCPP) at altered metabolic homeostasis partially through estrogen receptor- in adult male mice or ovariectomized female mice.17 The nuclear receptors peroxisome proliferator-activated receptor- () and PXR have been shown to participate in OPFR-associated lipid accumulation in cell models.18–21 A recently reported AOP (AOP 401)22 implicated activation of the G protein-coupled estrogen receptor (GPER), a membrane receptor, as the MIE in the lipid metabolic disruption induced by TPhP.23 Some OPFRs have also shown a higher binding affinity to certain membrane thyroid receptors (mTRs) than to their nuclear counterparts.24 Despite this, there remains a dearth of knowledge regarding the role of membrane receptors in OPFR-induced metabolic dysregulation.
Adiponectin, the most abundant adipocytokine in the blood,25 functions as an insulin-sensitizing peptide hormone.26 It regulates metabolic homeostasis by enhancing glucose disposal and lipid oxidation in insulin-sensitive organs.27 The liver plays an indispensable role in maintaining the systemic balance of carbohydrates, lipids, and other nutrients in humans. It is recognized as a primary target organ for adiponectin.28 Adiponectin exerts its functions mainly through two receptors, AdipoR1 and AdipoR2,29 which are highly expressed in the liver. In a db/db mouse model, liver-specific overexpression of either AdipoR1 or AdipoR2 significantly ameliorated the metabolic disruption induced by leptin receptor deficiency.30 Furthermore, the binding ability and downstream signaling of adiponectin were largely abrogated after knockdown of either AdipoR1 or AdipoR2 in wild-type (WT) mice, leading to hepatic lipid accumulation and insulin resistance.29 These findings underscore the critical role of AdipoR signaling in maintaining metabolism homeostasis in the liver.
The crystal structure of AdipoRs was resolved in 2015.31 These receptors are topologically and functionally distinct from the well-known G protein-coupled receptors, with an extracellular C-terminus and an intracellular N-terminus.32 Seven transmembrane helices, connected by three intracellular and extracellular loops, constitute the main structure of AdipoRs.31 These helices form a large cavity that contains a zinc-binding site.31 AdipoRs are evolutionarily conserved from mammalians to plants, highlighting their indisputable biological significance.32 The activated AdipoRs can stimulate phosphorylation of adenosine monophosphate (AMP)-activated protein kinase (AMPK) and activation of , which has emerged as an effective strategy for preventing and treating hepatic metabolic disease.33,34 Although several EDCs, such as bisphenol A (BPA)35 and 2,2′,4,4′-tetrabromodiphenyl ether,36 have been reported to reduce the mRNA levels of AdipoRs in the arcuate nucleus of adult female offspring rats and in pig ovarian cells, respectively, there is currently no information available regarding the interaction between AdipoRs and OPFRs and the related outcomes.
The present study aimed to evaluate the binding potential between AdipoRs and eight commonly used OPFRs, including the three aryl-OPFRs 2-ethylhexyl diphenyl phosphate (EHDPP), TPhP, and TCP; the three chlorinated OPFRs TDCPP, tris(1-chloro-2-propyl) phosphate (TCPP), and tris(2-chloroethyl) phosphate (TCEP); and the two alkyl-OPFRs tri--butyl phosphate (TBP) and tris(2-butoxyethyl) phosphate (TBEP). The binding affinity and potential binding sites between AdipoR1 and AdipoR2 and these OPFRs were determined through in silico simulations and further validated using cell thermal shift assays (CETSAs). Subsequently, we employed a synthesized endogenous ligand labeled with fluorescein isothiocyanate (FITC) to discern whether the binding between OPFRs and AdipoRs was noncompetitively inhibited. We then chose two key events in AdipoR signaling and tested in a mouse liver cell model upon OPFR treatment. The potency of each OPFR in inducing metabolic disruptions via AdipoRs was ranked accordingly. Finally, we used mouse models to examine whether typical OPFRs would interfere with AdipoR signaling, acting as antagonists. The study presented herein provides new insights into the toxic mechanisms underlying OPFR-induced metabolic disruption.
Materials and Methods
Chemicals and Reagents
The purity, sources, Chemical Abstracts Service Numbers, and product numbers of the tested compounds (EHDPP, TPhP, TCP, TCPP, TDCPP, TCEP, TBP, and TBEP) and reagents (AdipoRon, BODIPY 493/503, and Hoechst 33342) are listed in Table S1. The stock solutions of chemicals were prepared in dimethyl sulfoxide (DMSO; Solarbio) at a concentration of .
Molecular Docking and Dynamics Simulation
X-ray structures of the AdipoRs were obtained from the Research Collaboratory for Structural Bioinformatics (RCSB) Protein Data Bank37,38 (PDB codes 6KS0 and 6KS1 for AdipoR1 and AdipoR2, respectively). Missing hydrogen atoms were added at pH 7.0. The structures of the ligands, including EHDPP, TPhP, TCP, TCPP, TDCPP, TCEP, TBP, and TBEP, as well as the AdipoRon ligands, were drawn according to the structures listed in PubChem.39,40 Flexible molecular docking of AdipoR1/AdipoR2 with the ligands was performed by using Autodock Vina Software41,42 (version number 1.1.2) on the Yinfo Cloud Computing Platform (https://cloud.yinfotek.com). Optimal binding sites were searched within a box of for the 6KS0 protein and for the 6KS1 protein. A total of 20 molecular docking results were generated by the Autodock software, and the highest ranked affinity score was selected as the binding score between each OPFR and AdipoR1 or AdipoR2. This assessment involved evaluating parameters such as Van der Waals forces, electrostatic interactions, and solvent effects, among other parameters, during the binding process. In addition, the optimal interaction mode between each ligand and AdipoR1/AdipoR2 was identified.
The molecular dynamics simulations were performed on the Yinfo Cloud Computing Platform using the AmberTools 20 package,43 with Amber ff19SB44 and GAFF45 force fields for the receptors and each ligand. Receptors were prepared, and the missing atoms of residues were fixed by the advanced PDB-Preparation tool using PDBFixer and the tLEaP module.43 The Austin Model 1-bond charge correction (AM1-BCC) charges were calculated for each ligand using the Amber antechamber program. The system was solvated using a cubic water box [Optimal Point Charge (OPC) water model] with a margin of . The periodic boundary condition was used, and the net charge was neutralized with sodium chloride (NaCl). Briefly, two cycles of 10,000 steps of steepest descent and 10,000 steps of conjugate gradient minimizations were performed to remove improper atom contacts. Following initial optimization, the system was then equilibrated during 200-ps constant-pressure, constant-temperature [number of particles, pressure, temperature (NPT)] and 1-ns canonical ensemble [number of particles, volume, temperature (NVT)]. The temperature was maintained at using a Berendsen thermostat, with a coupling constant of 1 ps and pressure maintained at 1 atm using a Monte Carlo barostat with 1 ps relaxation time. Finally, a 20-ns molecular dynamics simulation was performed in an NVT ensemble without any restraint. The stability of the formed complexes can be evaluated by examining the root mean-square deviation (RMSD) curve. The RMSD and hydrogen bonds were analyzed using the CPPTRAJ module.46
CETSAs in Vitro and in Vivo
CETSA assays leverage the fundamental principle of thermodynamic stabilization of proteins upon ligand binding.47 When bound to the ligand, the proteins maintain solubility, whereas the unbound protein undergoes denaturation and precipitates upon heat challenge.48 For in vitro CETSA assays, we used the alpha mouse liver 12 (AML 12) cell line, which was obtained from American Type Culture Collection. Cells were maintained in a 1:1 mixture of high-glucose Dulbecco’s modified Eagle’s medium/Ham’s F-12 nutrient mixture (DMEM/F-12; Gibco-Thermo Fisher Scientific). The culture medium was supplied with 10% fetal bovine serum (FBS; HyClone) and (100-fold dilution before use, including insulin, transferrin, and sodium selenite; Sigma-Aldrich). The working flow of the CETSA is displayed in Figure S1. During the CETSA, cells were treated with a compound of interest and then subjected to a range of temperatures. After heating, soluble proteins were separated from precipitated (denatured) proteins. The presence of a ligand can increase the melting temperature of its target protein, meaning that the protein remains soluble (not aggregated) at higher temperatures than in its unbound state. Briefly, cells were washed and collected in of phosphate-buffered saline (PBS) containing protease and phosphatase inhibitors (#CW2200S and #CW2383S; CWBIO). Cell lysates were obtained under three cycles of freeze–thawing in liquid nitrogen followed by centrifugation at for 15 min. The protein levels of the supernatants were then determined using a bicinchoninic acid assay (BCA) kit (Vazyme). Supernatants containing protein (for AdipoR1) and protein (for AdipoR2) were separately incubated with or without each chemical () at room temperature. After 1 h of incubation, the supernatants were equally allocated into seven sterile tubes ( each) followed by 3 min of heating at 43°C, 46°C, 49°C, 52°C, 55°C, 58°C, and 61°C for the respective tubes ( replicates/group). The temperature of 61°C, at which more than one-half of the proteins were aggregated, was selected as the maximum temperature for the CETSA based on our pretest observations. (For further detail on the CETSA pretest, see the sections “Pretest for cell thermal shift assay” and “Pretest for cell thermal shift assay: Results” in the Supplemental Material.) This temperature represented a compromise at which of the AdipoR2 protein aggregated, with AdipoR1 showing nearly 90% aggregation across the temperature range of 58–64°C. (For more detail on the CETSA conditions, see Figure S2.) Therefore, 61°C was established as the maximum temperature to ensure sufficient protein aggregation for detection in the CETSA.
The temperature at which 50% protein precipitation was observed was defined as the . Given that AdipoR2 protein precipitation did not reach 50% under TPhP incubation at 61°C, we increased the temperature by two increments to achieve 50% precipitation. The denatured samples were then centrifuged at for 15 min to remove the precipitated proteins. The remaining supernatants () were mixed with the loading buffer (#LT101S; Solarbio) and heated at 70°C for 5 min. Approximately of each sample was assessed by Western blotting to determine the protein levels of AdipoR1 and AdipoR2 (described in more detail below in the section “Western Blotting”). The relative density of AdipoR1 and AdipoR2 under each incubation temperature was fit to a Boltzmann sigmoidal curve49 using GraphPad Prism (version 8.0; GraphPad Software, Inc.). We calculated the change in the () as the of the chemical treatment group minus the of the control group.
For in vivo examination, of mouse liver tissue was homogenized in cold PBS (containing 1% protease inhibitors) followed by one cycle of freeze–thawing. The lysates were centrifuged at for 15 min. The protein content of the supernatant was determined using a BCA protein quantification kit (#E112-01/02; Vazyme) and diluted to for AdipoR1 detection and to for AdipoR2 detection. Approximately proteins were aliquoted for each group, with heating to 55°C for AdipoR1 determination and to 58°C for AdipoR2 determination. The soluble fractions were isolated by centrifugation (described above) and analyzed by Western blotting (described in the “Materials and Methods” section “Western Blotting”). The nominal protein levels of AdipoRs in mouse liver tissue were also determined in conditions without heating ( replicates/group) to exclude the influence of chemical treatment.
Cell-Based FITC-Ligand Noncompetitive Binding Assay
The endogenous peptide ligand of AdipoRs, ADP355, is an adiponectin-derived polypeptide with 10 amino acids. It retains the AdipoRs’ excitatory properties that can mimic the biological function of adiponectin both in vivo and in vitro.50 Therefore, we constructed a fluorescent-labeled adiponectin receptor endogenous ligand, FITC-ADP355, to conduct the noncompetitive binding assay. FITC-ADP355 (Figure S3) was synthesized at GL Biochem (#1024777). For noncompetitive binding assays, of AML 12 mouse liver cells were seeded in black 96-well plates (Corning) at a density of . The next day, the cells were treated with serial concentrations of each OPFR (, , , , , , and ) for 4 h, followed by incubation with FITC-ADP355 () for another 2 h. The fluorescence intensity was read at the excitation wavelength of and emission wavelength of on a microplate reader (Molecular Devices) ( replicates/group). After normalization of values to the control group (set at 100%), the values were fitted to a curve of [inhibitor] vs. response with three parameters, using GraphPad Prism (version 8.0; GraphPad Software, Inc.). Fluorescence was detected using an ImageXpress Micro Confocal High-Content Imaging System (Molecular Devices). Protein was then extracted from the cells and subjected to immunoblotting to confirm the noncompetitive binding between the chemicals and FITC-ADP355, using an anti-FITC as the primary antibody (described in more detail below in the section “Western Blotting”). The presence of a protein band near the molecular weight of each AdipoR was used to identify the FITC-ADP355–AdipoR complexes.
To distinguish the binding affinity between chemicals and each receptor, we also constructed AdipoR1- or AdipoR2-knockdown cell lines using small interfering RNA (siRNA). The sense siRNAs and the scrambled sequences of nucleotide (nontarget siRNAs) were synthesized at Nanjing Zebrafish Biotech Co., Ltd. (sequences are listed in Table S2). Briefly, of AML 12 cells were seeded in black 96-well plates (Corning) at a density of . After 6 h, of siRNA (final concentration ) was mixed with of GP-transfect-Mate (GenePharma) per group in of FBS- and antibiotic-free DMEM/F-12 culture medium. Following a 10-min incubation, the mixture was added to the cells in of culture medium ( replicates/group). After 24 h, cell treatment and data processing were conducted in the same manner as described above for WT AML 12 cells. The constructed cells were verified by real-time reverse transcription–quantitative polymerase chain reaction (RT-qPCR) (see details in the “Materials and Methods” section “RT-qPCR” and verification results in Figure S4). The benchmark dose at 20% reduction of the florescence intensity () in the noncompetitive assay was calculated using Benchmark Dose Software (version 3.2; US Environmental Protection Agency, release 2020-08-20).
Evaluation of Glucose Uptake and Intracellular Lipid Accumulation in Mouse Liver Cells
AML 12 mouse liver cells were seeded into 96-well plates at a density of overnight. Cells were treated with different concentrations of each OPFR (, , , , and ) for periods of 12 h and 24 h. Two different sets of cells were used to separately examine glucose uptake and lipid accumulation. Given that no antagonist for AdipoRs has been identified, we used the established AdipoR-knockdown AML 12 cells as the control for lipid accumulation. ADP355 (#GT-P914, ) and AdipoRon () (#S7365; Selleck) were used as the positive controls for determination of glucose uptake. The extent of glucose uptake was measured using a Glucose Uptake Assay Kit-Green (DOJINDO) ( replicates/group). Briefly, after exposure, AML 12 cells were starved for 30 min in glucose- and serum-free DMEM (Hyclone-Thermo), followed by stimulation with insulin for another 30 min. The medium was replaced by DMEM with a detection probe for 15 min. After thoroughly washing, the assay plate was imaged using an ImageXpress Micro Confocal High-Content Imaging System (Molecular Devices) at the FITC channel. Intracellular lipid accumulation was measured by double staining with Bodipy 493/503 () and Hoechst 33342 () for 20 min at ( replicates/group). Photographs were obtained using the ImageXpress Micro Confocal High-Content Imaging System (Molecular Devices) at the FITC and 4′,6-diaminino-2-phenylindole (DAPI) channels, respectively. Further analysis was undertaken using Fiji/ImageJ (ImageJ 1.54f).51 To minimize variance between wells, we normalized the fluorescence intensity to the fluorescence area in the glucose uptake assay. In the lipid accumulation assay, we adjusted the fluorescence intensity based on the number of cells. Fluorescence intensity values for all treated groups were normalized to the control group (values set at 1.0 arbitrary units). Experiments were conducted using AML 12 cells at passages 15–25 to ensure consistency.
Toxicological Prioritization Index Score Calculation
The Toxicological Prioritization Index (ToxPi) is a prioritization method that reveals the toxicity potential of chemicals by integrating data from various assays.52 Results from the five testing assays were incorporated into ToxPi models. ToxPi scores and rankings were obtained by application of the ToxPi graphic user interface (ToxPi version 2.3).53,54 Briefly, each slice of the ToxPi was composed of one assay. The input data for each assay used in ToxPi analyses are listed in Tables S3 and S4. For the weightings assigned to the assays, we allocated a 16% weight to the molecular docking assay and a 21% weight to the other four assays. Scores and rankings were calculated by summing the scores from each slice for each chemical. The ranking graph and Nightingale Rose diagram were all generated by ToxPi.
Experimental Mouse Models and Treatments
WT C57BL/6J male mice (Shanghai Super-B&K Laboratory Animal Corp. Ltd.) and BKS-Leprem2Cd479/Gpt (db/db) male mice (Jiangsu GemPharmatech Corp. Ltd.) 6–8 wk of age were purchased. The mice were housed in a pathogen-free animal facility at the animal experimental center of our university, where the temperature was maintained at with a 12-h light/12-h dark cycle. Animals had free access to water and chow diet (unless specified otherwise). Animal treatments were conducted in accordance with the ethical guidelines and approval of the animals ethics committee at our university (approval #IACUC-20230703-08).
Experiment 1.
A total of 16 WT mice were randomly divided into four groups (4 mice/group). Mice were acutely exposed via intraperitoneal injection to either solvent control [40% polyethylene glycol (PEG) DMSO saline] or body weight (BW) EHDPP, TPhP, or TCP dissolved in the solvent at BW (stock concentration of ). After 4 h, the animals were euthanized using 2% pentobarbital (P3761; Merck), and the livers were collected. Protein was extracted from the livers, and the CETSA was performed for detection of AdipoRs, as described above.
Experiment 2.
The db/db mouse model is characterized by low levels of circulating adiponectin and provides an ideal context to elucidate the role of AdipoRs following the administration of ADP355.55 According to the ToxPi scores, the middle-ranked chemical, TCP, was selected for the following experiments. Initially, db/db mice were fasted for 5 h, and blood was collected from the tail vein and used for the baseline nominal glucose level measured using a portable glucometer (Sinocare). The mice were then divided into treatment groups for the following sets of experiments. a) In the two-group experiment, mice were intraperitoneally injected with either solvent control ( mice) or TCP ( BW at stock concentration) ( mice). After 1 h of treatment, blood glucose levels were measured from tail vein blood over a period of 5 h using the portable glucometer. b) In the three-group experiment, mice were intraperitoneally injected with solvent in the solvent control group ( mice) and ADP355 group ( mice), or intraperitoneally injected with TCP in the group ( mice). In each group after 1 h of treatment, the baseline blood glucose levels were measured from the tail vein using the portable glucometer. Then, the control group was subcutaneously injected with saline while the ADP355 and ( ADP355) groups were subcutaneously injected with ADP355 ( BW with stock concentration). Blood glucose levels from the tail vein were measured over a period of 7 h using the glucometer.
Experiment 3.
WT mice were randomly divided into four groups to receive either olive oil ( mice), TCP ( mice), ( mice), or ADP355 ( mice). The mice were orally administered TCP or olive oil; after 4 h, BW saline with or without ADP355 (at stock concentration) was subcutaneously injected daily. The mice had free access to water and food [a typical Western diet containing 0.5% (wt/wt) cholesterol, fat , carbohydrate , and protein ; #TP26304; Trophi Feed High-tech Co., Ltd.]. Intraperitoneal glucose tolerance tests were conducted on the 10th day. Briefly, animals were fasted for 16 h, after which they were intraperitoneally injected with glucose at a concentration of ( BW). Blood glucose levels from the tail vein were measured using the portable glucometer at 20, 40, 60, 90, and 120 min after treatment. Animals were weighed and then euthanized on the 16th day. The livers were collected, immediately frozen in liquid nitrogen, and stored at until further analysis. Whole blood samples from each animal were collected from the postcava vein into tubes containing anticoagulant (4% sodium citrate; Yuanye Bio-Technology Co., Ltd.).
Plasma Biochemical Parameters
Blood samples collected from the mice were centrifuged at for 15 min to separate the plasma. Plasma from the mice in experiment 1 was analyzed to determine the levels of glutamic pyruvic transaminase (ALT), glutamic oxaloacetic transaminase (AST), and lactate dehydrogenase (LDH). Plasma from the mice in experiment 3 was analyzed for lipid profiles, including total cholesterol (TC), triglycerides (TG), low-density lipoprotein cholesterol (LDL-C), and high-density lipoprotein cholesterol (HDL-C). All parameters were measured using an automatic biochemistry analyzer (#7020; HITACHI).
RT-qPCR
Total RNA was extracted from AML 12 mouse liver cells or liver tissue with Trizol reagent (#CW3166M; CWBIO). The concentration and quality of RNA were determined using an ultraviolet–visible spectrophotometer (#Q5000; Quawell). The absorbance at fell within the range of 1.8–2.0, confirming RNA quality purity. Approximately of RNA was used to reverse transcribe into complementary DNA (cDNA) according to the instructions of the RT kit (#FSQ101; TOYOBO). The procedure involved an RT reaction at 37°C for 15 min, followed by 98°C for 5 min. Samples of cDNA were stored at until analysis. The fluorescence reaction from the real-time RT-qPCR was prepared with of SYBR qPCR Master Mix (#Q71103; Vazyme), of cDNA, of primers, and of distilled water. The RT-qPCR was completed using the CFX96 Touch Deep Well Real-Time PCR System (Bio-Rad). The reaction program was set as follows: predenaturation at 95°C for 10 min, and then denaturation, annealing, and extension at 95°C for 15 s, 60°C for 30 s, and 72°C for 15 s, respectively, for 40 cycles, followed by a dissociation curve set at 72°C for 5 min. The relative target gene expression was determined using the method. In these analyses, -actin was used as the internal control. Sequences of the target genes are provided in Table S2.
Western Blotting
For Western blotting of mouse liver cells, the cells were washed twice with PBS and digested with cell lysis buffer (#P0013; Beyotime Biotechnology) containing protease inhibitors and phosphate inhibitors (#CW2200S and #CW2383S; CWBIO) for 40 min. The lysates were centrifuged at for 15 min at 4°C to remove cell debris. The protein content of the supernatant was quantified using a BCA protein quantification kit (#E112-01/02; Vazyme). Generally, of proteins were separated by 10% sodium dodecyl sulfate–polyacrylamide gel electrophoresis (#20325ES62; Yeasen Biotechnology Co., Ltd.) and transferred to polyvinylidene difluoride membranes (#IPVH00010; Millipore). The membranes were blocked with rapid sealing fluid (#AR0041; Boster Biological Technology Co., Ltd.) for 30 min at room temperature. Anti-AdipoR1 (1:1,000, #ab70362; Abcam), anti-AdipoR2 (1:2,000, #YT7642; Immunoway Biotechnology), and anti-FITC (1:5,000, #68132-1-Ig; Proteintech) were used as primary antibodies overnight at 4°C. The membranes were washed three times with Tris-buffered saline with Tween 20, and then incubated with the corresponding secondary antibodies, goat antirabbit immunoglobulin (IgG; 1:5,000, #WD0990; Dawen Biotec) and goat antimouse IgG (1:5,000, #WD-GAR007; Dawen Biotec), for 2 h at room temperature. Images were captured and further quantified using the ChemiScope Series (Clinx Science Instrument Co., Ltd.). Fiji/ImageJ (ImageJ 1.54f)51 was used to analyze the gray value.
For Western blotting, liver tissue samples from three mice from each treatment were randomly chosen. Approximately of liver tissue was combined with lysis buffer containing protease and phosphate inhibitors and then ground using a tissue grinder (Shanghai Jingxin Industrial Development Co., Ltd.). After incubating on ice for 40 min, the tissue was centrifuged at for 15 min at 4°C, and the supernatant was stored until analysis. The Western blotting procedure was similar to that described above for the cell studies. Anti-AMPK (1:1,000, #14179; SAB), anti-phospho-AMPKThr172 (1:1,000, #2532; CST), anti-phospho-liver kinase B1 (pLKB1s428) (1:1,000, #11980; SAB), anti-LKB1 (1:1,000, #YT25720; Immunoway Biotechnology), and anti-glyceraldehyde-3-phosphate dehydrogenase (anti-GAPDH; 1:5,000, #WB9662; Dawen Biotec) were used as primary antibodies. Western blot analysis was used to simultaneously assess phosphorylated and total protein levels. Proteins were resolved on the same gel to ensure comparable loading and transfer conditions. After detection of phosphorylated proteins, membranes were stripped using Western blot stripping buffer (#21059; Thermo Scientific) and reprobed for total protein levels.
Gas Chromatography Tandem Mass Spectrometry–Based Fatty Acid Determination
Fatty acid levels were determined in mouse liver tissue samples using gas chromatography tandem mass spectrometry (GC-MS/MS; performed by staff at LC-Bio-Technology Co., Ltd.). Briefly, of liver tissue was mixed with of ester. Samples were then homogenized for 180 s at 4°C and vortexed for 1 min. The mixture was then centrifuged at for 15 min. This extraction procedure was repeated twice, and the supernatants from both extractions were pooled. The combined extracts were evaporated to dryness under a stream of nitrogen gas. Esterification was conducted with of sodium hydroxide–methanol solution in a 60°C water bath, followed by methylation with of 14% boron trifluoride methanol complex (Macklin) at 70°C. Subsequently, of saturated NaCl solution and of -hexane (CNW Technologies GmbH, Anpel) was added and kept at room temperature for 1 min. After centrifugation at for 15 min, of the upper layer was collected for analysis. The fatty acid composition was measured on a Shimadzu GCMS-TQ8040NX triple quadrupole system coupled to a GC-2030 (Thermo Scientific) and equipped with a TR-FAME column (, ). The initial column temperature was 100°C, held for 1 min, then increased to 178°C and held for 10 min. The temperature was subsequently raised to 200°C at a rate of 10°C/min, then finally raised to 240°C and held for 10 min. The injector temperature was set at 250°C. Helium was used as the carrier gas at a flow rate of with a split ratio of 20:1. The ion source temperature was 250°C, the interface temperature was 260°C, and the detection voltage was set at . Fatty acids were identified by comparing their retention times with those of individual purified standards (Anpel) and multiple reaction monitoring fragmentation and then quantified by the external standard method. Quality control (QC) samples were prepared by combining portions of the experimental samples. These QC samples were interspersed throughout the entire measurement process to monitor system stability.
Statistical Analysis
Data were expressed as the for in vitro experiments and the for in vivo experiments. Statistical significance in comparisons between two groups was analyzed using Student’s -test. Comparisons among multiple groups were performed using a one-way analysis of variance (ANOVA) followed by Tukey’s multiple comparisons test. Comparisons between the control and various concentrations of a specific chemical were conducted using a one-way ANOVA followed by Dunnett’s post hoc test. Differences in blood glucose levels from tail vein samples at different time points were determined using a two-way ANOVA. Unless otherwise stated, the data were analyzed with GraphPad Prism (version 8.0; GraphPad Software, Inc.).56 Statistical significance was established at .
Results
Molecular Docking and Dynamics Simulations
Representative compounds from all three major classes of OPFRs, including aryl derivatives (e.g., EHDPP, TPhP, TCP), chlorinated derivatives (e.g., TDCPP, TCPP, TCEP), and alkyl derivatives (e.g., TBP, TBEP), were systematically examined for their potential interaction with AdipoR1 and AdipoR2. The crystal structures of AdipoR1 (6KS0) in an open conformation and AdipoR2 (6KS1) in a closed conformation were used for the docking study. Figure 1 provides a visual representation of the spatial structure of the AdipoRs, revealing a central cavity enclosed by seven transmembrane (TM) helix bundles that span the entire length of the protein. This cavity consists of two distinct regions: the cytoplasmic (CP) region and the lipid bilayer (LB). The docking plots illustrated in Figure 1 and Figure S5 show that most OPFRs preferentially bound with AdipoRs located within the LB of the cell membrane. For AdipoR1, one of the benzene rings of the three aryl-OPFRs formed a pi–pi stacking interaction with amino acid residue TYR310 (Figure 1A). The other two benzene rings of TPhP also engaged a pi–sulfur interaction with MET306 and an amide–pi stack with GLY275. Binding categories, including Van der Waals, alkyl, pi–alkyl, and pi–pi T-shaped, were widely observed for these three chemicals. The binding sites of aryl-OPFRs to AdipoR1 primarily belonged to helices III, V, VI, and VII and extracellular loops (ECLs) (Table 1). Regarding the remaining five chemicals (results shown in Figure S5A), the binding sites of both TCPP and TBEP were situated in proximity to the CP and intracellular loop (ICL) regions of AdipoR1. Carbon hydrogen bonding was the binding mode observed in the engagement of TDCPP, TCPP, TCEP, and TBEP at TYP310, HIS317, GLY275, and HIS337, respectively. Van der Waals and carbon hydrogen were the two observed binding modes of OPFRs in binding to AdipoR2 (Figure 1B and Figure S5B). Excluding the two chlorinated derivatives TDCPP and TCPP, the other OPFRs mostly interacted with AdipoR2 at helices III, V, and VI (Table 1). An extra binding region for EHDPP, TCP, and TBEP was located at an ECL (at ILE311). Moreover, a pi–sulfur interaction was found only in the binding of TPhP and TCP with MET315 (Figure 1B). Regarding the nonpeptide ligand of AdipoRs, AdipoRon exhibited four pi–pi stacking interactions with TYR310, PHE303, PHE202, and PHE271 (Figure S6), and a carbon hydrogen bond with GLY275 of AdipoR1. The binding mode between AdipoRon and AdipoR2 was primarily categorized as Van der Waals, pi–alkyl, and pi–pi T-shaped (Figure S6).
Figure 1.
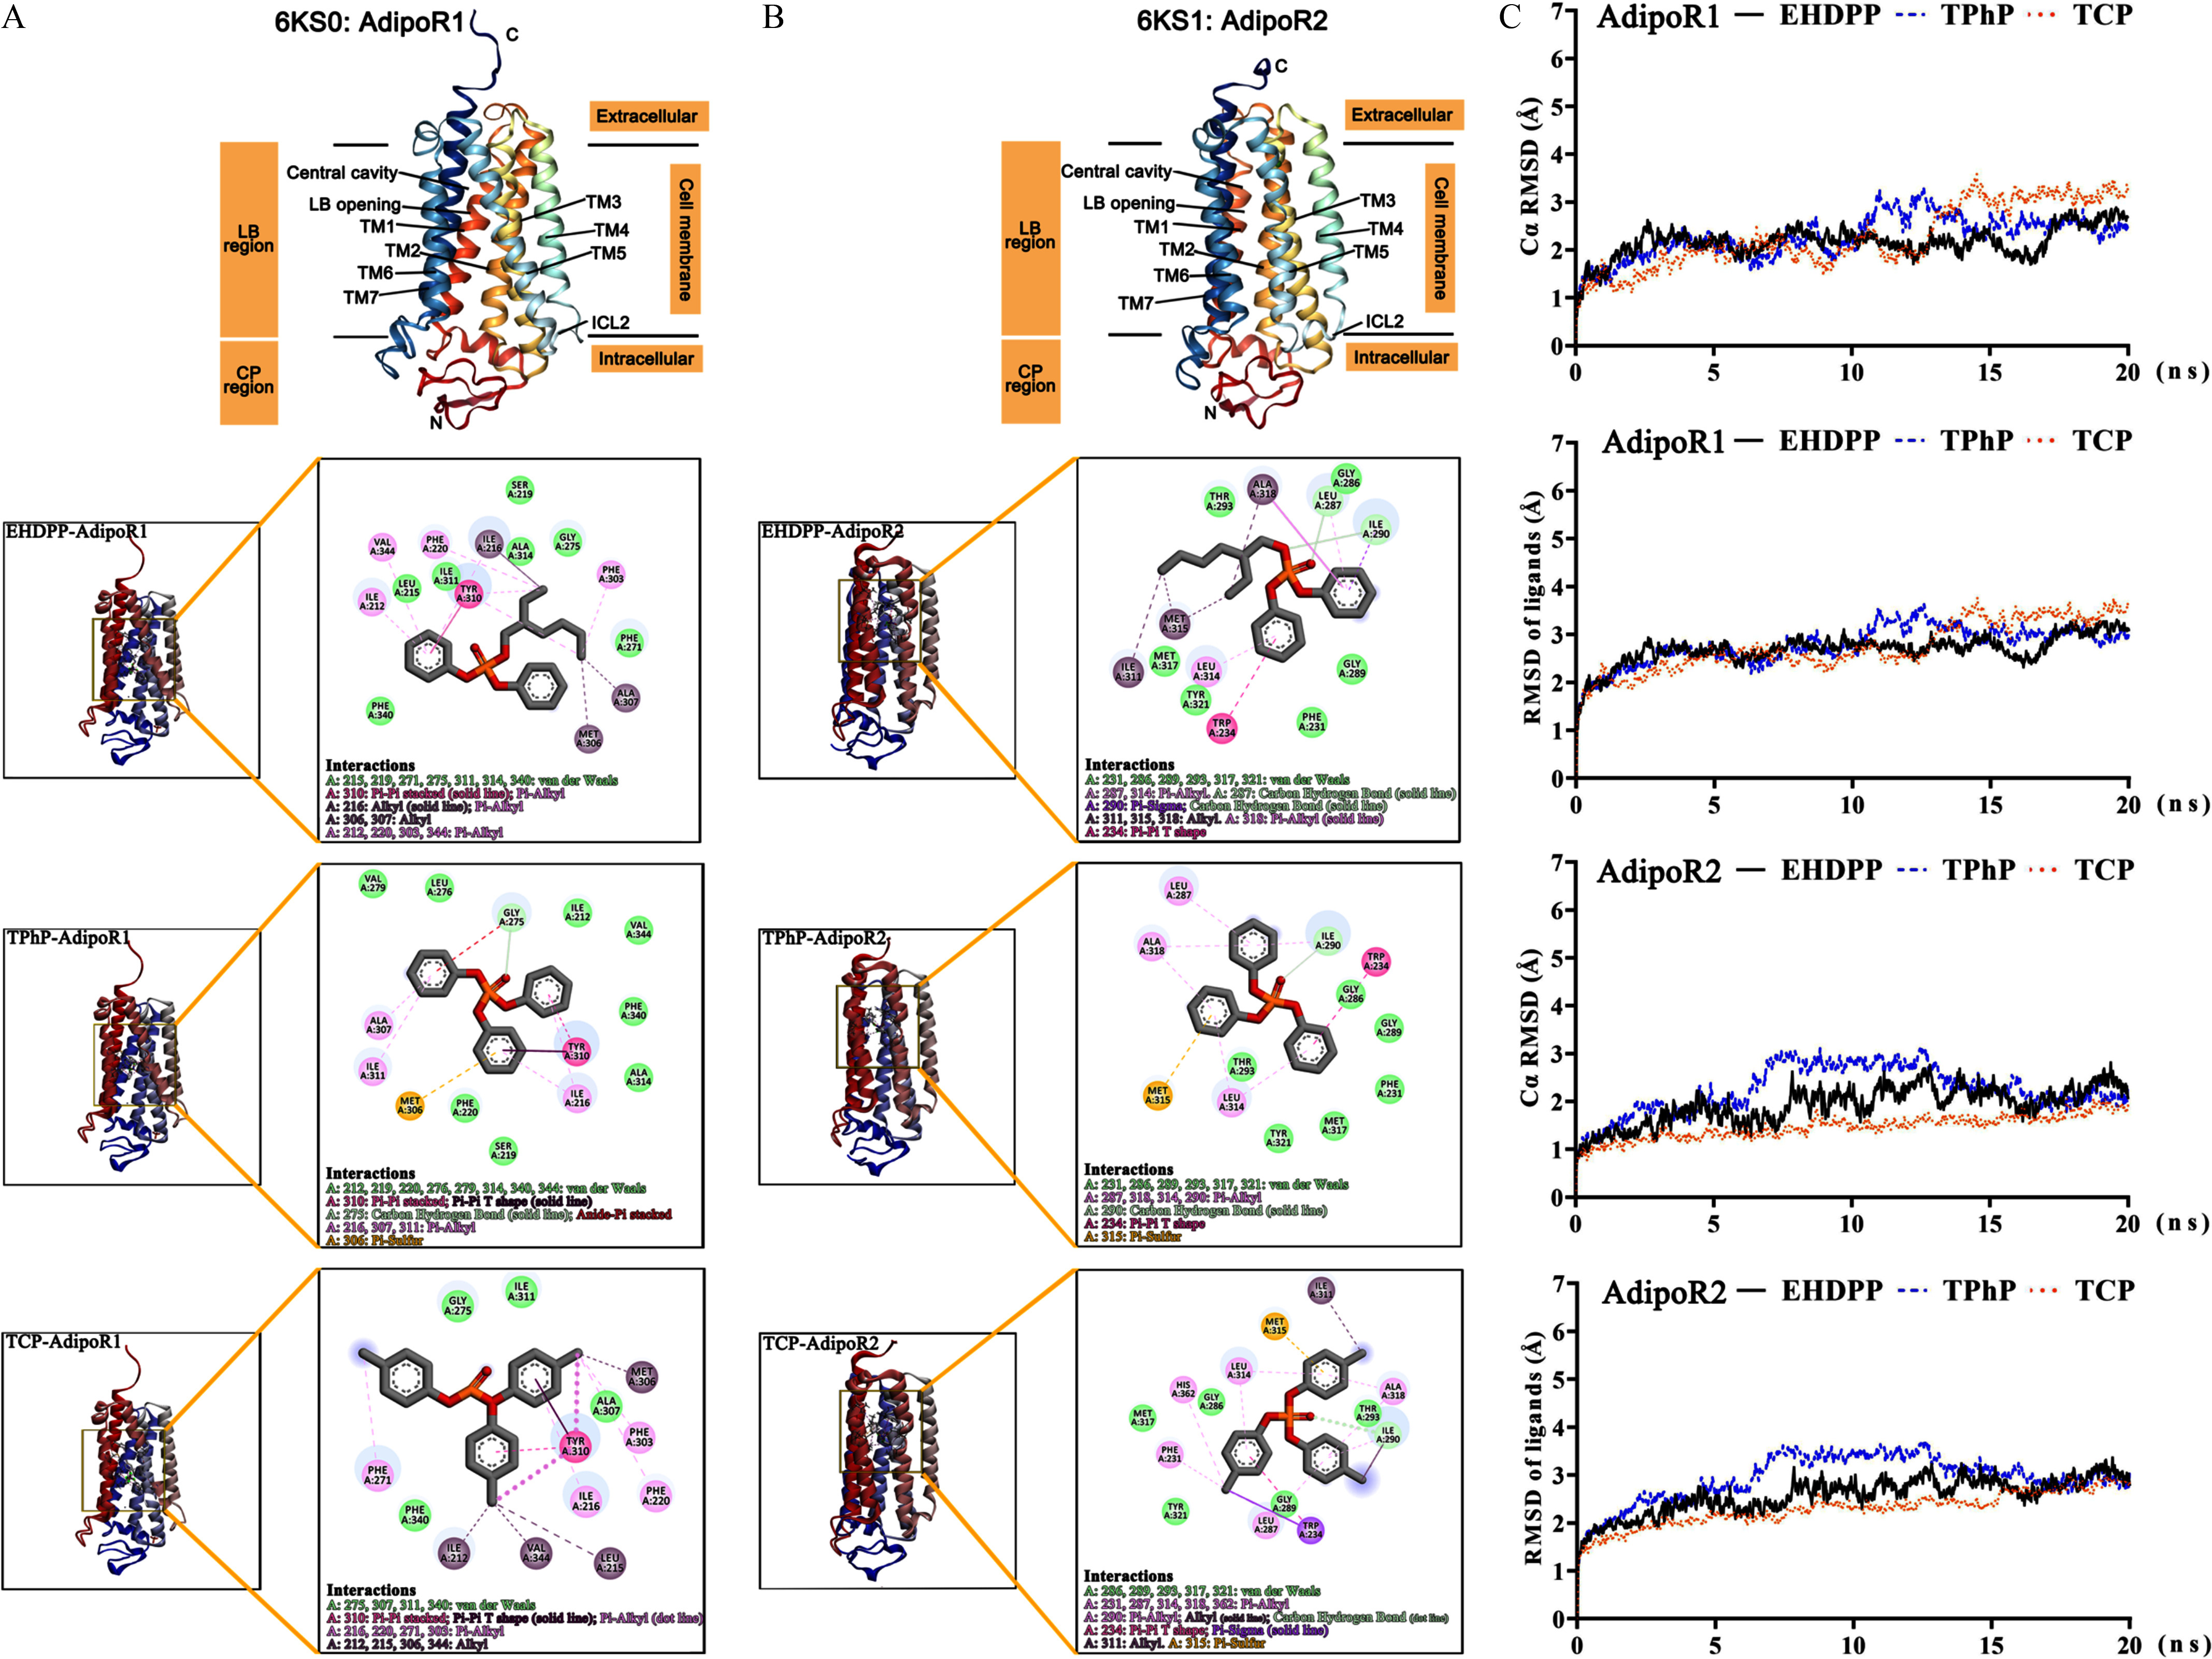
Molecular docking and molecular dynamics simulation of AdipoRs with three aryl-OPFRs. The crystal structures of AdipoRs are displayed as seven helices in the cartoon model. The boxed insets demonstrate the position of the ligand in the cavities of (A) AdipoR1 and (B) AdipoR2. The hydrogen bond, pi–pi stacking, salt bridge, halogen bond, and hydrophobic interaction, among other characteristics, are displayed in colored dotted lines. Molecular dynamics simulation of interactions of AdipoR1 (A) and AdipoR2 (B) with three aryl-OPFRs, and (C) changes in the root mean-square deviation (RMSD) of the ligands for AdipoRs in 20-ns molecular dynamics simulation. The corresponding data are presented in Excel Table S1. The 3D structures of AdipoR1 and AdipoR2 used for molecular docking were obtained from the Protein Data Bank (PDB).37,38 Using AutoDock Vina software41,42 (version 1.1.2), we converted these 3D structures into 2D representations, adjusted the coloring, and labeled different parts of the AdipoRs to generate (A) and (B). Note: 2D, two dimensional; 3D, three dimensional; AdipoR1, adiponectin receptor 1; AdipoR2, adiponectin receptor 2; CP, cytoplasmic region; EHDPP, 2-ethylhexyl diphenyl phosphate; ICL, intracellular loop; LB, lipid bilayer; OPFR, organophosphorus flame retardant; TCP, tricresyl phosphate; TM, transmembrane; TPhP, triphenyl phosphate.
Table 1.
The binding energy and binding site of OPFRs to AdipoRs.
| Chemical name | △G_total (docking score)a | Binding siteb | Interactions | |||
|---|---|---|---|---|---|---|
| AdipoR1 | AdipoR2 | AdipoR1 | AdipoR2 | AdipoR1 | AdipoR2 | |
| aryl-OPFRs | ||||||
| EHDPP | () | () | Helix III/V/VI/VII, ECL | Helix III/V/VI, ECL | Van der Waals, pi–pi stacked, alkyl, pi–alkyl | Van der Waals, carbon hydrogen bond, pi–sigma, pi–pi T-shaped, alkyl, pi–alkyl |
| TPhP | () | () | Helix III/V/VI/VII | Helix III/V/VI | Van der Waals, carbon hydrogen bond, pi–sulfur, pi–pi stacked, pi–pi T-shaped, amide–pi stacked, pi–alkyl | Van der Waals, carbon hydrogen bond, pi–sulfur, pi–pi T-shaped, pi–alkyl |
| TCP | () | () | Helix III/V/VI/VII, ECL | Helix III/V/VI, ECL | Van der Waals, pi–pi stacked, pi–pi T-shaped, pi–alkyl, alkyl | Van der Waals, carbon hydrogen bond, pi–sigma, pi–pi T-shaped, pi–sulfur, alkyl, pi–alkyl |
| Cl-OPFRs | ||||||
| TDCPP | () | () | Helix III/V/VI, ECL | Helix II/III, ICL, CP region | Van der Waals, carbon hydrogen bond | Van der Waals, carbon hydrogen bond |
| TCPP | () | () | Helix II/VI/VII, ICL, CP region | Helix I/VII | Van der Waals, attractive charge, conventional hydrogen bond, carbon hydrogen bond, pi–sigma, pi–alkyl | Van der Waals, carbon hydrogen bond, alkyl, pi–alkyl |
| TCEP | () | () | Helix III/V/VI/VII, ECL | Helix III/V/VI/VII | Van der Waals, carbon hydrogen bond | Van der Waals, carbon hydrogen bond |
| alkyl-OPFRs | ||||||
| TBP | () | () | Helix III/V/VI/ VII, ECL | Helix III/V/VI | Van der Waals, alkyl, pi–alkyl | Van der Waals, carbon hydrogen bond, alkyl, pi–alkyl |
| TBEP | () | () | Helix II/VII, ICL, CP region | Helix III/V/VI, ECL | Van der Waals, attractive charge, conventional hydrogen bond, carbon hydrogen bond, alkyl, pi–alkyl | Van der Waals, carbon hydrogen bond, alkyl, pi–alkyl, conventional hydrogen bond |
Note: para-TCP was used in molecular docking. AdipoR1, adiponectin receptor 1; AdipoR2, adiponectin receptor 2; CP region, cell plasma region; ECL, extracellular loop connects the helix; EHDPP, 2-ethylhexyl diphenyl phosphate; ICL, intracellular loop connects the helix; △G_total, the binding free energy; OPFRs, organophosphorus flame retardants; TBEP, tris(2-butoxyethyl) phosphate; TBP, tri--butyl phosphate; TCEP, tris(2-chloroethyl) phosphate; TCP, tricresyl phosphate; TCPP, tris(1-chloro-2-propyl) phosphate; TDCPP, tris (1,3-dichloro-2-propyl) phosphate; TPhP, triphenyl phosphate.
Unit Kcal/mol.
I–VII represent the seven helixes across the lipid bilayer.
Molecular dynamics simulation was used to assess the binding stability of the AdipoR–ligand complexes. As depicted in Figure 1C, the RMSD and C curves of the AdipoR complexes with aryl-OPFRs achieved relatively stable states following a 20-ns molecular dynamics simulation. The fluctuation distance of the curves for TCEP, TDCPP, and TBP were notably larger compared with the other compounds during the simulation (Figure S5C). The C curves of the TCEP-, TDCPP-, TBP-, and TBEP-AdipoR1 complexes were higher than those of the AdipoR2 complexes.
The binding free energies and the docking scores are listed in Table 1. Generally, a lower binding free energy points to a higher binding affinity. The binding affinities of OPFRs followed the order of in binding to AdipoR1, and in binding to AdipoR2 (Table 1). A docking score suggests a high binding affinity.57 Notably, based on the docking scores observed, only EHDPP, TCP, and TPhP exhibited significant binding affinities to the AdipoRs.
Thermal Stability in Shift Assays of Cell Lysates after Exposure to OPFRs
We used the CETSA to verify whether OPFRs were capable of strengthening the thermal stability of both AdipoR1 and AdipoR2 proteins. After heating the cell lysate under a panel of temperatures, the protein levels of AdipoRs in soluble extracts were gradually lower, with higher temperatures in both cell lysates exposed to chemicals and those exposed to the vehicle (Figure S7). Approximately of AdipoR1 in the control group precipitated at 52°C (Figure 2A). In contrast, the precipitation temperature of AdipoR1 was in the presence of EHDPP, TPhP, and TCP (Figure 2A). A rightward shift of the melting curves was observed in cell shift assays with the three aryl-OPFRs (Figure 2A). The for EHDPP, TPhP, and TCP was calculated at temperatures of 5.20°C, 4.10°C, and 3.20°C, respectively (Table 2). For the other tested OPFRs and the control groups, the melting curves almost overlapped (Figure 2A). AdipoR2 itself was more stable than AdipoR1 upon heating, given that its half precipitate temperature surpassed 55°C even without a ligand (Figure 2A). We also found that the thermal stability of AdipoR2 was greater when cells were exposed to EHDPP, TPhP, and TCP, as suggested by immunoblotting (Figure S7) and according to the melting curves (Figure 2B). The for EHDPP, TPhP, and TCP was higher at a temperature of 4.60°C, 5.90°C, and 4.30°C, respectively (Table 2). Unlike AdipoR1, the thermal stability of AdipoR2 was also slightly higher after exposure to TDCPP (rightward shift in the melting curve at 2.20°C), TCPP (rightward shift at 1.60°C), and TBEP (rightward shift at 1.10°C) (Table 2, Figure 2B). TCEP- and TBP-exposed cells did not differ from control cells in terms of AdipoR2 thermal stability, suggesting no physical interaction between these chemicals and AdipoR2.
Figure 2.
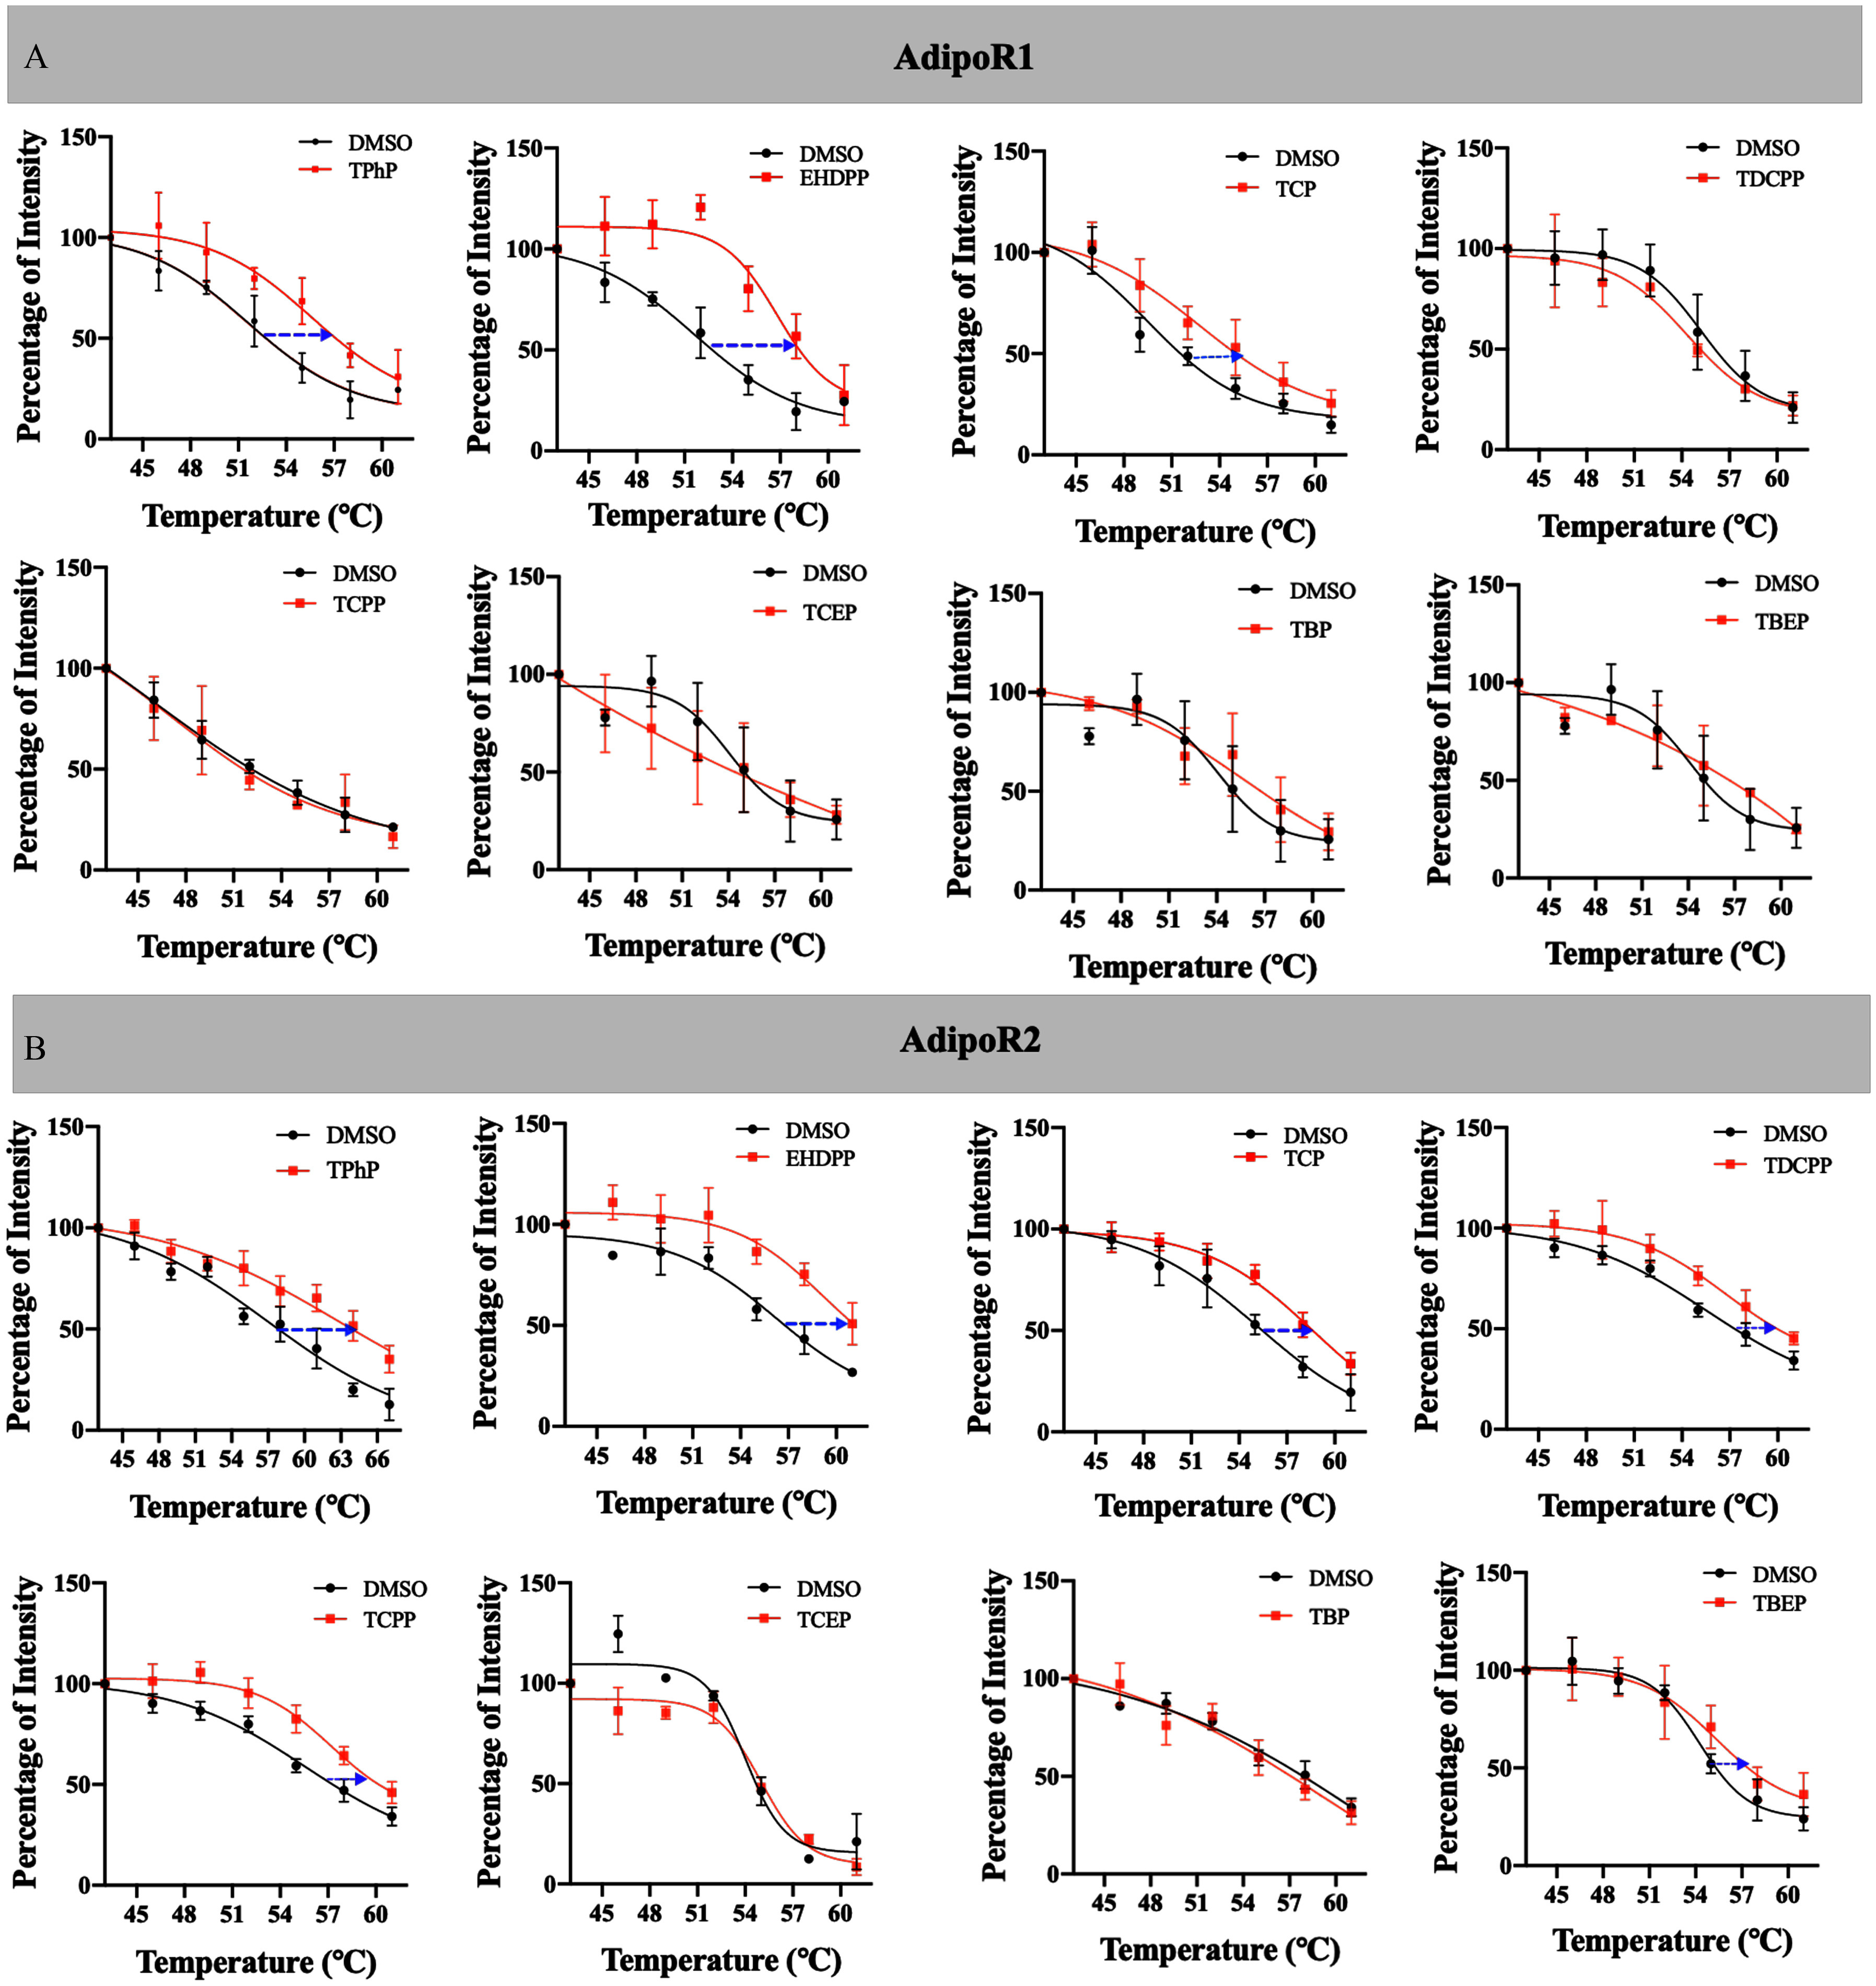
Thermal shift assays in cell lysate after treatment with OPFRs. The cell lysate was incubated with the compounds and heated under a panel of temperatures (43°C, 46°C, 49°C, 52°C, 55°C, 58°C, and 61°C). The supernatant was evaluated via Western blot (/group). After quantifying the density of the protein bands, the density at 43°C was established as the 100% reference point. The melting curves for (A) AdipoR1 and (B) AdipoR2 were then prepared by fitting to a Boltzmann sigmoidal curve. Data are presented as . The dashed arrow represents a rightward shift at 50% protein aggregation (). Data in (A) and (B) are presented in Excel Table S2. Note: AdipoR1, adiponectin receptor 1; AdipoR2, adiponectin receptor 2; DMSO, dimethyl sulfoxide; EHDPP, 2-ethylhexyl diphenyl phosphate; OPFR, organophosphorus flame retardant; SD, standard deviation; TBEP, tris(2-butoxyethyl) phosphate; TBP, tri--butyl phosphate; TCEP, tris(2-chloroethyl) phosphate; TCP, tricresyl phosphate; TCPP, tris(1-chloro-2-propyl) phosphate; TDCPP, tris (1,3-dichloro-2-propyl) phosphate; TPhP, triphenyl phosphate.
Table 2.
The temperatures at which a rightward shift in the melting curve was induced at 50% protein aggregation of each AdipoR after treatment with OPFRs.
| EHDPP | TPhP | TCP | TDCPP | TCPP | TCEP | TBP | TBEP | |
|---|---|---|---|---|---|---|---|---|
| (°C) | ||||||||
| AdipoR1 | 5.20 | 4.10 | 3.20 | NA | NA | NA | NA | NA |
| AdipoR2 | 4.60 | 5.90 | 4.30 | 2.20 | 1.60 | NA | NA | 1.10 |
Note: was calculated as at 50% protein aggregation in melting curve., change; AdipoR1, adiponectin receptor 1; AdipoR2, adiponectin receptor 2; EHDPP, 2-ethylhexyl diphenyl phosphate; NA, not available at the testing temperatures; OPFR, organophosphorus flame retardant; , temperature at which 50% protein precipitation was observed; TBEP, tris(2-butoxyethyl) phosphate; TBP: tri--butyl phosphate; TCP, tricresyl phosphate; TCPP, tris(1-chloro-2-propyl) phosphate, TCEP, tris(2-chloroethyl) phosphate; TDCPP, tris (1,3-dichloro-2-propyl) phosphate; TPhP, triphenyl phosphate.
The Noncompetitive Binding Detection between FITC-ADP355 and OPFRs to AdipoRs
To verify whether chemical spatial occupation interferes with endogenous ligand binding to AdipoRs, we conducted a noncompetitive binding assay using a fluorescent-labeled adiponectin receptor endogenous ligand, FITC-ADP355 (Figure S3). Illustrative noncompetitive binding curves are shown in Figure 3A. In assays with WT mouse AML 12 cells, we found a well-fitting inhibition curve for EHDPP, TPhP, TCP, and TCPP, with a concentration of , , , and , respectively (Table 3). No could be obtained in assays with TDCPP, TCEP, TBP, and TBEP (Table 3).
Figure 3.

The noncompetitive binding assay between OPFRs and FITC-labeled endogenous ligand ADP355 to AdipoRs. WT AML 12 cells were pretreated with serial concentrations of OPFRs for 4 h followed by 2-h incubation with FITC-ADP355. The fluorescence intensity in the control group was set at 100% as the reference point. Data are presented as . (A) The decline in relative fluorescence intensity at serial concentrations of OPFRs was fitted to an [inhibitor] vs. response three-parameters curve (/group). (B) The positive compounds were further chosen to perform the noncompetitive assays in AdipoR1- or AdipoR2-knockdown cells (/group). represents the siRNA knockdown of AdipoR1; represents the siRNA knockdown of AdipoR2. Data in (A) and (B) are presented in Excel Table S3. Note: AdipoR1, adiponectin receptor 1; AdipoR2, adiponectin receptor 2; ADP355, adiponectin-based peptide; AML 12, alpha mouse liver 12 (cell line); EHDPP, 2-ethylhexyl diphenyl phosphate; FITC, fluorescein isothiocyanate; OPFR, organophosphorus flame retardant; SD, standard deviation; siRNA, small interfering RNA; TBEP, tris(2-butoxyethyl) phosphate; TBP, tri--butyl phosphate; TCEP, tris(2-chloroethyl) phosphate; TCP, tricresyl phosphate; TCPP, tris(1-chloro-2-propyl) phosphate; TDCPP, tris (1,3-dichloro-2-propyl) phosphate; TPhP, triphenyl phosphate; WT, wild type.
Table 3.
Concentrations of OPFRs at a 20% reduction of the fluorescence intensity of FITC-ADP355 in noncompetitive binding assay.
| Chemical name | |||
|---|---|---|---|
| AdipoRsa | AdipoR1b | AdipoR2c | |
| EHDPP | |||
| TPhP | |||
| TCP | |||
| TDCPP | NA | ND | ND |
| TCPP | |||
| TCEP | NA | ND | ND |
| TBP | NA | ND | ND |
| TBEP | NA | ND | ND |
Note: Chemicals that failed to compete with FITC-ADP355 in WT AML 12 cells were not further detected in gene knockout cells. AdipoR1, adiponectin receptor 1; AdipoR2, adiponectin receptor 2; ADP355, adiponectin-based peptide; AML 12, alpha mouse liver 12 (cell line); , benchmark dose at 20% reduction of the florescence intensity in noncompetitive assay; EHDPP, 2-ethylhexyl diphenyl phosphate; FITC, fluorescein isothiocyanate; NA, not available at the testing concentrations (maximum concentration, ); ND, not detected; OPFR, organophosphorus flame retardant; TBEP, tris(2-butoxyethyl) phosphate; TBP, tri--butyl phosphate; TCEP, tris(2-chloroethyl) phosphate; TCP, tricresyl phosphate; TCPP, tris(1-chloro-2-propyl) phosphate; TDCPP, tris (1,3-dichloro-2-propyl) phosphate; TPhP, triphenyl phosphate; WT, wild type.
WT AML 12 cells.
AML 12 with AdipoR2 knockdown.
AML 12 with AdipoR1 knockdown.
We also performed immunoblotting of the cells from the three aryl-OPFR treatment groups to ascertain their noncompetitive binding and exclude the possibility of false positive interference. The lower fluorescence intensity and lower protein levels of FITC-ADP355–coupled AdipoRs suggested that binding of the ligand to the AdipoRs was noncompetitively inhibited (Figure S8).
We further constructed AdipoR1- or AdipoR2-knockdown AML 12 cells to investigate the different affinity between the effective chemicals and these two receptors. As shown in Figure 3B and Table 3, the of AdipoR1 was 1 order of magnitude higher than that of AdipoR2 upon treatment with the aryl-OPFRs. However, the of AdipoR1 was lower than that of AdipoR2 in TCPP-treated cells. The noncompetitive binding potency of aryl-OPFRs in AML 12 cells was found to be comparable to that in AdipoR2-knockdown cells, indicating that FITC-ADP355 may have a higher affinity for AdipoR1.
Impact of OPFRs on Lipid Accumulation and Glucose Uptake in AML 12 Cells
Disrupting AdipoR signaling impairs glycolipid disposal in target cells.58–60 Thus, we selected lipid accumulation and glucose uptake as the key events of AdipoR interference in the AML 12 cell line. Because no antagonist for AdipoRs was identified, we initially employed recombinant plasmids of siRNA to knockdown AdipoR1, AdipoR2, or both receptors in WT mouse AML 12 cells and subsequently measured lipid levels. The results revealed greater lipid accumulation within AdipoR-depleted AML 12 cells (Figure S9A). A time- and dose-dependent lipid accumulation could be observed in some of the OPFR-treated groups (Figure 4A). The lipid droplets in the three aryl-OPFR–treated groups and the TDCPP-treated group exceeded 2-fold of that in the control groups at a concentration of after 12 h of incubation. The lipid content in aryl-OPFR (EHDPP and TCP)–treated cells was doubled after 24 h, with the threshold of induction noted at a concentration of . The significant effect of TPhP and TDCPP on lipid accumulation persisted from 12 h to 24 h. None of these four chemicals were associated with a decline in AdipoR gene expression (Figure S9B).
Figure 4.
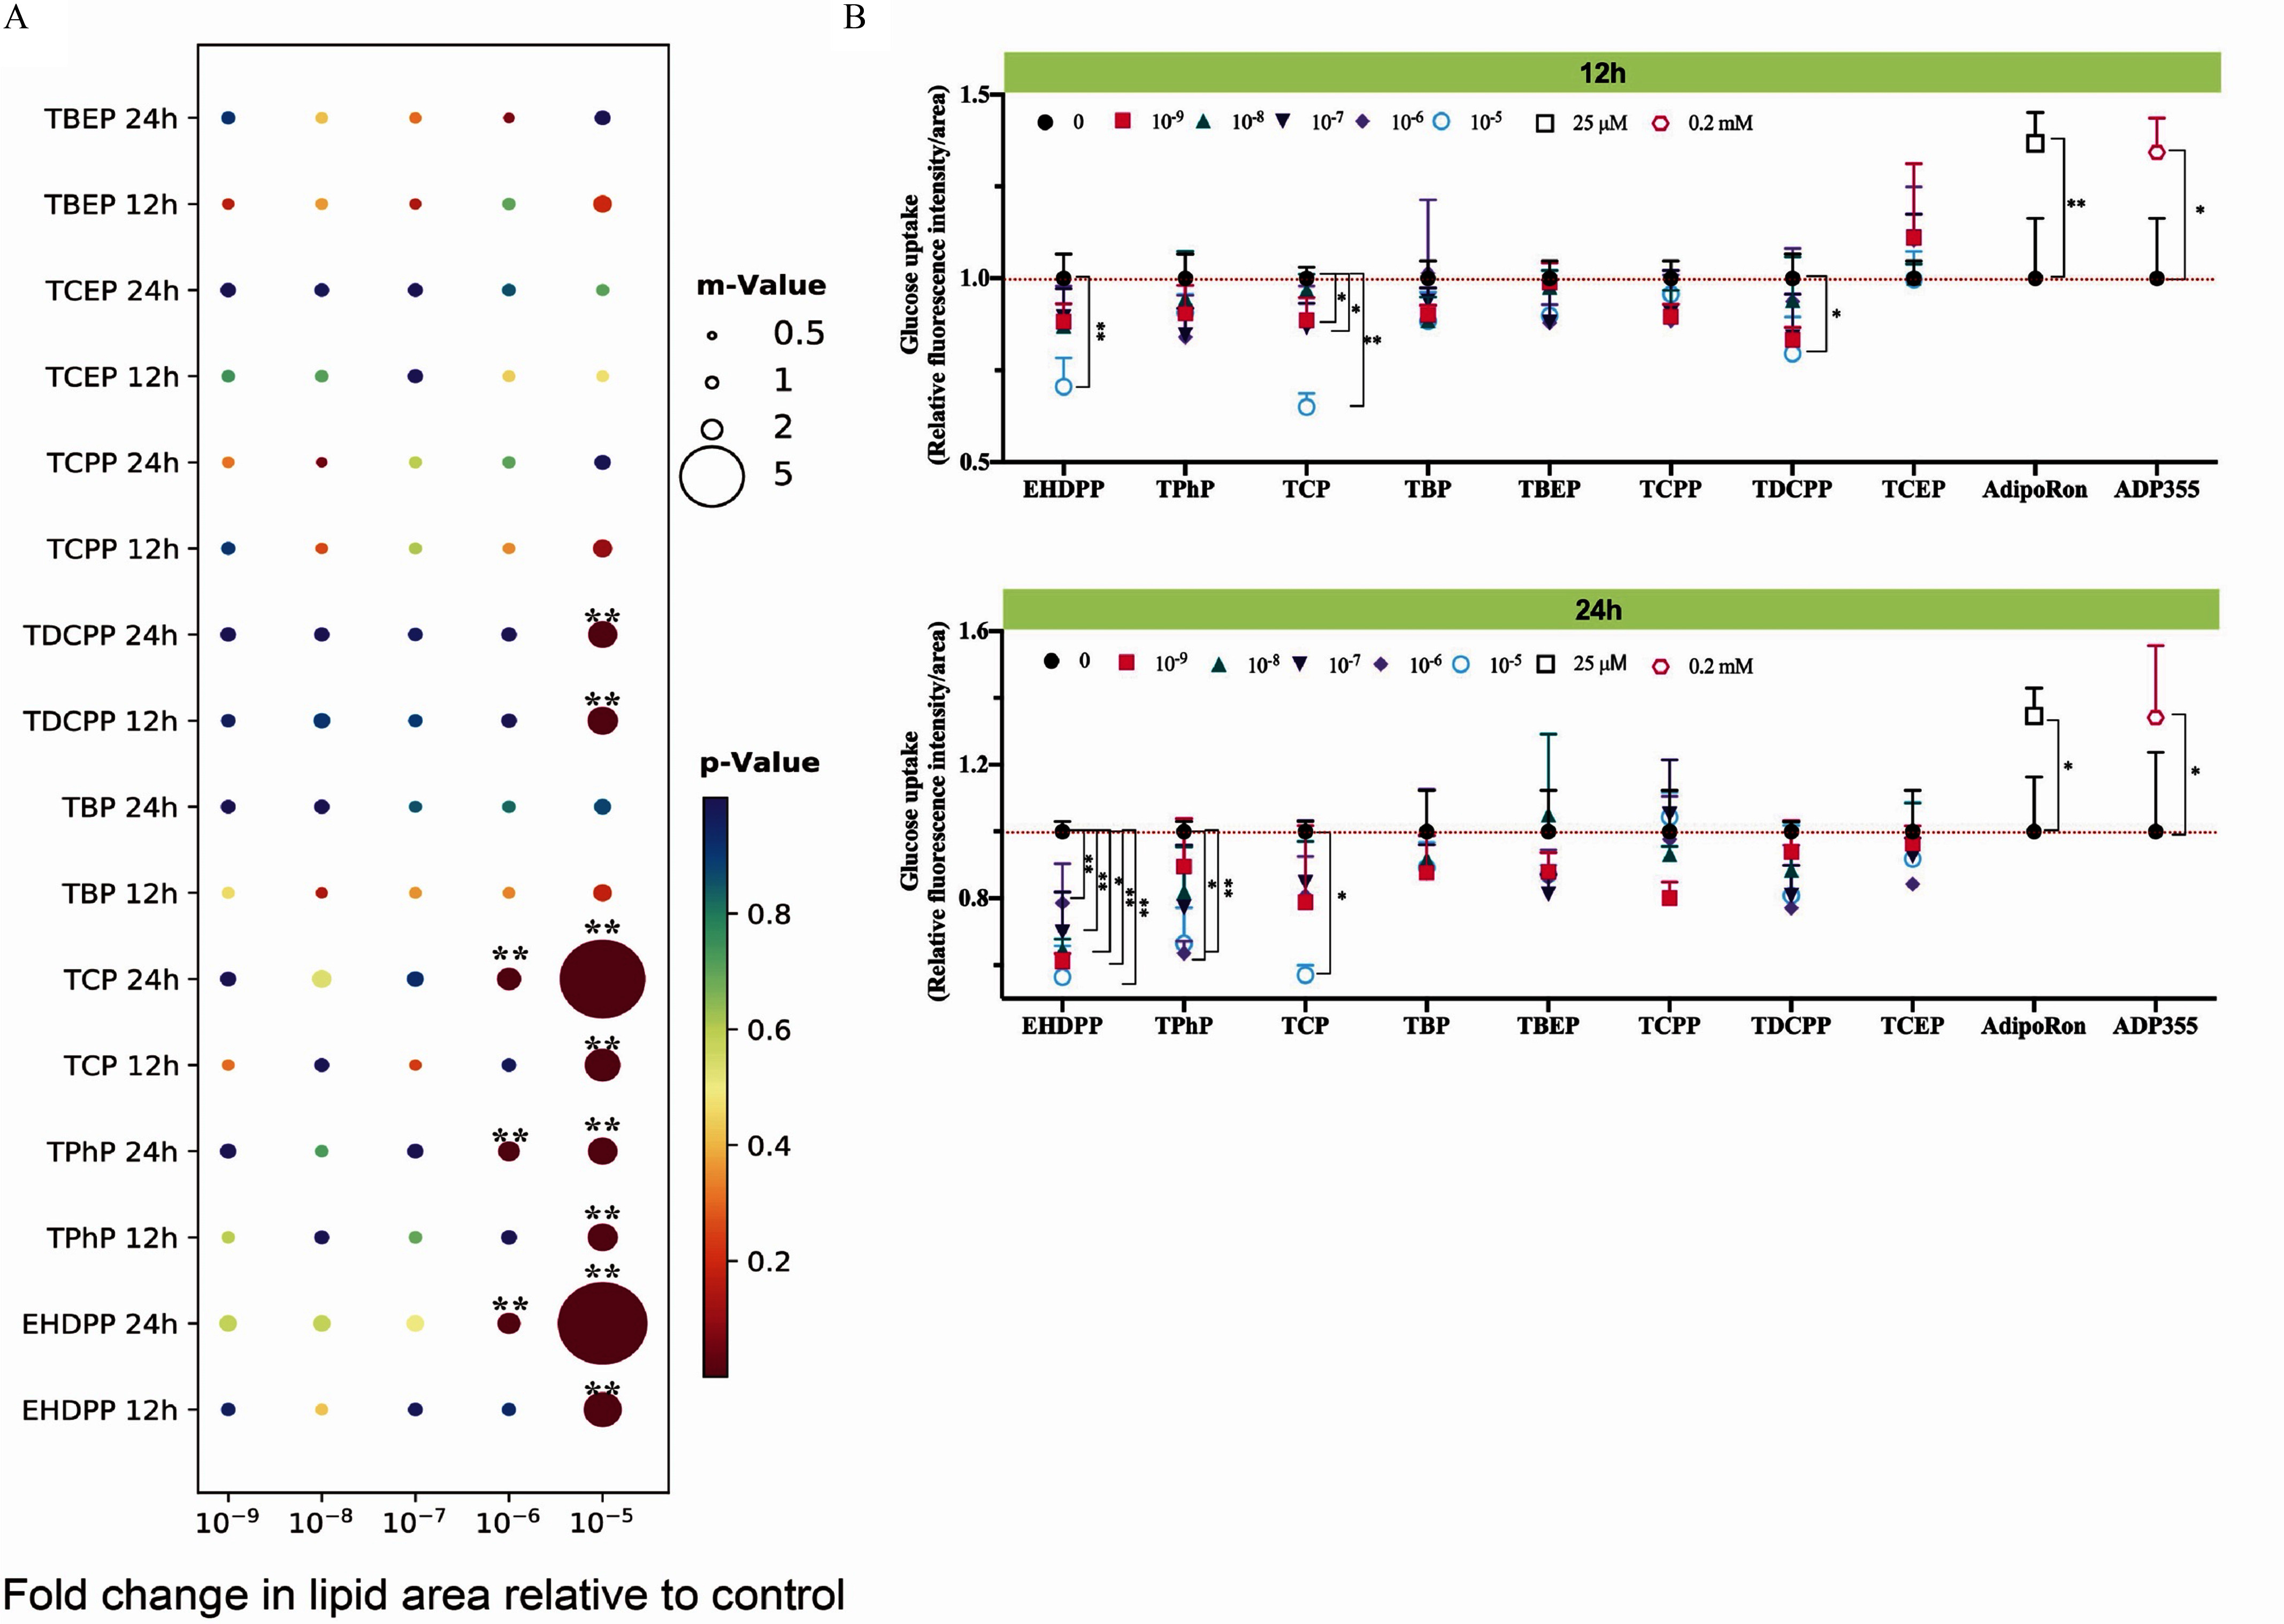
Lipid accumulation and glucose uptake in AML 12 cells with exposure to OPFRs. (A) Effect of OPFRs on the lipogenesis (/group) and (B) glucose uptake (/group) at different treatment times. Cells were treated with different concentrations of OPFRs for 12 h or 24 h. Cells were double stained with BODIPY 493/503 () and Hoechst 33324 (). The color of the circle represents the -value, and the size of the circle represents the relative lipid area when compared with vehicle control (set at 1.0). Glucose uptake was performed using the Glucose Uptake Assay Kit (DOJINDO). The corresponding data are presented in Excel Table S4 and displayed as . Note: AdipoRon, agonist of the adiponectin receptor 1 and adiponectin receptor 2; ADP355, adiponectin-based peptide; AML 12, alpha mouse liver 12 (cell line); ANOVA, analysis of variance; DMSO, dimethyl sulfoxide; EHDPP, 2-ethylhexyl diphenyl phosphate; OPFR, organophosphorus flame retardant; SD, standard deviation; TBEP, tris(2-butoxyethyl) phosphate; TBP, tri--butyl phosphate; TCEP, tris(2-chloroethyl) phosphate; TCP, tricresyl phosphate; TCPP, tris(1-chloro-2-propyl) phosphate; TDCPP, tris (1,3-dichloro-2-propyl) phosphate; TPhP, triphenyl phosphate. Statistical comparisons were performed using a one-way ANOVA with Dunnett’s multiple comparisons test: *, ** compared with vehicle control (0.1% DMSO).
In contrast, exposure to OPFRs resulted in a lower glucose uptake (Figure 4B). Analyses showed a 30% and 36% lower glucose uptake with EHDPP and TCP treatments, respectively, at a concentration of after 12 h. Levels of glucose were slightly, but significantly, lower (), in TDCPP-treated groups under the highest concentration. Increasing the exposure duration led to lower glucose in all aryl-OPFR–treated cells. Drastically lower glucose uptake was observed in EHDPP-treated cells at all of the tested concentrations. The differences in glucose uptake in TPhP-exposed cells were apparent at concentrations of , resulting in lower glucose uptake. Furthermore, exposure to the AdipoR agonists, including AdipoRon and ADP355, resulted in higher glucose uptake (Figure 4B).
ToxPi Scores
Given that chemical responses were not always consistent across the different assays, we applied the ToxPi model to rank the ability of each tested OPFR to disrupt AdipoR-dependent metabolism homeostasis. The three aryl-OPFRs were active in all of the tested assays, and they ranked as the compounds with the top three highest ToxPi scores (Figure 5A,B). The ToxPi scores and ranks of EHDPP, TCP, and TPhP were 1.0000 (rank 8), 0.8798 (rank 7), and 0.7771 (rank 6), respectively, in interactions with AdipoR1, and 0.9966 (rank 8), 0.8860 (rank 7), and 0.7080 (rank 6), respectively, in interactions with AdipoR2. TCPP, TDCPP, and TBEP scored positively in two or three assays, being assigned intermediate ToxPi scores (scores ), whereas TCEP and TBP had low ToxPi scores in relation to their effects on AdipoR1 and AdipoR2 signaling. Taken together, these findings indicate that the rank order of ToxPi scores for the eight OPFRs was as follows: in interactions with AdipoR1, and in interactions with AdipoR2.
Figure 5.
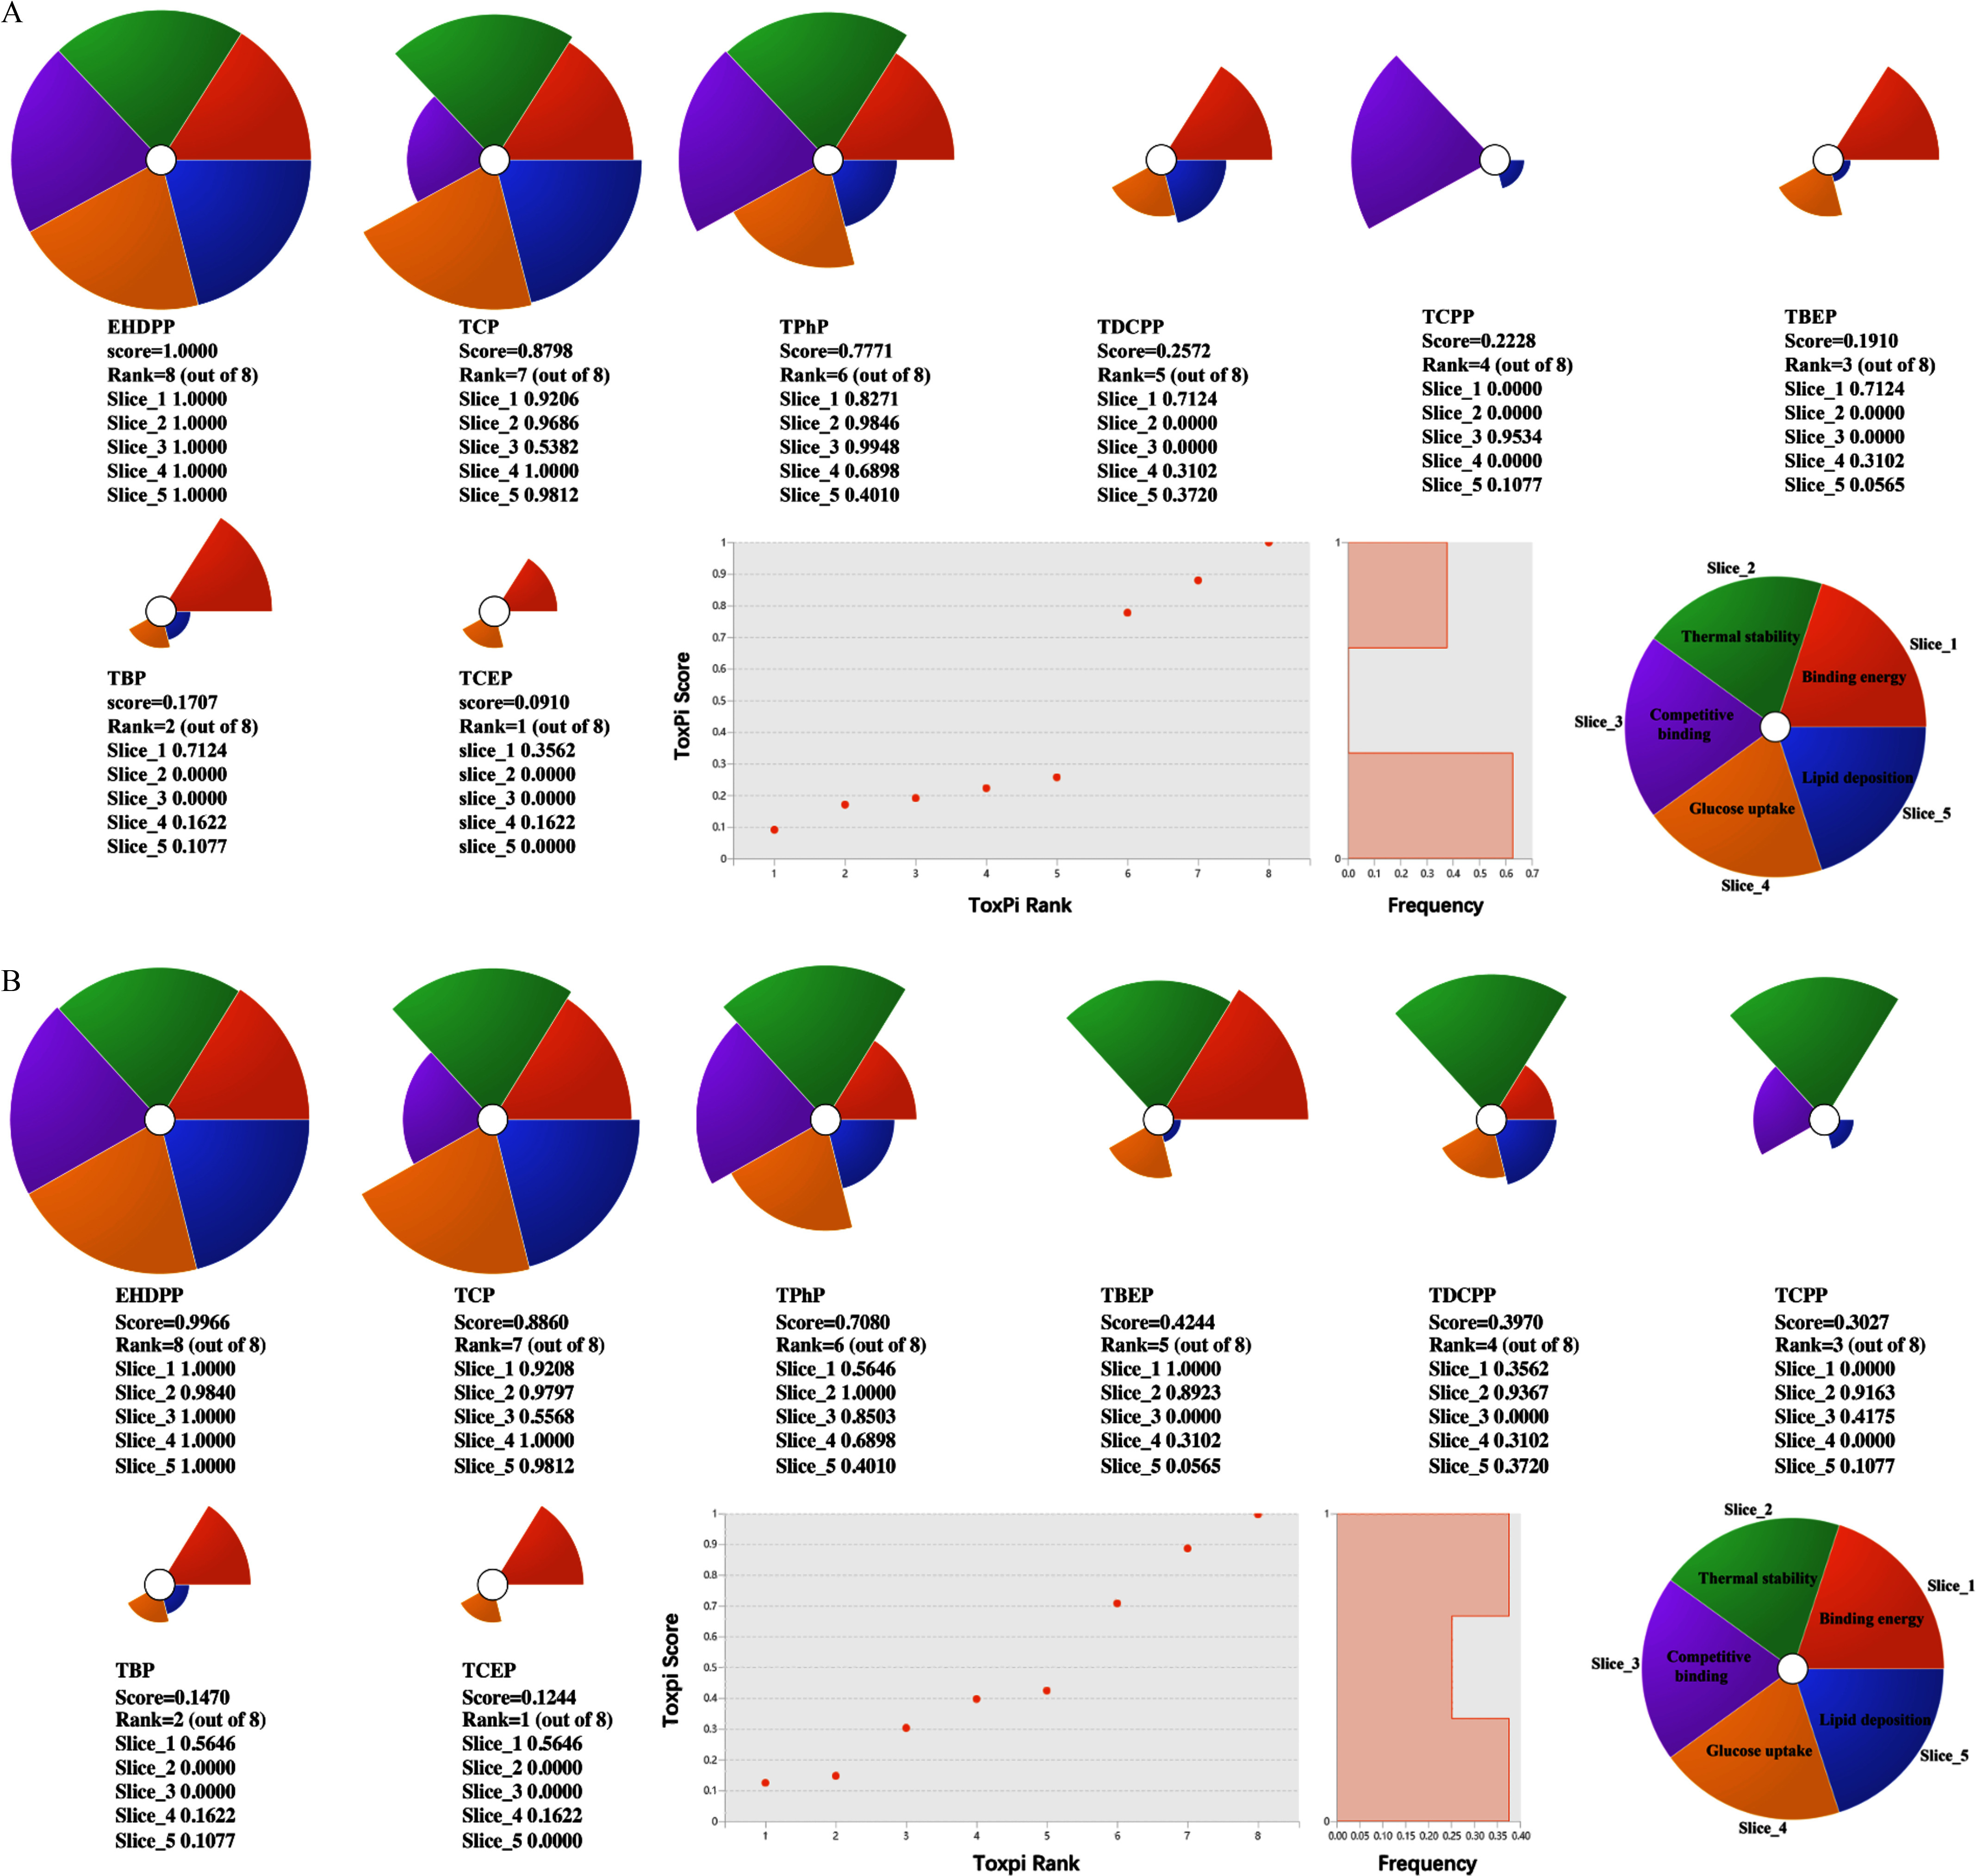
ToxPi scores of OPFRs for ranking potency of interference with AdipoRs. Nightingale Rose diagram of scoring categories in interactions of OPFRs with (A) AdipoR1 and (B) AdipoR2. Each colored slice represents its corresponding assay. Slice 1 (tangerine sector) represents binding affinity; slice 2 (green sector) represents thermal stability; slice 3 (purple sector) represents noncompetitive binding ability; slice 4 (yellow sector) represents glucose uptake; and slice 5 (blue sector) represents lipid deposition. The size of the slice reflects the ToxPi score from a series of calculations that build in the ToxPi Graphical User Interface. Low-scoring slices indicate low active, and negative-scoring slices indicate inactive in the corresponding assays. The circle plot represents of the ToxPi rank for OPFRs. The circle represents different chemicals. Note: AdipoR1, adiponectin receptor 1; AdipoR2, adiponectin receptor 2; EHDPP, 2-ethylhexyl diphenyl phosphate; OPFR, organophosphorus flame retardant; TBEP, tris(2-butoxyethyl) phosphate; TBP, tri--butyl phosphate; TCEP, tris(2-chloroethyl) phosphate; TCP, tricresyl phosphate; TCPP, tris(1-chloro-2-propyl) phosphate; TDCPP, tris (1,3-dichloro-2-propyl) phosphate; ToxPi, Toxicological Prioritization Index; TPhP, triphenyl phosphate.
Thermal Stability of AdipoRs in WT Mice and Effects on Glucose Disposal in db/db Mice after Exposure to aryl-OPFRs
After fully considering the ToxPi scores, we selected the three aryl-OPFRs to perform in vivo (WT mice) investigations. Mice were acutely injected with the three aryl-OPFRs separately, and no obvious signs of discomfort were observed (Figure S10). As illustrated in Figure 6A, levels of both AdipoR1 and AdipoR2 proteins were not different from levels in controls in the presence of the three aryl-OPFRs, suggesting that these three compounds exerted no discernible influence on protein transcription following short-term exposure. Intriguingly, notably lower protein levels of both AdipoR1 and AdipoR2 were observed in the EHDPP-, TPhP-, or TCP-treatment groups upon heating at specific temperatures (Figure 6B). The content of AdipoR1 was lower by 24%, 36%, and 36% in the presence of EHDPP, TPhP, and TCP, respectively, whereas AdipoR2 levels were respectively lower by 40%, 24%, and 42% in the presence of these same three chemicals. Accordingly, we posited that noncompetitive inhibition occurs in interactions between aryl-OPFRs and AdipoRs with the adiponectin, which may further interfere with adiponectin/AdipoR signaling.
Figure 6.

Thermal shift assay in mouse liver tissue and the impact on glucose disposal in mouse models upon exposure to aryl-OPFRs. (A) Protein levels (/group) of AdipoRs in liver. (B) Thermal stability of AdipoR1 (/group) and AdipoR2 (/group) at 55°C and 58°C, respectively. The liver was collected after intraperitoneal (i.p.) injection with aryl-OPFRs for 4 h in WT mice. (C) Plasma glucose levels in db/db mice (/group) after i.p. injection with typical aryl-OPFRs (TCP). One hour after injection, the level of blood glucose from the tail vein was measured over 5 h by glucometer. (D) Plasma glucose levels in db/db mice (/group) after i.p. injection with typical aryl-OPFRs (TCP) for 4 h, followed by subcutaneous injection with or without ADP355 (). (E) The area under the curve (AUC) for plasma glucose levels in groups described in (D). Results are presented as . Data in (A–E) are presented in Excel Table S5. The “mouse” and “thermometer” in (A) and (B) were generated using Procreate 5.2.1 (Savage Interactive Pty Ltd., Tas, Australia) by the authors. Note: AdipoR1, adiponectin receptor 1; AdipoR2, adiponectin receptor 2; ADP355, adiponectin-based peptide; ANOVA, analysis of variance; EHDPP, 2-ethylhexyl diphenyl phosphate; GAPDH, glyceraldehyde-3-phosphate dehydrogenase; OPFR, organophosphorus flame retardant; SEM, standard error of the mean; TCP, tricresyl phosphate; TPhP, triphenyl phosphate; WT, wild type. In (A) and (B), statistical comparisons were performed using Student’s -test: *, ** compared with vehicle control (olive oil). In (C) and (D), statistical comparisons were performed using a two-way ANOVA with Bonferroni’s multiple comparisons test. In (E), statistical comparisons were performed using a one-way ANOVA with Tukey’s multiple comparisons test: ## compared with the ADP355 group.
To substantiate this hypothesis, we selected TCP to investigate its impact on the function of the AdipoRs using the db/db mouse model. Short-term TCP exposure resulted in slightly, yet not statistically significantly, lower glucose disposal, as depicted in Figure 6C. In contrast, the mice receiving ADP355 demonstrated higher glucose disposal () over the 7-h detection period, with a pronounced increase in glucose disposal evident from 3 h onward (Figure 6D). However, pretreatment with TCP markedly diminished the extent of glucose disposal induced by ADP355 (Figure 6D,E).
Impact of Typical aryl-OPFR TCP on Glycolipid Metabolism and Signaling Transduction in WT Mice
To assess the inhibitory effects of aryl-OPFRs on AdipoR signaling while ensuring that interference from other toxic mechanisms was minimized, we conducted a short-term co-exposure study in WT mice using coadministration of ADP355 and TCP (Figure 7A). The mice injected with ADP355 did not differ in BW from control mice (Figure S11) but did have lower serum TG levels, an effect that was reversed by pretreatment with TCP (Figure 7B). The mice injected with ADP355 had a markedly greater glucose response in glucose tolerance tests (Figure 7C). Although the TCP pretreatment did not affect the glucose response directly, it negated the effects of ADP355 (Figure 7C,D).
Figure 7.
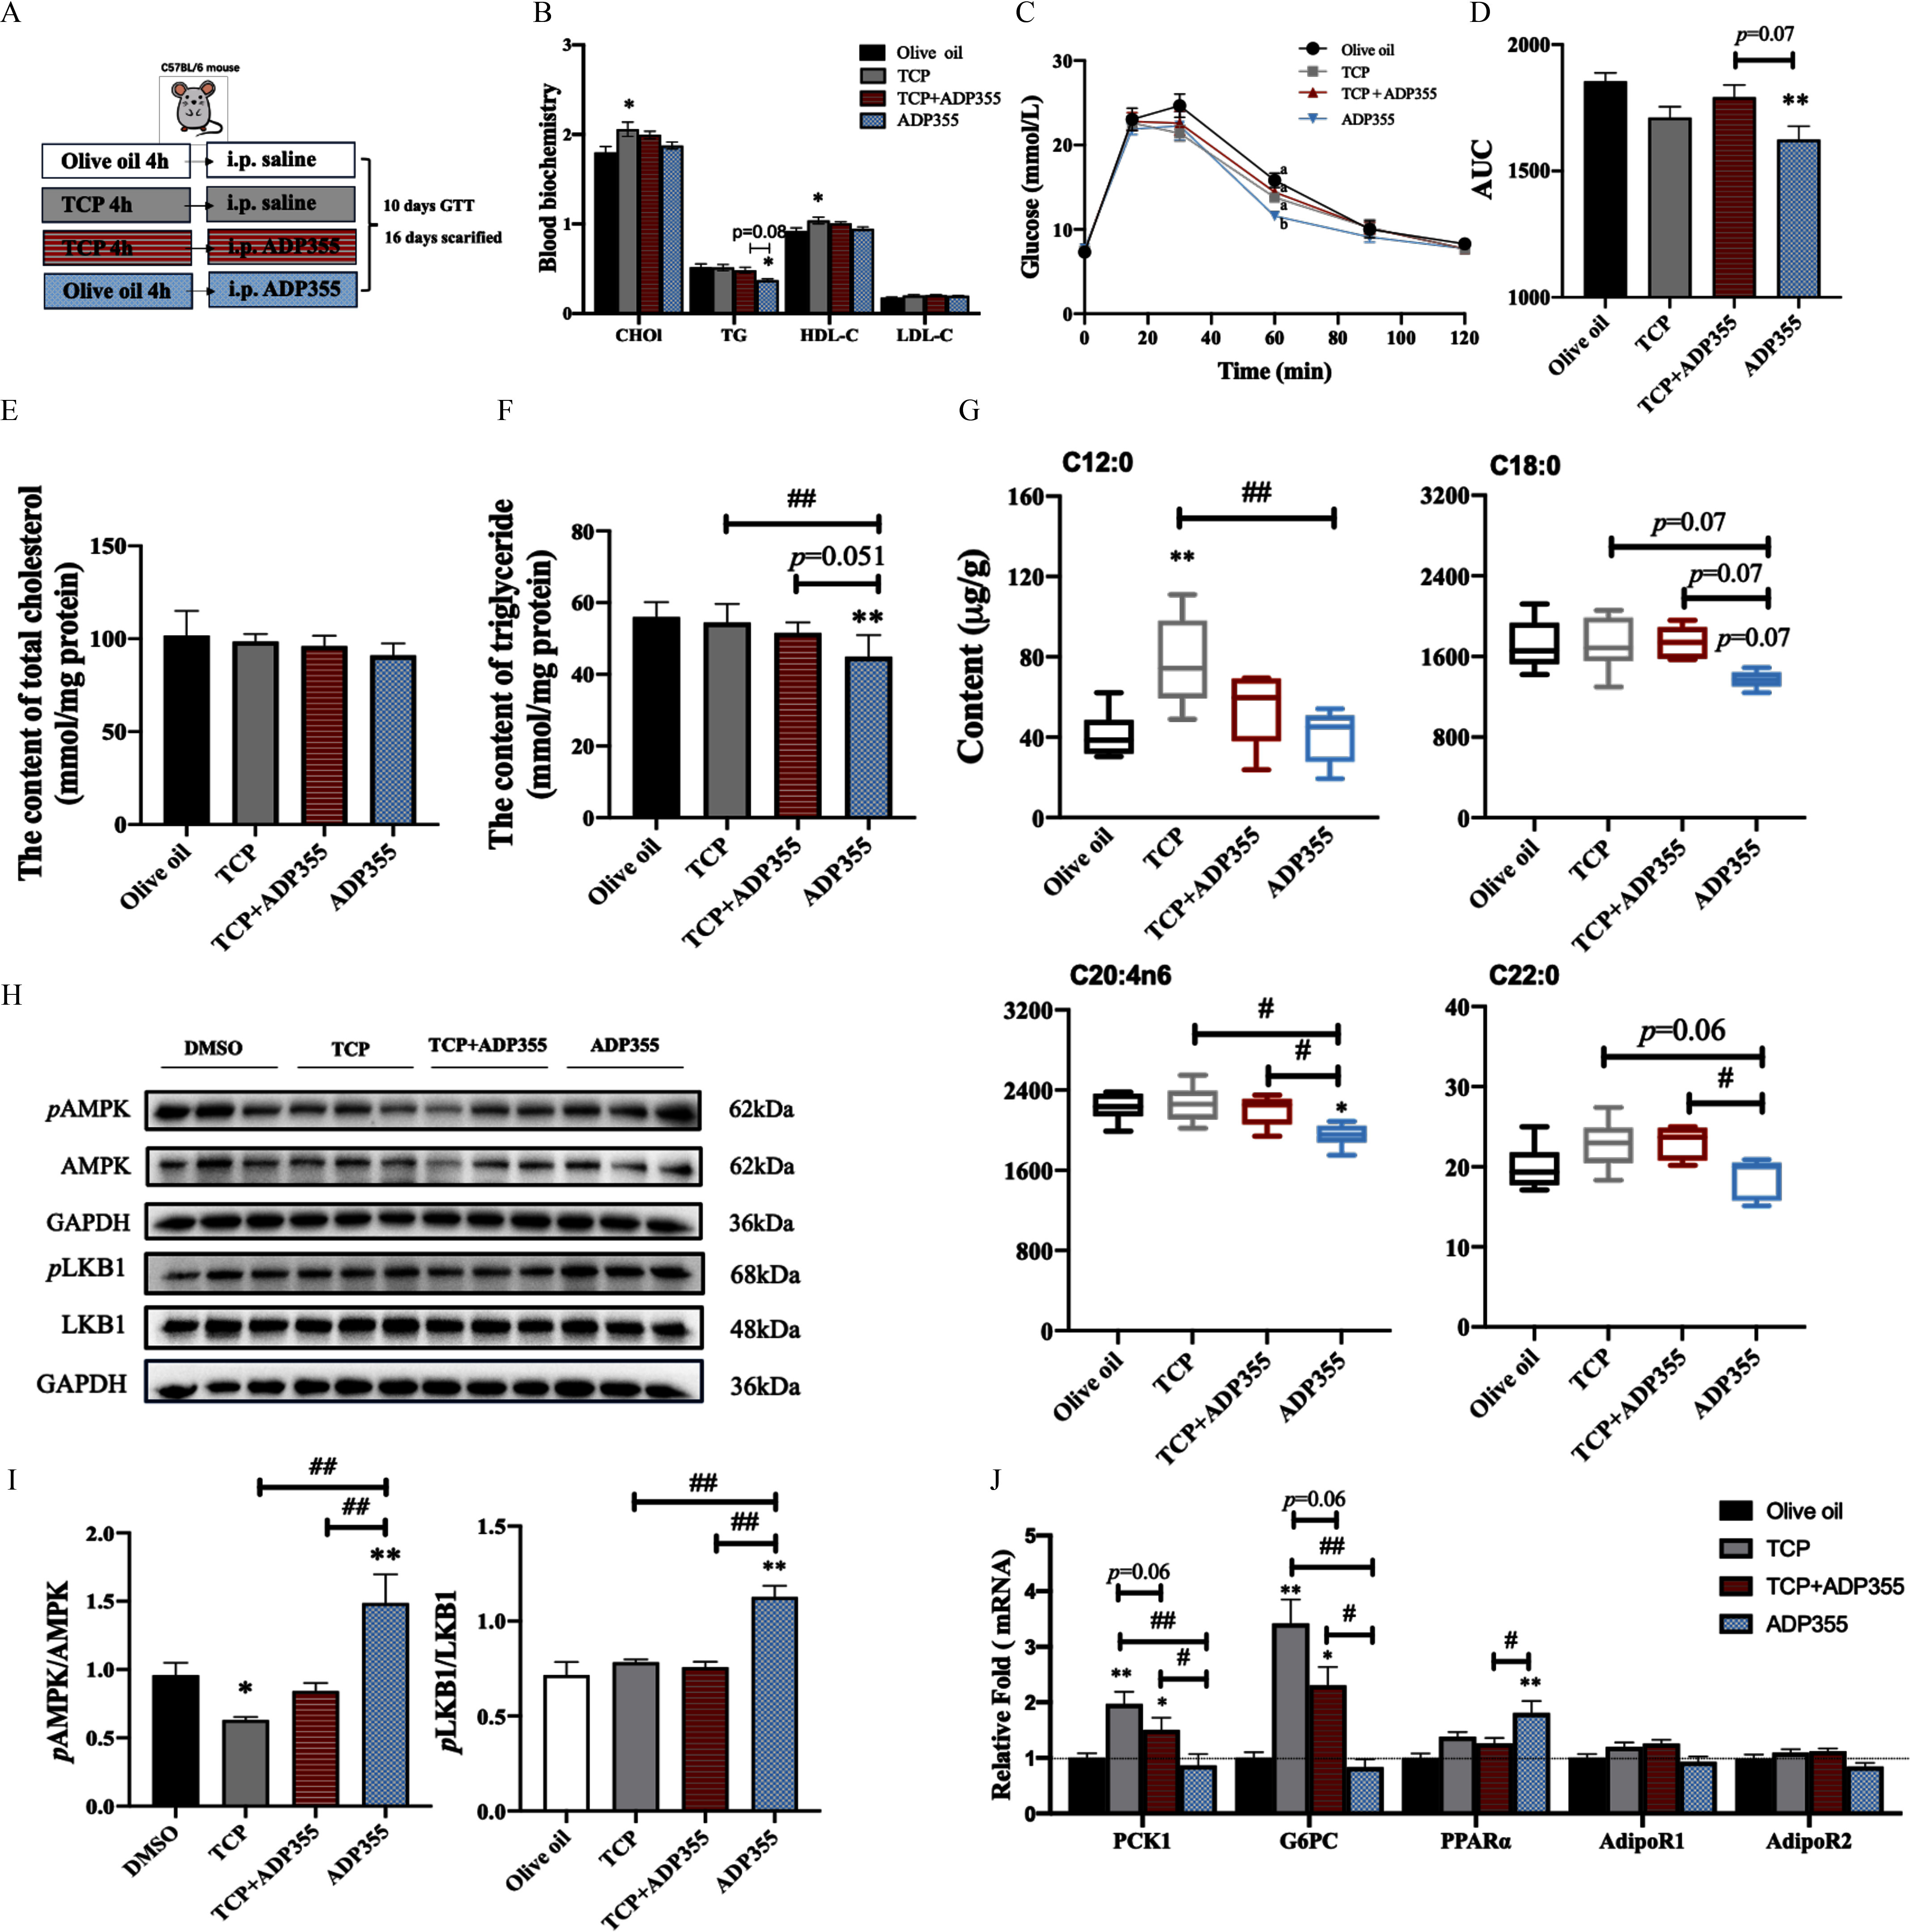
Glycolipid metabolism and relative signaling of AdipoRs after co-treatment with TCP and ADP355 in a WT mouse model. (A) Flowchart of mouse treatment. (B) Plasma cholesterol (CHOl), triglyceride (TG), high-density lipid cholesterol (HDL-C), and low-density lipid cholesterol (LDL-C). (C) Plasma glucose levels after gavage of TCP at for 10 d with or without ADP355 injection (). (D) the area under the curve (AUC) for plasma glucose levels in the groups described in (C). (E–F) The content of TG and total cholesterol in the liver. (G) The content of fatty acids, including C12:0, C18:0, C20:4n6, and C22:0. (H) Protein band (/group) of AdipoR1 downstream (pAMPK and pLKB1) in the liver and (I) their quantification. (J) mRNA levels of genes involved in AdipoR1, AdipoR2, and gluconeogenesis (G6PC and PCK1) and downstream of AdipoR2 () in the liver. Results are presented as . Data in (B–J) are presented in Excel Table S6. Olive oil group (/group), TCP group (/group), group (/group) and ADP355 group (/group). For the fatty acid detection (/group). The “mouse” in (A) was generated using Procreate 5.2.1 (Savage Interactive Pty Ltd., Tas, Australia) by the authors. Note: AdipoR1, adiponectin receptor 1; AdipoR2, adiponectin receptor 2; ADP355, adiponectin-based peptide; AMPK, adenosine monophosphate (AMP)-activated protein kinase; ANOVA, analysis of variance; G6PC, glucose-6-phosphatase; GAPDH, glyceraldehyde-3-phosphate dehydrogenase; GTT, glucose tolerance test; i.p., intraperitoneal; LKB1, liver kinase B1; pAMPK, phosphorylated AMP-activated protein kinase; PCK1, phosphoenolpyruvate carboxykinase; pLKB1, phosphorylated liver kinase B1; , peroxisome proliferator-activated receptor ; SEM, standard error of mean; TCP, tricresyl phosphate; WT, wild type. Statistical comparisons were performed using one-way ANOVA with Tukey’s multiple comparisons test: *, ** compared with the olive oil group: #, ## compared with the ADP355 group.
For lipid metabolism analysis, we measured hepatic TG and TC levels. The TC levels remained similar across all treatment groups (Figure 7E). However, hepatic TG levels were slightly, yet significantly (), lower in the ADP355-alone groups, an effect that was diminished when mice were co-treated with TCP (Figure 7F). The levels of liver fatty acids were also determined. Levels of most of the short- and medium-chain fatty acids remained similar between the treatment groups and control groups (Table S5). TCP-exposed animals had significantly higher C12:0 levels (Figure 7G). Animals exposed to ADP355 had lower levels of C18:0 and C20:4n6, but these differences were reversed by co-exposure to TCP. Although C22:0 levels were higher after TCP co-treatment as compared with the ADP355-alone group, none of the three groups showed significant differences from the control group (Figure 7G).
In mice exposed to ADP355 for 16 d, the liver had higher phosphorylation levels of LKB1 and AMPK (Figure 7H). Mice exposed to TCP alone had a marginally lower pAMPK:AMPK ratio, and exposure to TCP counteracted the ADP355-induced phosphorylation. In addition, the mice co-exposed to had lower phosphorylation levels of LKB1 than those in the ADP355 groups (Figure 7I). As anticipated, the mice exposed to TCP had higher mRNA levels of G6PC and PCK1. Moreover, supplementing with ADP355 ameliorated the effect of TCP, as evidenced by the down-regulation of these two genes in the co-treated groups (Figure 7J). Even though the mice exposed to TCP did not demonstrate a difference in mRNA expression, co-treatment with TCP mitigated the ADP355-induced elevation in levels, thereby implicating blocking of AdipoR2 activity as the downstream mechanism of action (Figure 7J). None of the three groups showed significant differences in the mRNA levels of AdipoR1 and AdipoR2 when compared with the control groups (Figure 7J).
Discussion
Understanding the physical interaction between chemicals and receptor proteins is crucial for comprehending their toxic mode of action. In recent decades, a group of metabolic nuclear receptors have been identified as participants in chemical-associated metabolic disruption.1 The mode of action through which OPFRs are associated with metabolic disruption was elucidated as involving the farnesoid X receptor,61 LXR,16 and .62 In addition to nuclear receptors, membrane-anchored receptors are recognized as the initial steps in cell signaling transduction upon sensing environmental stimuli. Recent research reported that the binding affinity of OPFRs to membrane receptors, such as mTR24 and mGPER,63 exceeded their effect on the corresponding nuclear receptors. This suggests that OPFRs may have a greater impact on signaling pathways mediated by membrane receptors than previously thought. In this study, we provided initial evidence that OPFRs, especially aryl-OPFRs, act as antagonists to AdipoRs.
In a study investigating the crystal structure of AdipoR1, a fatty acid coordinating zinc ion (a hydrolytic reaction center) was observed within the cavity, revealing a lipid hydrolysis activity of AdipoR signaling and AdipoRs per se.64 When comparing the amino acid residuals of AdipoR1-bound oleic acid with those of OPFRs in docking assays, a significant overlap was observed between aryl-OPFRs, two of the chlorinated OPFRs (TDCPP and TCEP), and TBP, suggesting that those OPFRs occupy sites similar to oleic acid. Specifically, a notably strong and mutual interaction mode, known as pi–pi stacking, was observed between the TYR310 residual of AdipoR1 and the phenol rings of the three aryl-OPFRs, partially similar to AdipoRon65 and .66 The non–aryl-OPFRs did not exhibit such an interaction mode owing to their lack of phenol ring structures, suggesting that aryl-OPFRs have more affinity in binding to AdipoR1 than do non–aryl-OPFRs. Recently, a study examining the affinity between membrane receptors [such as G protein receptor 30 (GRP30)67] and OPFRs also revealed that aryl-OPFRs exhibited higher binding affinity than non–aryl-OPFRs in MCF-7 cells. AdipoR2 was shown to interact with and catalyze ceramide, a sphingolipid.68 Intriguingly, disruption of sphingolipid metabolism due to inactivation of hydrolase was observed only in lysates of mouse liver after injection with TPhP.12 This phenomenon was also observed with other aryl-OPFRs, such as TCP, cresyldiphenylphosphate, and EHDPP, in contrast to the non–aryl-OPFRs, in hydrolase-recombinantly overexpressed HEK293 cells.12 These independent studies suggest that the large cavity of AdipoRs may facilitate binding of chemicals structurally similar to aryl-OPFRs.
The zinc ion coordinating with helices III and VII was essential for stabilizing the subdomain formed by these helices and maintaining the structural stability of AdipoRs.31,69 The C-terminal fragments, C-terminal turns of helix VII, and the three ECLs were collectively recognized by adiponectin,31 which differed significantly from OPFRs. After considering the relatively low binding energy and the interaction with these two helices and the ECL regions, we deduced that aryl-OPFRs might disrupt the structural stability of AdipoRs or hinder AdipoRs from binding with adiponectin. The noncompetitive binding observed between the fluorescence probe ADP355 and aryl-OPFRs further supported this speculation. Surprisingly, one of the non–aryl-OPFRs, TCPP, also exhibited noncompetitive inhibition with ADP355. We were unable to elucidate the contradictory results with regard to TCPP among the molecular docking, CETSA, and noncompetitive binding assays given that research on AdipoRs is still in the early stages. Moreover, the probe employed in this study encompassed the entire globular adiponectin domain, which represents the active site of adiponectin.70 Generally, AdipoR1 exhibited a higher affinity for globular adiponectin compared with AdipoR2. Hence, it was reasonable to infer that the binding affinity of ADP355 to AdipoR1 was superior to that of AdipoR2. This may explain the lower value of AdipoR2 compared with AdipoR1 after treatment with OPFRs. In the absence of adiponectin in vitro, lipid deposition in AdipoR-knockdown liver cells revealed the crucial role of AdipoRs per se in lipid homeostasis, consistent with previous findings.68 As a result, the inhibitory effect of aryl-OPFRs on AdipoRs may have partially contributed to the lipid accumulation in the in vitro model. Similarly, the elevated glucose uptake in the presence of AdipoR agonists and the decline in glucose uptake observed with aryl-OPFR treatment indicated the potential antagonistic effect of these compounds on AdipoRs. Exposure to TDCPP, one of the chlorinated OPFRs, demonstrated a slight but significant difference in lipid and glucose levels in the liver cells, suggesting that other mechanisms contributing to the disruption of glycolipid metabolism in vitro cannot be ruled out.
Mechanistically, adenovirus overexpression of AdipoRs in the liver of db/db mice decreased gluconeogenesis and increased fatty acid oxidation,33 whereas knockout of both AdipoRs blocked the function of adiponectin, leading to insulin resistance in WT mice.29,58 Activation of AdipoR1 led to higher pAMPK levels, which tightly reduced hepatic gluconeogenesis.71 Short-term exposure to TCP resulted in a mild, yet significant, inhibition of pAMPK and stimulated the gene expression of enzymes involved in gluconeogenesis, effects that were reversed by treatment with ADP355. In addition, the activation of AdipoR1 by ADP355 was further attenuated by co-treatment with TCP, supporting its antagonistic effect on AdipoR1.
Beyond influencing glucose metabolism, the activation of AdipoR1 and AdipoR2 inhibited fatty acid de novo synthesis, accelerated fatty acid oxidation, and consequently reduced lipid accumulation in mice.29,30 In this study, ADP355 treatment up-regulated gene expression and lowered levels of C18:0, C20:4n6 fatty acid, and TG in WT mice. Although TCP alone did not significantly affect these end points, it negated the metabolic benefits conferred by ADP355. This suggests that TCP blocked the activation of AdipoRs by ADP355, acting as an antagonist to these receptors. Unlike the simple in vitro models, the mechanisms for maintaining a balance between lipid acquisition and removal are more complex in vivo. It was recognized that, even when mice were subjected to high-fat diet feeding, lipid deposition in the liver still required month to become evident.50 Therefore, it is reasonable that the lipid accumulation observed in vitro may not be replicated in TCP-treated mice over such a short-term exposure. In some studies of chemically induced metabolic disease, researchers preferred to use genetically engineered models, such as the mouse model16 and the University of California, Davis type 2 diabetes mellitus (UCD-T2DM) rat model,72 which were sensitive to chemical exposure. In the WT mouse model used in this study, supraphysiological stimulation of AdipoRs by ADP355 helped unveil and verify TCP’s inhibitory effect on adiponectin/AdipoR signaling. Therefore, results from the ADP355–TCP co-exposure groups suggest that long-term exposure to aryl-OPFRs may pose a risk of metabolic disruption, particularly in organisms deficient in adiponectin.
Adequate levels and normal status of AdipoRs are prerequisites for adiponectin to exert its effects.73 Previous studies have reported that certain environmental chemicals, such as BPA28 and paraquat,65 can diminish AdipoR mRNA levels in the arcuate area of mice and in lung fibroblasts. Our previous research found that administering TPhP by gavage for 1 month altered AdipoR expression in the liver of mice.71 However, short-term exposure to TCP did not alter AdipoR mRNA levels, suggesting that the disruption of downstream AdipoR signaling observed in this study was primarily due to antagonism rather than mRNA depletion. Therefore, the impacts of long-term exposure to aryl-OPFRs on AdipoRs could be more complex than those seen with short-term exposure.
The reference dose (RfD) for TCP in humans has been reported as a dose of .74 By applying a typical uncertainty factor (usually 1,000) used to derive the RfD from observed no-effect levels (NOECL), we can infer that a TCP dose of may represent a NOECL. Given the chronic nature of human exposure to OPFRs, a relatively high dose in our short-term (2-wk) study was justifiable. OPFRs are known for their rapid excretion in mammals. For instance, after administering of TCP to Fischer 344 male rats via gavage, the residual TCP concentration remained at in plasma after 1 d of elimination.75 This concentration is comparable to the mean blood concentration of TCP (ranging from nondetectable to values in ng/L) in the general population, with maximum levels reaching in certain areas.76 Therefore, we postulated that the residual levels of TCP in the mouse plasma in our study may be equivalent to those found in humans. To our knowledge, there is no direct evidence supporting the relevance of AdipoR signaling modification by OPFRs in humans. However, residual levels of aryl-OPFRs, ranging from values in nanograms per liter to micrograms per liter, have been reported to be strongly correlated with glycolipid metabolism, which is tightly regulated by AdipoRs. For instance, blood levels of TPhP (ranging from to ) were found to be positively correlated with glycometabolic markers, including in a homeostatic model of insulin resistance, glucose, and insulin levels in healthy participants 60–69 years of age in China.77 Omics analysis further elucidated that TPhP and its metabolism in humans may influence glucose uptake,77 a biological function downstream of AdipoRs. Aryl-OPFRs (at a median concentration of EHDPP and TPhP) in whole blood samples were found to be associated with serum sphingolipid levels in the general population 20–50 years of age,10 and AdipoRs are capable of catalyzing sphingolipids.78 In addition to the parent chemicals, metabolites of aryl-OPFRs have also been shown to be associated with lipid metabolism in humans.79 Collectively, our findings suggest that the interruption of AdipoR signaling may partially contribute to the observed glycolipid metabolic disruption following exposure to aryl-OPFRs.
However, the findings presented in this study should be interpreted in light of certain limitations. First, given that no antagonists for AdipoRs have been identified, a positive control regarding the antagonistic activity of OPFRs on AdipoRs is lacking. Second, the possibility that there are alternative, unknown mechanisms underlying the effects of aryl-OPFRs on gluconeogenesis and lipid metabolism cannot be completely ruled out. Nonetheless, the observed inhibitory effects of aryl-OPFRs on ADP355-activated AdipoR signaling at least partially confirmed the mechanism behind the metabolic disruption.
In conclusion, this study evaluated the binding affinity between certain aryl-OPFRs and AdipoRs. Our results suggest that these compounds act as noncompetitive inhibitors of the receptors in the presence of an endogenous ligand (ADP355). We found that the aryl-OPFRs blocked the activation of AdipoRs in both in vitro and in vivo models, thus supporting their antagonistic effects. This study diverges from the traditional focus on nuclear receptors in OPFR-associated metabolic disruption by providing novel insights into the function of peptide hormone–related membrane receptors such as AdipoRs. Our findings suggest that alterations in the activity of AdipoRs have the potential to instigate MIEs in chemical-associated metabolic disturbances.
Supplementary Material
Acknowledgments
Author contributions were as follows: Ying Liu: writing–original draft and methodology, experiment, formal analysis, and graphic preparation. Xiaochun Ma: writing–original draft and methodology, experiment, formal analysis, and graphic preparation. Yifei Le: writing–original draft and methodology and formal analysis. Jiafan Feng: experiment and graphic preparation. Mengting Xu: software and graphic preparation. Wanyue Wang: software. Cui Wang: supervision, visualization, funding acquisition, and writing–reviewing and editing.
The work was supported by the National Natural Science Foundation of China (22076172, 22276176, to C.W.). We are thankful for the technical support from the Public Platform of Medical Research Center, Academy of Chinese Medical Science, Zhejiang Chinese Medical University. Some workflows were prepared by Biorender (https://biorender.com/).
Conclusions and opinions are those of the individual authors and do not necessarily reflect the policies or views of EHP Publishing or the National Institute of Environmental Health Sciences.
References
- 1.Casals-Casas C, Desvergne B. 2011. Endocrine disruptors: from endocrine to metabolic disruption. Annu Rev Physiol 73:135–162, PMID: 21054169, 10.1146/annurev-physiol-012110-142200. [DOI] [PubMed] [Google Scholar]
- 2.Gore AC, Chappell VA, Fenton SE, Flaws JA, Nadal A, Prins GS, et al. 2015. EDC-2: the Endocrine Society’s second Scientific Statement on endocrine-disrupting chemicals. Endocr Rev 36(6):E1–E150, PMID: 26544531, 10.1210/er.2015-1010. [DOI] [PMC free article] [PubMed] [Google Scholar]
- 3.A O P Wiki. n.d. Welcome to the Collaborative Adverse Outcome Pathway Wiki (AOP-Wiki). https://aopwiki.org [accessed 9 July 2023].
- 4.Zhu L, Hajeb P, Fauser P, Vorkamp K. 2023. Endocrine disrupting chemicals in indoor dust: a review of temporal and spatial trends, and human exposure. Sci Total Environ 874:162374, PMID: 36828075, 10.1016/j.scitotenv.2023.162374. [DOI] [PubMed] [Google Scholar]
- 5.Yao C, Yang H, Li Y. 2021. A review on organophosphate flame retardants in the environment: occurrence, accumulation, metabolism and toxicity. Sci Total Environ 795:148837, PMID: 34246143, 10.1016/j.scitotenv.2021.148837. [DOI] [PubMed] [Google Scholar]
- 6.Zhiyan Consulting Group (Beijing, China). 2014. In-Depth Investigation and Investment Prospect Analysis Report of China’s Flame Retardant Market in 2014–2018. Reporter Number: R229283. https://www.chyxx.com/research/201402/229283.html [accessed 10 March 2018].
- 7.Huang Q, Hou R, Lin L, Li H, Liu S, Cheng Y, et al. 2023. Bioaccumulation and trophic transfer of organophosphate flame retardants and their metabolites in the estuarine food web of the Pearl River, China. Environ Sci Technol 57(9):3549–3561, PMID: 36826812, 10.1021/acs.est.2c05619. [DOI] [PubMed] [Google Scholar]
- 8.Dang Y, Tang K, Wang Z, Cui H, Lei J, Wang D, et al. 2023. Organophosphate esters (OPEs) flame retardants in water: a review of photocatalysis, adsorption, and biological degradation. Molecules 28(7):2983, PMID: 37049746, 10.3390/molecules28072983. [DOI] [PMC free article] [PubMed] [Google Scholar]
- 9.Li Y, Wang X, Zhu Q, Xu Y, Fu Q, Wang T, et al. 2023. Organophosphate flame retardants in pregnant women: sources, occurrence, and potential risks to pregnancy outcomes. Environ Sci Technol 57(18):7109–7128, PMID: 37079500, 10.1021/acs.est.2c06503. [DOI] [PubMed] [Google Scholar]
- 10.Zhao F, Wan Y, Zhao H, Hu W, Mu D, Webster TF, et al. 2016. Levels of blood organophosphorus flame retardants and association with changes in human sphingolipid homeostasis. Environ Sci Technol 50(16):8896–8903, PMID: 27434659, 10.1021/acs.est.6b02474. [DOI] [PubMed] [Google Scholar]
- 11.Yang D, Wei X, Zhang Z, Chen X, Zhu R, Oh Y, et al. 2022. Tris (2-chloroethyl) phosphate (TCEP) induces obesity and hepatic steatosis via FXR-mediated lipid accumulation in mice: long-term exposure as a potential risk for metabolic diseases. Chem Biol Interact 363:110027, PMID: 35780845, 10.1016/j.cbi.2022.110027. [DOI] [PubMed] [Google Scholar]
- 12.Morris PJ, Medina-Cleghorn D, Heslin A, King SM, Orr J, Mulvihill MM, et al. 2014. Organophosphorus flame retardants inhibit specific liver carboxylesterases and cause serum hypertriglyceridemia. ACS Chem Biol 9(5):1097–1103, PMID: 24597639, 10.1021/cb500014r. [DOI] [PMC free article] [PubMed] [Google Scholar]
- 13.Yan J, Zhao Z, Xia M, Chen S, Wan X, He A, et al. 2022. Induction of lipid metabolism dysfunction, oxidative stress and inflammation response by tris(1-chloro-2-propyl)phosphate in larval/adult zebrafish. Environ Int 160:107081, PMID: 35021149, 10.1016/j.envint.2022.107081. [DOI] [PubMed] [Google Scholar]
- 14.Hao Z, Zhang Z, Lu D, Ding B, Shu L, Zhang Q, et al. 2019. Organophosphorus flame retardants impair intracellular lipid metabolic function in human hepatocellular cells. Chem Res Toxicol 32(6):1250–1258, PMID: 30966736, 10.1021/acs.chemrestox.9b00058. [DOI] [PubMed] [Google Scholar]
- 15.Pillai HK, Fang M, Beglov D, Kozakov D, Vajda S, Stapleton HM, et al. 2014. Ligand binding and activation of PPARγ by Firemaster® 550: effects on adipogenesis and osteogenesis in vitro. Environ Health Perspect 122(11):1225–1232, PMID: 25062436, 10.1289/ehp.1408111. [DOI] [PMC free article] [PubMed] [Google Scholar]
- 16.Hu W, Jia Y, Kang Q, Peng H, Ma H, Zhang S, et al. 2019. Screening of house dust from Chinese homes for chemicals with liver X receptors binding activities and characterization of atherosclerotic activity using an in vitro macrophage cell line and ApoE−/− mice. Environ Health Perspect 127(11):117003, PMID: 31724879, 10.1289/EHP5039. [DOI] [PMC free article] [PubMed] [Google Scholar]
- 17.Krumm EA, Patel VJ, Tillery TS, Yasrebi A, Shen J, Guo GL, et al. 2018. Organophosphate flame-retardants alter adult mouse homeostasis and gene expression in a sex-dependent manner potentially through interactions with ERα. Toxicol Sci 162(1):212–224, PMID: 29112739, 10.1093/toxsci/kfx238. [DOI] [PMC free article] [PubMed] [Google Scholar]
- 18.Kim S, Rabhi N, Blum BC, Hekman R, Wynne K, Emili A, et al. 2020. Triphenyl phosphate is a selective PPARγ modulator that does not induce brite adipogenesis in vitro and in vivo. Arch Toxicol 94(9):3087–3103, PMID: 32683515, 10.1007/s00204-020-02815-1. [DOI] [PMC free article] [PubMed] [Google Scholar]
- 19.Xiang D, Wang Q. 2021. PXR-mediated organophorous flame retardant tricresyl phosphate effects on lipid homeostasis. Chemosphere 284:131250, PMID: 34225124, 10.1016/j.chemosphere.2021.131250. [DOI] [PubMed] [Google Scholar]
- 20.Sun W, Duan X, Chen H, Zhang L, Sun H. 2020. Adipogenic activity of 2-ethylhexyl diphenyl phosphate via peroxisome proliferator-activated receptor γ pathway. Sci Total Environ 711:134810, PMID: 31812418, 10.1016/j.scitotenv.2019.134810. [DOI] [PubMed] [Google Scholar]
- 21.Negi CK, Bajard L, Kohoutek J, Blaha L. 2021. An adverse outcome pathway based in vitro characterization of novel flame retardants-induced hepatic steatosis. Environ Pollut 289:117855, PMID: 34340181, 10.1016/j.envpol.2021.117855. [DOI] [PubMed] [Google Scholar]
- 22.A O P Wiki. n.d. G protein-coupled estrogen receptor 1 (GPER) signal pathway in the lipid metabolism disruption effects. https://aopwiki.org/aops/401 [accessed 9 July 2023].
- 23.Guan R, Li N, Wang W, Liu W, Li X, Zhao C. 2022. The adverse outcome pathway (AOP) of estrogen interference effect induced by triphenyl phosphate (TPP): integrated multi-omics and molecular dynamics approaches. Ecotoxicol Environ Saf 234:113387, PMID: 35272188, 10.1016/j.ecoenv.2022.113387. [DOI] [PubMed] [Google Scholar]
- 24.Li J, Xu Y, Li N, Zuo R, Zhai Y, Chen H. 2022. Thyroid hormone disruption by organophosphate esters is mediated by nuclear/membrane thyroid hormone receptors: in vitro, in vivo, and in silico studies. Environ Sci Technol 56(7):4241–4250, PMID: 35262344, 10.1021/acs.est.1c05956. [DOI] [PubMed] [Google Scholar]
- 25.Choi HM, Doss HM, Kim KS. 2020. Multifaceted physiological roles of adiponectin in inflammation and diseases. Int J Mol Sci 21(4):1219, PMID: 32059381, 10.3390/ijms21041219. [DOI] [PMC free article] [PubMed] [Google Scholar]
- 26.Lin Z, Tian H, Lam KSL, Lin S, Hoo RCL, Konishi M, et al. 2013. Adiponectin mediates the metabolic effects of FGF21 on glucose homeostasis and insulin sensitivity in mice. Cell Metab 17(5):779–789, PMID: 23663741, 10.1016/j.cmet.2013.04.005. [DOI] [PubMed] [Google Scholar]
- 27.Tao C, Sifuentes A, Holland WL. 2014. Regulation of glucose and lipid homeostasis by adiponectin: effects on hepatocytes, pancreatic β cells and adipocytes. Best Pract Res Clin Endocrinol Metab 28(1):43–58, PMID: 24417945, 10.1016/j.beem.2013.11.003. [DOI] [PMC free article] [PubMed] [Google Scholar]
- 28.Holland WL, Miller RA, Wang ZV, Sun K, Barth BM, Bui HH, et al. 2011. Receptor-mediated activation of ceramidase activity initiates the pleiotropic actions of adiponectin. Nat Med 17(1):55–63, PMID: 21186369, 10.1038/nm.2277. [DOI] [PMC free article] [PubMed] [Google Scholar]
- 29.Yamauchi T, Nio Y, Maki T, Kobayashi M, Takazawa T, Iwabu M, et al. 2007. Targeted disruption of AdipoR1 and AdipoR2 causes abrogation of adiponectin binding and metabolic actions. Nat Med 13(3):332–339, PMID: 17268472, 10.1038/nm1557. [DOI] [PubMed] [Google Scholar]
- 30.Holland WL, Xia JY, Johnson JA, Sun K, Pearson MJ, Sharma AX, et al. 2017. Inducible overexpression of adiponectin receptors highlight the roles of adiponectin-induced ceramidase signaling in lipid and glucose homeostasis. Mol Metab 6(3):267–275, PMID: 28271033, 10.1016/j.molmet.2017.01.002. [DOI] [PMC free article] [PubMed] [Google Scholar]
- 31.Tanabe H, Fujii Y, Okada-Iwabu M, Iwabu M, Nakamura Y, Hosaka T, et al. 2015. Crystal structures of the human adiponectin receptors. Nature 520(7547):312–316, PMID: 25855295, 10.1038/nature14301. [DOI] [PMC free article] [PubMed] [Google Scholar]
- 32.Yamauchi T, Kamon J, Ito Y, Tsuchida A, Yokomizo T, Kita S, et al. 2003. Cloning of adiponectin receptors that mediate antidiabetic metabolic effects. Nature 423(6941):762–769, PMID: 12802337, 10.1038/nature01705. [DOI] [PubMed] [Google Scholar]
- 33.Kim Y, Lim JH, Kim MY, Kim EN, Yoon HE, Shin SJ, et al. 2018. The adiponectin receptor agonist AdipoRon ameliorates diabetic nephropathy in a model of type 2 diabetes. J Am Soc Nephrol 29(4):1108–1127, PMID: 29330340, 10.1681/ASN.2017060627. [DOI] [PMC free article] [PubMed] [Google Scholar]
- 34.Okada-Iwabu M, Yamauchi T, Iwabu M, Honma T, Hamagami K-I, Matsuda K, et al. 2013. A small-molecule AdipoR agonist for type 2 diabetes and short life in obesity. Nature 503(7477):493–499, PMID: 24172895, 10.1038/nature12656. [DOI] [PubMed] [Google Scholar]
- 35.Roepke TA, Yang JA, Yasrebi A, Mamounis KJ, Oruc E, Zama AM, et al. 2016. Regulation of arcuate genes by developmental exposures to endocrine-disrupting compounds in female rats. Reprod Toxicol 62:18–26, PMID: 27103539, 10.1016/j.reprotox.2016.04.014. [DOI] [PMC free article] [PubMed] [Google Scholar]
- 36.Rak A, Zajda K, Gregoraszczuk EŁ. 2017. Endocrine disrupting compounds modulates adiponectin secretion, expression of its receptors and action on steroidogenesis in ovarian follicle. Reprod Toxicol 69:204–211, PMID: 28284726, 10.1016/j.reprotox.2017.03.004. [DOI] [PubMed] [Google Scholar]
- 37.Burley SK, Bhikadiya C, Bi C, Bittrich S, Chao H, Chen L, et al. 2023. RCSB Protein Data Bank (RCSB.org): delivery of experimentally-determined PDB structures alongside one million computed structure models of proteins from artificial intelligence/machine learning. Nucleic Acids Res 51(D1):D488–D508, PMID: 36420884, 10.1093/nar/gkac1077. [DOI] [PMC free article] [PubMed] [Google Scholar]
- 38.RCSB (Research Collaboratory for Structural Bioinformatics) Protein Data Bank. n.d. Welcome page. https://www.rcsb.org/ [accessed 17 September 2021].
- 39.Kim S, Chen J, Cheng T, Gindulyte A, He J, He S, et al. 2023. PubChem 2023 update. Nucleic Acids Res 51(D1):D1373–D1380, PMID: 36305812, 10.1093/nar/gkac956. [DOI] [PMC free article] [PubMed] [Google Scholar]
- 40.PubChem. n.d. Explore Chemistry. https://pubchem.ncbi.nlm.nih.gov [accessed 17 September 2021].
- 41.Eberhardt J, Santos-Martins D, Tillack AF, Forli S. 2021. AutoDock Vina 1.2.0: new docking methods, expanded force field, and python bindings. J Chem Inf Model 61(8):3891–3898, PMID: 34278794, 10.1021/acs.jcim.1c00203. [DOI] [PMC free article] [PubMed] [Google Scholar]
- 42.Trott O, Olson AJ. 2010. AutoDock Vina: improving the speed and accuracy of docking with a new scoring function, efficient optimization, and multithreading. J Comput Chem 31(2):455–461, PMID: 19499576, 10.1002/jcc.21334. [DOI] [PMC free article] [PubMed] [Google Scholar]
- 43.Case DA, Aktulga HM, Belfon K, Cerutti DS, Cisneros GA, Cruzeiro VWD, et al. 2023. AmberTools. J Chem Inf Model 63(20):6183–6191, PMID: 37805934, 10.1021/acs.jcim.3c01153. [DOI] [PMC free article] [PubMed] [Google Scholar]
- 44.Tian C, Kasavajhala K, Belfon KAA, Raguette L, Huang H, Migues AN, et al. 2020. ff19SB: amino-acid-specific protein backbone parameters trained against quantum mechanics energy surfaces in solution. J Chem Theory Comput 16(1):528–552, PMID: 31714766, 10.1021/acs.jctc.9b00591. [DOI] [PMC free article] [PubMed] [Google Scholar]
- 45.Wang J, Wang W, Kollman PA, Case DA. 2006. Automatic atom type and bond type perception in molecular mechanical calculations. J Mol Graph Model 25(2):247–260, PMID: 16458552, 10.1016/j.jmgm.2005.12.005. [DOI] [PubMed] [Google Scholar]
- 46.Roe DR, Cheatham TE III.. 2013. PTRAJ and CPPTRAJ: software for processing and analysis of molecular dynamics trajectory data. J Chem Theory Comput 9(7):3084–3095, PMID: 26583988, 10.1021/ct400341p. [DOI] [PubMed] [Google Scholar]
- 47.Martinez Molina D, Jafari R, Ignatushchenko M, Seki T, Larsson EA, Dan C, et al. 2013. Monitoring drug target engagement in cells and tissues using the cellular thermal shift assay. Science 341(6141):84–87, PMID: 23828940, 10.1126/science.1233606. [DOI] [PubMed] [Google Scholar]
- 48.Jafari R, Almqvist H, Axelsson H, Ignatushchenko M, Lundbäck T, Nordlund P, et al. 2014. The cellular thermal shift assay for evaluating drug target interactions in cells. Nat Protoc 9(9):2100–2122, PMID: 25101824, 10.1038/nprot.2014.138. [DOI] [PubMed] [Google Scholar]
- 49.Han J, Fu J, Sun J, Hall DR, Yang D, Blatz D, et al. 2021. Quantitative chemical proteomics reveals interspecies variations on binding schemes of L-FABP with perfluorooctanesulfonate. Environ Sci Technol 55(13):9012–9023, PMID: 34133149, 10.1021/acs.est.1c00509. [DOI] [PMC free article] [PubMed] [Google Scholar]
- 50.Xu H, Zhao Q, Song N, Yan Z, Lin R, Wu S, et al. 2020. AdipoR1/AdipoR2 dual agonist recovers nonalcoholic steatohepatitis and related fibrosis via endoplasmic reticulum-mitochondria axis. Nat Commun 11(1):5807, PMID: 33199780, 10.1038/s41467-020-19668-y. [DOI] [PMC free article] [PubMed] [Google Scholar]
- 51.Schindelin J, Arganda-Carreras I, Frise E, Kaynig V, Longair M, Pietzsch T, et al. 2012. Fiji: an open-source platform for biological-image analysis. Nat Methods 9(7):676–682, PMID: 22743772, 10.1038/nmeth.2019. [DOI] [PMC free article] [PubMed] [Google Scholar]
- 52.Reif DM, Sypa M, Lock EF, Wright FA, Wilson A, Cathey T, et al. 2013. ToxPi GUI: an interactive visualization tool for transparent integration of data from diverse sources of evidence. Bioinformatics 29(3):402–403, PMID: 23202747, 10.1093/bioinformatics/bts686. [DOI] [PMC free article] [PubMed] [Google Scholar]
- 53.Marvel SW, To K, Grimm FA, Wright FA, Rusyn I, Reif DM. 2018. ToxPi graphical user interface 2.0: dynamic exploration, visualization, and sharing of integrated data models. BMC Bioinformatics 19(1):80, PMID: 29506467, 10.1186/s12859-018-2089-2. [DOI] [PMC free article] [PubMed] [Google Scholar]
- 54.Reif DM, Martin MT, Tan SW, Houck KA, Judson RS, Richard AM, et al. 2010. Endocrine profiling and prioritization of environmental chemicals using ToxCast data. Environ Health Perspect 118(12):1714–1720, PMID: 20826373, 10.1289/ehp.1002180. [DOI] [PMC free article] [PubMed] [Google Scholar]
- 55.Wang H, Zhang H, Zhang Z, Huang B, Cheng X, Wang D, et al. 2016. Adiponectin-derived active peptide ADP355 exerts anti-inflammatory and anti-fibrotic activities in thioacetamide-induced liver injury. Sci Rep 6:19445, PMID: 26777428, 10.1038/srep19445. [DOI] [PMC free article] [PubMed] [Google Scholar]
- 56.Xu C, Ma H, Gao F, Zhang C, Hu W, Jia Y, et al. 2022. Screening of organophosphate flame retardants with placentation-disrupting effects in human trophoblast organoid model and characterization of adverse pregnancy outcomes in mice. Environ Health Perspect 130(5):057002, PMID: 35503735, 10.1289/EHP10273. [DOI] [PMC free article] [PubMed] [Google Scholar]
- 57.Aubin-Tam M-E, Appleyard DC, Ferrari E, Garbin V, Fadiran OO, Kunkel J, et al. 2011. Adhesion through single peptide aptamers. J Phys Chem A 115(16):3657–3664, PMID: 20795685, 10.1021/jp1031493. [DOI] [PMC free article] [PubMed] [Google Scholar]
- 58.Palanivel R, Fang X, Park M, Eguchi M, Pallan S, De Girolamo S, et al. 2007. Globular and full-length forms of adiponectin mediate specific changes in glucose and fatty acid uptake and metabolism in cardiomyocytes. Cardiovasc Res 75(1):148–157, PMID: 17499232, 10.1016/j.cardiores.2007.04.011. [DOI] [PubMed] [Google Scholar]
- 59.Ahmad A, Ali T, Kim MW, Khan A, Jo MH, Rehman SU, et al. 2019. Adiponectin homolog novel osmotin protects obesity/diabetes-induced NAFLD by upregulating AdipoRs/PPARα signaling in ob/ob and db/db transgenic mouse models. Metabolism 90:31–43, PMID: 30473057, 10.1016/j.metabol.2018.10.004. [DOI] [PubMed] [Google Scholar]
- 60.Ma C, Wang Z, Xia R, Wei L, Zhang C, Zhang J, et al. 2021. Danthron ameliorates obesity and MAFLD through activating the interplay between PPARα/RXRα heterodimer and adiponectin receptor 2. Biomed Pharmacother 137:111344, PMID: 33581653, 10.1016/j.biopha.2021.111344. [DOI] [PubMed] [Google Scholar]
- 61.Tenlep SYN, Weaver M, Chen J, Vsevolozhskaya O, Morris AJ, Rashid CS. 2023. Tris(1,3-dichloro-2-propyl) phosphate is a metabolism-disrupting chemical in male mice. Toxicol Lett 374:31–39, PMID: 36493961, 10.1016/j.toxlet.2022.11.021. [DOI] [PMC free article] [PubMed] [Google Scholar]
- 62.Cano-Sancho G, Smith A, La Merrill MA. 2017. Triphenyl phosphate enhances adipogenic differentiation, glucose uptake and lipolysis via endocrine and noradrenergic mechanisms. Toxicol In Vitro 40:280–288, PMID: 28163246, 10.1016/j.tiv.2017.01.021. [DOI] [PMC free article] [PubMed] [Google Scholar]
- 63.Ji X, Li N, Ma M, Rao K, Yang R, Wang Z. 2020. Tricresyl phosphate isomers exert estrogenic effects via G protein-coupled estrogen receptor-mediated pathways. Environ Pollut 264:114747, PMID: 32559878, 10.1016/j.envpol.2020.114747. [DOI] [PubMed] [Google Scholar]
- 64.Tanabe H, Fujii Y, Okada-Iwabu M, Iwabu M, Kano K, Kawana H, et al. 2020. Human adiponectin receptor AdipoR1 assumes closed and open structures. Commun Biol 3(1):446, PMID: 32796916, 10.1038/s42003-020-01160-4. [DOI] [PMC free article] [PubMed] [Google Scholar]
- 65.Lee Y, Nakano A, Nakamura S, Sakai K, Tanaka M, Sanematsu K, et al. 2021. In vitro and in silico characterization of adiponectin-receptor agonist dipeptides. NPJ Sci Food 5(1):29, PMID: 34772952, 10.1038/s41538-021-00114-2. [DOI] [PMC free article] [PubMed] [Google Scholar]
- 66.Ma OK-F, Ronsisvalle S, Basile L, Xiang AW, Tomasella C, Sipala F, et al. 2023. Identification of a novel adiponectin receptor and opioid receptor dual acting agonist as a potential treatment for diabetic neuropathy. Biomed Pharmacother 158:114141, PMID: 36542987, 10.1016/j.biopha.2022.114141. [DOI] [PubMed] [Google Scholar]
- 67.Ji X, Li N, Ma M, Rao K, Wang Z. 2020. In vitro estrogen-disrupting effects of organophosphate flame retardants. Sci Total Environ 727:138484, PMID: 32330712, 10.1016/j.scitotenv.2020.138484. [DOI] [PubMed] [Google Scholar]
- 68.Vasiliauskaité-Brooks I, Sounier R, Rochaix P, Bellot G, Fortier M, Hoh F, et al. 2017. Structural insights into adiponectin receptors suggest ceramidase activity. Nature 544(7648):120–123, PMID: 28329765, 10.1038/nature21714. [DOI] [PMC free article] [PubMed] [Google Scholar]
- 69.Ruiz M, Ståhlman M, Borén J, Pilon M. 2019. AdipoR1 and AdipoR2 maintain membrane fluidity in most human cell types and independently of adiponectin. J Lipid Res 60(5):995–1004, PMID: 30890562, 10.1194/jlr.M092494. [DOI] [PMC free article] [PubMed] [Google Scholar]
- 70.Otvos LJ Jr, Haspinger E, La Russa F, Maspero F, Graziano P, Kovalszky I, et al. 2011. Design and development of a peptide-based adiponectin receptor agonist for cancer treatment. BMC Biotechnol 11:90, PMID: 21974986, 10.1186/1472-6750-11-90. [DOI] [PMC free article] [PubMed] [Google Scholar]
- 71.Wang C, Le Y, Lu D, Zhao M, Dou X, Zhang Q. 2020. Triphenyl phosphate causes a sexually dimorphic metabolism dysfunction associated with disordered adiponectin receptors in pubertal mice. J Hazard Mater 388:121732, PMID: 31796355, 10.1016/j.jhazmat.2019.121732. [DOI] [PubMed] [Google Scholar]
- 72.Green AJ, Graham JL, Gonzalez EA, La Frano MR, Petropoulou S-SE, Park J-S, et al. 2017. Perinatal triphenyl phosphate exposure accelerates type 2 diabetes onset and increases adipose accumulation in UCD-type 2 diabetes mellitus rats. Reprod Toxicol 68:119–129, PMID: 27421578, 10.1016/j.reprotox.2016.07.009. [DOI] [PMC free article] [PubMed] [Google Scholar]
- 73.Yamauchi T, Kadowaki T. 2013. Adiponectin receptor as a key player in healthy longevity and obesity-related diseases. Cell Metab 17(2):185–196, PMID: 23352188, 10.1016/j.cmet.2013.01.001. [DOI] [PubMed] [Google Scholar]
- 74.Ali N, Dirtu AC, Van den Eede N, Goosey E, Harrad S, Neels H, et al. 2012. Occurrence of alternative flame retardants in indoor dust from New Zealand: indoor sources and human exposure assessment. Chemosphere 88(11):1276–1282, PMID: 22551874, 10.1016/j.chemosphere.2012.03.100. [DOI] [PubMed] [Google Scholar]
- 75.Somkuti SG, Abou-Donia MB. 1990. Disposition, elimination, and metabolism of tri-o-cresyl phosphate following daily oral administration in Fischer 344 male rats. Arch Toxicol 64(7):572–579, PMID: 2073130, 10.1007/BF01971837. [DOI] [PubMed] [Google Scholar]
- 76.Wang X, Chen P, Zhao L, Zhu L, Wu F. 2021. Transplacental behaviors of organophosphate tri- and diesters based on paired human maternal and cord whole blood: efficiencies and impact factors. Environ Sci Technol 55(5):3091–3100, PMID: 33397100, 10.1021/acs.est.0c06095. [DOI] [PubMed] [Google Scholar]
- 77.Ding E, Deng F, Fang J, Li T, Hou M, Liu J, et al. 2023. Association between organophosphate ester exposure and insulin resistance with glycometabolic disorders among older Chinese adults 60-69 years of age: evidence from the China BAPE study. Environ Health Perspect 131(4):047009, PMID: 37042841, 10.1289/EHP11896. [DOI] [PMC free article] [PubMed] [Google Scholar]
- 78.Choi SR, Lim JH, Kim MY, Kim EN, Kim Y, Choi BS, et al. 2018. Adiponectin receptor agonist AdipoRon decreased ceramide, and lipotoxicity, and ameliorated diabetic nephropathy. Metabolism 85:348–360, PMID: 29462574, 10.1016/j.metabol.2018.02.004. [DOI] [PubMed] [Google Scholar]
- 79.Zhao F, Li Y, Zhang S, Ding M, Hu J. 2019. Association of aryl organophosphate flame retardants triphenyl phosphate and 2-ethylhexyl diphenyl phosphate with human blood triglyceride and total cholesterol levels. Environ Sci Technol Lett 6(9):532–537, 10.1021/acs.estlett.9b00417. [DOI] [Google Scholar]
Associated Data
This section collects any data citations, data availability statements, or supplementary materials included in this article.