Abstract
Understanding the dynamics of the African swine fever virus during periods of intense replication is critical for effective combatting of the rapid spread. In our research, we have developed a fractional-order SVEIR model using the Caputo derivatives to investigate this behaviour. We have established the existence and uniqueness of the solution through fixed point theory and determined the basic reproduction number using the next-generation matrix method. Our study also involves an examination of the local and global stability of disease-free equilibrium points. Additionally, we have conducted optimal control analysis with two control variables to increase the number of recovered pigs while reducing the number of those infected and exposed. We have supported our findings with numerical simulations to demonstrate the effectiveness of the control strategy.
Keywords: African swine fever, Caputo fractional derivative, Stability analysis, Optimal control, Numerical Simulation.
Subject terms: Mathematics and computing, Infectious diseases
Introduction
Animal illnesses, particularly international animal diseases, can have substantial economic consequences at the farm, regional, and national levels due to losses in livestock output and the high costs of prevention, control, or eradication strategies. The most significant and economically destructive swine disease in existence today is without a doubt African swine fever(ASF). A member of the Asfarviridae family of DNA viruses is the cause of ASF. The first instance was noted in Kenya in 1921, where the disease is still endemic in sub-Saharan Africa. It is now widespread around the world, affecting more than 50 nations, including the Republic of Korea, China, Malaysia, Germany, Bhutan, and India. It is also present in Africa, Europe, Asia, and the Pacific, which resulted in enormous losses1. Due to its high mortality rate and socioeconomic impact, ASF is a notifiable illness that poses a danger to the production and commerce of pork. High fever, unconsciousness, breathing issues, vomiting, diarrhoea, appetite loss, and reddish warts near the ear, mouth, legs, and groins constitute some of the symptoms of ASF. A variety of scientific disciplines have taken part in developing efficient control strategies to reduce the spread of ASF.
In the twenty-first century, mathematical biology has become increasingly valuable to researchers. One of its primary applications is understanding and managing contagious diseases through mathematical modelling. A significant development in epidemiological research is the utilization of mathematics to grasp the dynamics of infectious disease spread2–8. Mathematical principles also provide insights into interactions between disease vectors and their hosts. The widespread use of these models has been facilitated by the advent of new computing technologies.
Designing real-world models, particularly those of biological systems, depends extensively on fractional calculus. Given their capacity to simulate a wide range of complicated events, fractional order differential equations (FODEs) have attracted the interest of numerous academics across a variety of disciplines, including engineering, finance, and epidemiology9–17. For example, adaptive synchronization, mass equations, optimal control problems, equations of motion, and chemical reactions have all been studied using FODEs recently18,19. Through various iterative techniques, these problems can be solved numerically. The fractional order model addresses the limitations by introducing a non-integer derivative, which allows for memory effects and long-term correlations in the system. This approach has been shown to provide a better fit to empirical data and to better capture the dynamics of infectious diseases. Therefore, the development of fractional order models represents an important advancement in epidemiological modeling. As a result, disease patterns may be described more precisely, and future outbreaks can be predicted more accurately. The effectiveness of FODEs in estimating actual data is one of its additional benefits. FODEs are frequently employed in place of traditional models because they frequently do not adequately fit the field data20. For instance, when compared to experimental data, the FODE model for the dengue disease outbreak was said to have done well21. Furthermore Caputo derivative approach is better suited for fractional modelling of epidemic diseases because it guarantees non-singular initial conditions, accounts for memory effects, provides a physical interpretation and is computationally efficient (see, for instance,22–43).
ASF virus has a huge negative impact on the GDP of several countries. As a result, finding a viable method to prevent the spread of this virus and control the disease is critical. Despite major scientific achievements, the World Organization for Animal Health (WOAH) highlights the importance of knowing the history and evolution of the African swine fever virus (ASFV) spread to develop strategies to reduce transmission. According to the literature, the transmission dynamics of ASF have received limited research in terms of mathematical modelling. Some studies have reported the impact of ASFV in the form of integer order derivative (see44). Currently, a small number of integer and non-integer systems have been established to test, investigate and comprehend the ASF virus1,44–46. In a relevant study, Barongo et al.44 present a stochastic model aimed at simulating the transmission dynamics of ASFV within a free-ranging pig population, considering different intervention scenarios.
The researchers utilized the model to evaluate the comparative impact of various prevention methods on death due to diseases. They incorporated a decay function on the transmission rate to simulate the implementation of biosecurity measures. Shi et al.45 introduced a basic fractional-order model to describe the transmission dynamics of African swine fever. They considered two cases: constant control and optimal control. In the former case, they established the existence and uniqueness of a positive solution, determined the basic reproduction number, and obtained sufficient conditions for the stability of two equilibria using the next-generation matrix method and Lyapunov LaSalle’s invariance principle. In the latter case, they focused on optimal control. By employing the Hamiltonian function and Pontryagin’s maximum principle, they derived the optimal control formula. Many scientists have constructed various models and conducted quantitative studies using Euler’s and Adam’s PECE methods to validate the theoretical findings. Kouidere et al.1,46 developed a classical and fractional model for ASFV. They conducted a sensitivity analysis of the model parameters to identify the parameters with a significant influence on the reproduction number  . Based on their findings, the researchers proposed multiple strategies to effectively decrease the amount of diseased pigs and parasites.
In addition, the impact of fractional order and medical resources on system stability was investigated in47. The authors in48 developed fractional order models with media coverage, showing that timely media coverage and disinfection control measures are crucial for preventing the spread of African swine fever. For instance, the authors in49 analyzed a fractional order ASF model with saturation incidence, demonstrating that timely and effective disinfection measures are important to prevent disease spread. These models provide valuable insights for developing effective ASF prevention and control strategies. The vaccination strategy has recently been shown to be an effective technique for preventing disease transmission. Developing an effective vaccine for ASF has been challenging due to the complex nature of the virus. Vaccination is a widely utilized strategy of disease control. Vaccination serves as a booster to enhance and prolong the immune response, providing better protection against the disease50,51. The entire world has accepted the challenge of developing an ASFV vaccine. Through a successful partnership between Navetco, a Vietnamese company, and researchers from the United States Agricultural Research Institute (ARS), a momentous advancement has been realized. This joint endeavour has resulted in the development of NAVET-ASFVAC, an unprecedented vaccine designed to combat African swine fever (ASF). Notably, this vaccine stands as the world’s first commercially available solution of its kind, marking a significant milestone in the global effort to combat ASF. To model, investigate, and comprehend the ASFV, numerous mathematical models have been developed. Taking inspiration from the aforementioned studies, we created a Caputo fractional SVEIR model to investigate the effect of vaccination on ASFV transmission dynamics. To the best of our knowledge, no attempts have been made to examine the effect of vaccination on the ASFV model using the Caputo derivative. Our contributions aim to address this research gap and introduce new perspectives to the field of epidemiological modelling, providing valuable theoretical and numerical results for studying the ASFV model using Caputo derivatives. The main contributions and aspects of this paper are outlined below::
Investigate the dynamical behavior of the Caputo fractional SVEIR model, which describes the transmission of ASF virus.
Establish the stability analysis of the mentioned model.
Perform the sensitivity analysis over the model parameters.
Provide an optimal control strategy for an SVEIR model along with control interventions.
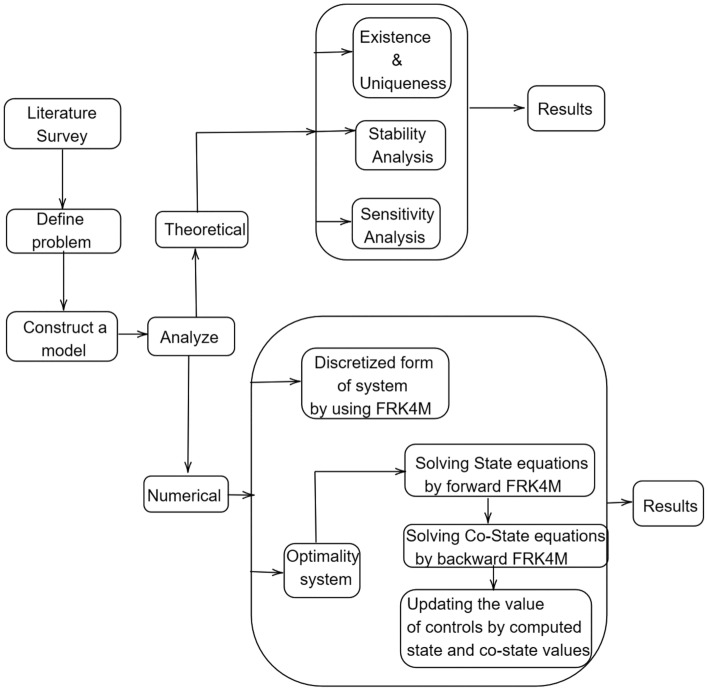
Figure 1 depicts a schematic process of the proposed work.
Fig. 1.
Schematic process of the proposed work.
In this paper, we have structured the content into several key sections. In Section “Preliminaries and methods”, we present basic concepts and preliminary studies. Moving on to Section “Formulation of the Caputo fractional SVEIR model”, we delve into the description of the Caputo fractional ASFV model. The discussion on the positivity and boundness of the system can be found in Section “Positivity and boundedness of solutions of the system”, while the exploration of existence and uniqueness results is located in Section “Existence and uniqueness results”. In Section “Equilibrium points, basic reproduction number and stability analysis of SVEIR model”, we focus on establishing the equilibria of the system and conducting a stability analysis of the basic reproduction number. Furthermore, Section “Sensitivity Analysis” contains the sensitivity analysis of the model. Section “Optimal control analysis of a SVEIR model” introduces an optimal control strategy for an SVEIR model, and the application of Pontryagin’s maximum principle is thoroughly explored in the analysis of the optimal control components. Lastly, Section “Numerical simulation results for SVEIR model” comprises numerical simulations and accompanying discussions, and the article concludes with a summary of our research.
Preliminaries and methods
Preliminaries
The following section of this paper addresses basic definitions and some results of the fractional-order derivatives.
Definition 2.1
13 The fractional integral of a continuous function f(t) on  of order
  is defined as,
 |
where n is a positive integer and  is the Gamma function defined by
Definition 2.2
13 The Caputo fractional derivative for function  of order
  is defined by,
 |
where  is such that
  and
and  is the Gamma function defined by
  .
.
Definition 2.3
13 The Laplace transform of Caputo fractional differential operator of order  is given by,
 |
Definition 2.4
13 The Mittag -Leffler Functions  and
and  defined by the power series
 |
where  is the Gamma function defined by
Lemma 2.1
52Let  be a continuous function. Then, for any time

 |
 , for all

Theorem 2.1
53(Krasnoselskii’s fixed point theorem) Let
 be a non-empty set. Let
 be a closed, convex, non-empty subset of
 and suppose there exist two operators
 such that
-
(i)
 , for all

-
(ii)
 is a contraction;
 -
(iii)
 is compact and continuous.
Then there exists at least one solution
 such that
Formulation of the Caputo fractional SVEIR model
We consider the Caputo sense nonlinear fractional order model for the African swine fever, in which the total population N(t) is assumed to comprise five compartments that include pigs susceptible S(t), the pigs vaccinated V(t), exposed pigs E(t), the pigs infected I(t) and the pigs recovered R(t), at time t  The transmission dynamics of the above population are represented by the following system of nonlinear Caputo fractional order differential equations (CFODE) as
 |
1 |
The initial states are all positive. In this model, the parameter  represents the influx of pigs. The infection rate is represented by
  . Additionally, the immediate vaccination rate for infected pigs transitioning from the susceptible class is given by
  . The rate at which infected pigs are capable of spreading the infection to others is denoted as
  . Meanwhile, the infected pigs that do not transmit the infection to others are categorized as part of the exposed class, with a transfer rate of
  , where
  signifies a positive transfer rate.
The rate of administering an effective precautionary dose against infection is denoted as  . Some individuals recover either naturally or without the need for vaccination, represented by the rate
  . The possibility of recovering without prior infection introduces the potential for subsequent infections, expressed by the parameter
  . Vaccination administered to infected pigs is considered under the rate
  . The transition of pigs to the recovered compartment due to the effectiveness of vaccination after a certain period is indicated by
  . The transmission from exposed pigs to infected pigs is accounted for in the proportion of
  . The parameter
  captures the natural death proportion of pigs. Here all the model parameter values are assumed to be positive constants. Further, the flowchart of the SVEIR model is shown in Fig. 2.
Fig. 2.
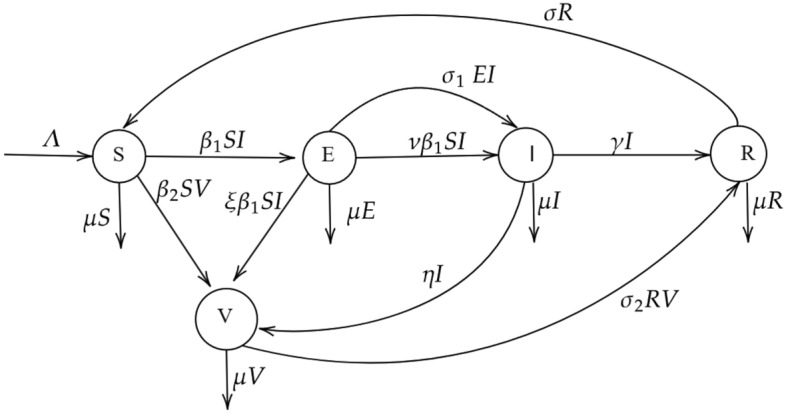
Schematic flowchart for SVEIR model.
Positivity and boundedness of solutions of the system
To be biologically well-posed, the fractional-order model solution must be positive and bounded at all periods.
Theorem 4.1
In Caputo system (1), the variables have a positive value for every t
 and
and
 is positively invariant where
 .
.
Proof
First, we show that S(t), V(t), E(t), I(t) and R(t) of (1) are always positive for every t . Using the system (1), that we have,
 |
2 |
From the above, and by using the Generalized mean-values theorem, the positivity of the model (1) is obvious. Next from the total population of the model (1), we get,
 |
it indicates that
 |
Now taking the Laplace and inverse Laplace transform on both side, we obtain,
 |
According to the Mittag Leffler function:
 |
Hence
 |
Thus  and hence the mentioned system (1) is bounded above by
  Finally we conclude that initial states are all positive functions implies the solution space
  is positively invariant.
Existence and uniqueness results
In the section, we determine the existence and uniqueness of the considered model (1) under the Caputo fractional derivative with the help of fixed point theory. The model (1) can be written as follows
 |
3 |
where
 |
4 |
Thus the Caputo model (1) takes the form
 |
5 |
if
 |
6 |
Here  represents the transpose operation. Now we can write (5) as by the fractional integral representation,
 |
7 |
Let  = C([0,b];
 ) be the Banach space of all continuous function from [0,b] to
  provided with the norm defined by
  , where
  and
and  Suppose that
  and
and  is to be continuous and bounded in order to determine existence and uniqueness of solutions. Therefore, we assume that
 There exists a constants
  , such that
 for all
  .
. There exists a constants
  ,
,  and each
  , such that
By well-known Krasnoselskii’s fixed point theorem, to establish that a solutions of the system (7) exists, which is equal with the suggested model (1).
Theorem 5.1
Given the assumption
 together with the continuity of
 then (7) which is equivalent with the mentioned system (1) has atleast one solution when

Proof
Now Let  and
and  and we consider
  . Let us take two operators
  on
on  defined by,
 |
and
 |
Thus, for any  , yields
 |
Hence  To show that
  is contraction operator. For any
  we obtains
 |
8 |
The operator  must also be continuous because the function
  is continuous. Moreover any
  and
and 
 |
9 |
Hence  is uniformly bounded. Next, we need to prove the operator
  is compact. Let
Then for any  such that
  gives,
 |
Hence,  is equicontinuous and also it is relatively compact on
  By applying the Arzela Ascoli theorem,
  is compact on
  because it is already proved that the operator is uniformly bounded and continuous. Thus using the Krasnoselskii’s fixed point theorem model (1) posses at least one solution on
  .
. 
Theorem 5.2
The integral Eq. (7) which is equivalent with the mentioned system (1) has a unique solution under the assumption  provided that
 where
where

Proof
Consider  defined by
 |
10 |
The operator  is obviously well defined and the only solution to the model (1)) is merely the fixed point of
  . Let
. Let  &
&  Therefore we need to show that
Here  is closed and convex. Now for any
  obtains,
 |
Hence the results follows, also given for any  we get
 |
As a result of the Banach contraction principle, the proposed model (1) has exactly one solution. 
Remark 5.3
By using the Krasnoselskii’s fixed point theorem and Banach tontraction principle the proposed model has a unique solution.
Equilibrium points, basic reproduction number and stability analysis of SVEIR model
Equilibria and their stability
In this subsection, the equilibrium points of the Caputo fractional order system (1) is derived. Depends on the model parameter, the positive real equilibrium point exists. First, the equilibrium point  of the system (1) is given as
 |
Suppose the model parameters satisfies,  then the equilibrium point
  of the system (1) exists, and is defined as
 |
Similarly the model parameters satisfies the conditions  and
and  then the another equilibrium point
 |
exists. Finally there exists a endemic equilibrium point. In this paper, the equilibrium point  is considered as disease free equilibrium(DFE) point of the system (1).
The model basic reproduction number
The basic reproduction number (BRN), which measures the average number of secondary infections caused by the introduction of one infected person into a fully susceptible community, typically governs the dynamics and stability of a disease model. In other words, it affects whether the illness spreads over the entire population or not. It is denoted by  .
.
To calculate the BRN ( ) for the fractional order SVEIR model, we use the methods described in54. It can be obtained from the dominant eigen value of the matrix
  where
where
 |
Here the BRN ( ) can be found by using realistic DFE point value
  . Hence we obtain the basic reproduction number (
 ) for the mentioned model (1) as follows,
 |
Further, we define a notation for future study,
 |
Local stability analysis
In this part, we delve into a detailed discussion on the local stability of the equilibrium point  and
and  for system (1).
Theorem 6.1
The equilibrium point
 is locally asymptotically stable if
  and
and
 holds.
Proof
The Jacobian matrix  of the system (1) is obtained as follows
 =
=
 |
The Characteristic equation of  is
is  =0 is given by
 |
Therefore, the eigenvalues are
 |
Suppose the model parameters satisfies the inequality  and
and  , then all the eigen values are real negative real parts. Hence the equilibrium point at
  is locally asymptotically stable.
Theorem 6.2
The equilibrium point
 is locally asymptotically stable if
 with
with
 and
and
 holds.
Proof
The characteristic equation of  is
is  =0 is given by
 |
The eigen values of  are given by the following:
 |
Here the eigen values are all negative real parts. Thus the equilibrium point  is locally asymptotically stable when the inequality
  and
and  .
. 
Theorem 6.3
The DFE point
 is locally asymptotically stable if
 and
and
 holds.
Proof
The Jacobian matrix  of the system (1) at the point
  , if
, if  and
and  is given by
 |
The characteristic equation of  is
is
 |
It can be easily seen that the two eigen values are negative, when  and the other three eigen values can be obtained from the cubic equation. Where
 |
Hence by the Routh-Hurwitz condition the DFE point  is locally asymptotically stable if
  are positive and
  . Therefore we conclude that
  is is locally asymptotically stable, if

The above theorems indicate that if the model parameters satisfy the condition  with
with  , then the system reaches the equilibrium point
  after a certain period. However, if
  , a second equilibrium point
  emerges, which is stable when
  and the condition
  holds. Suppose, if
  , a disease-free equilibrium point
  exists and is locally stable when the basic reproduction number
  . This indicates that once the disease-free equilibrium point exists, it remains locally stable if
  .
.
Global stability analysis
In this section, we establish the global stability of the equilibrium point  and
and  for the Caputo fractional model (1) by using Lyapunov and LaSalle’s invariance principle method55.
Theorem 6.4
If
 and
and
 , then the equilibrium point
 is globally asymptotically stable.
Proof
We consider the Lyapunov function  Applying the Caputo derivative for the aforementioned equation and applying the lemma (2.1) we have,
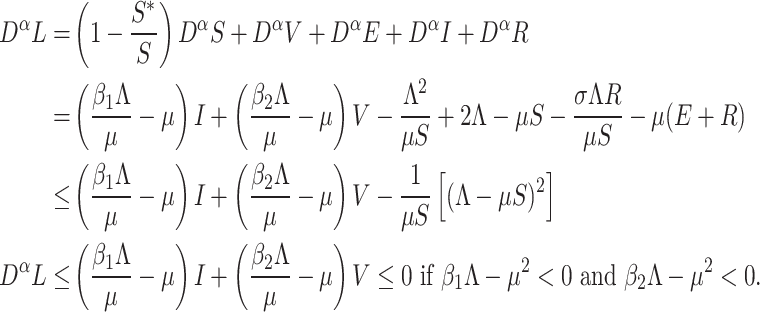 |
Then we obtain  for all
  .
.
According to the LaSalle’s invariance principle55, it is clear that  is globally asymptotically stable.
Theorem 6.5
The equilibrium point  is globally asymptotically stable if
 and
and

Proof
Let us define the Lyapunov function as  Then
Then
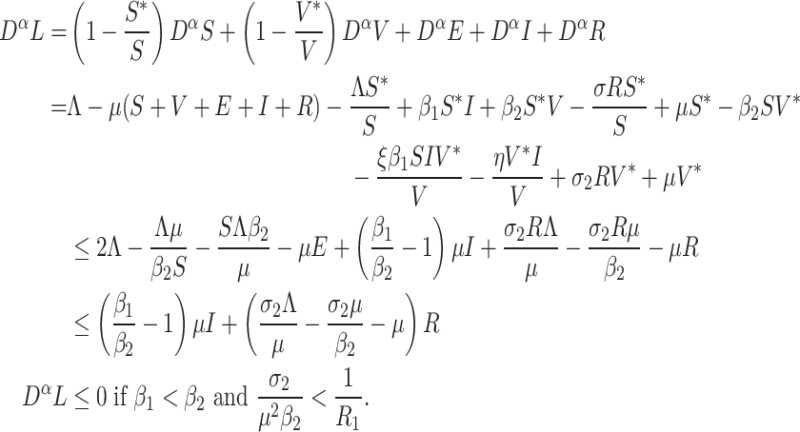 |
Then we obtain  for all
  . The invariant set of system (1) on the set
  is the singleton
  . Hence
  is globally asymptotically stable.
Sensitivity analysis
This section presents the sensitivity analysis for SVEIR Caputo model for ASFV. It is important to highlight that the impact of a parameter is most pronounced when its sensitivity index value is higher. The positive and negative signs in the analysis demonstrate the association between these parameters and the analyzed variables, specifically the basic reproduction number. Conducting a parameter sensitivity analysis will help identify the necessary measures to halt the transmission of ASFV.
The sensitivity index  with respect to the parameters are calculated using partial derivatives , and it can be obtain as follows:
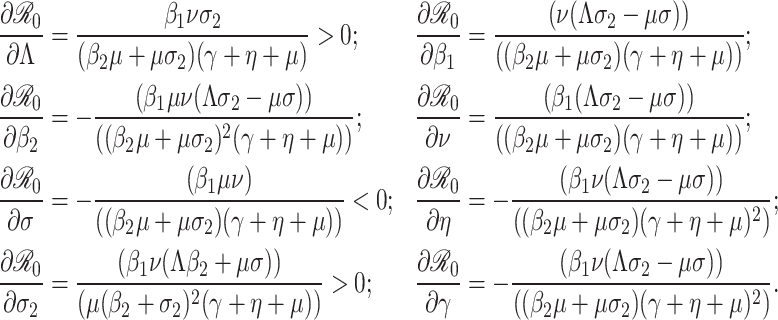 |
From the analysis, it is evident that an increase in the total population leads to a rise in the number of infected individuals within the system. Conversely, recovering pigs from the susceptible compartment or administering vaccination significantly reduces the spread of infection. Furthermore, if the model parameters satisfy the condition  , an increase in the infection rate among pigs will complicate the system by facilitating further spread of the infection. Providing vaccinations to both susceptible and infected pigs is an effective strategy to mitigate the transmission of disease. From this study, we observed that controlling the vaccination rate
  and the recovery rate
  plays a crucial role in effectively reducing the spread of infection.
Optimal control analysis of a SVEIR model
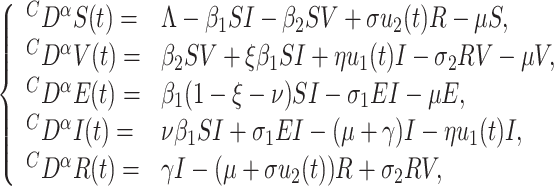
In this section, we apply optimal control theory techniques to develop an effective strategy for limiting the transmission of ASF virus in pigs. In order to incorporate the efficiency of vaccination using a control measure for the system (1), we introduce two controls variables namely  and
and  . Here the tightening bio-security measures at a given time t served as the first control, as denoted by
  and the second control
  , represented the efficient disinfectant at t. However, iron fencing can be an important component of a bio-security plan to help prevent the contact and spread of the virus on pig farms. Implement a rigorous sanitation program to reduce the risk of introducing or spreading ASF. This includes regularly cleaning and disinfecting all equipment and vehicles that come into contact with pigs or their environment. These measures work together to create a comprehensive approach that helps to minimize the risk of ASF transmission and protect the health of the pigs on the farm.
Optimal control theory is a mathematical framework used to find the best control strategies for a given system, typically by optimizing an objective function. In the context of epidemic diseases, optimal control theory can be applied to model the spread of the disease and determine effective intervention strategies to mitigate its impact56–61. Agarwal et al.62 and Ding et al.63 have significantly enhanced the theory of optimal control within the field of fractional calculus through their valuable contributions. Pontryagain’s maximal principle (see64) is a cornerstone of the fundamental concept of optimal control in the realm of fractional calculus.
The system of equations is modified after the inclusion of the time-dependent control is as follows:
 |
11 |
with the initial states S(0), V(0), I(0), E(0) and R(0) are all non negative.
Remark: The SVEIR model with control variables
 and
and
 is proposed after noticing the importance of model parameter from the sensitivity analysis of the basic reproduction number.
These two control functions are both limited and Lebesgue integrable on [0,  ], where
  is the fixed time interval length to which controls are applied.
Our goals here are to reduce the number of infected pigs by increasing recovered pigs population and reducing exposed and infected pigs, as well as to reduce the costs associated with controls. It can be quantitatively described by optimizing the cost functional:
 |
12 |
Where  and
and  represents the positive weights and
  and
and  are the measure of relative cost of the intervention strategies of the control
  and
and  respectively. Objective is to find the control parameters
  and
and  , such that,
 |
13 |
Here the control set  is defined by,
 |
14 |
Characterization of optimal control functions
Pontryagin maximum principle is used to derive the necessary condition for optimality conditions for our system. In order to do this we define Hamiltonian  of the problem (12) at time t is defined by,
 |
15 |
Here  are the co-state variables for
  with the co-state equations as follows:
 |
Necessary optimality conditions
Theorem 8.1
The optimal controls  and
and  and corresponding solutions of the state Eq. (11) are
  and
and
 then there exists co-state variables
 and
and
 satisfying the following:
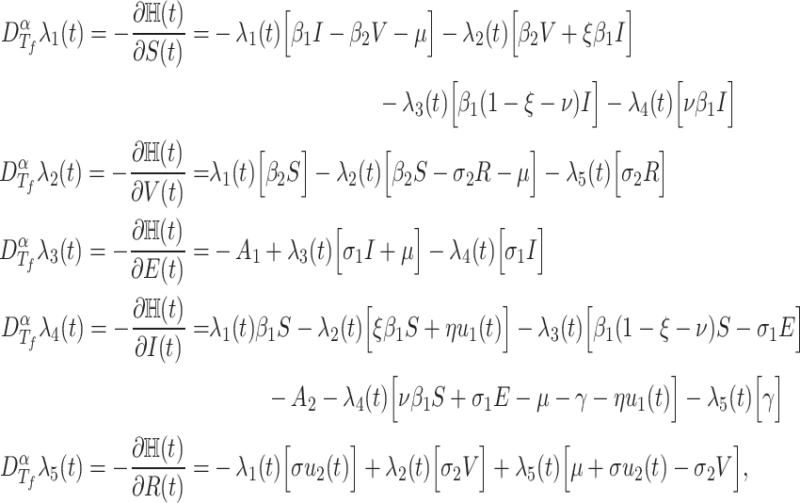 |
with the transversality condition
 and
and  . Moreover the objective function J is minimized within the region U by the optimal controls
 and
and
 are given by,
 |
Proof
Let us define the Hamiltonian function as follows:
 |
By employing Pontryagin’s maximum principle, we can derive the adjoint equations and transversality conditions for all t within the interval [0,  ]. We obtain the co state equations as follows:
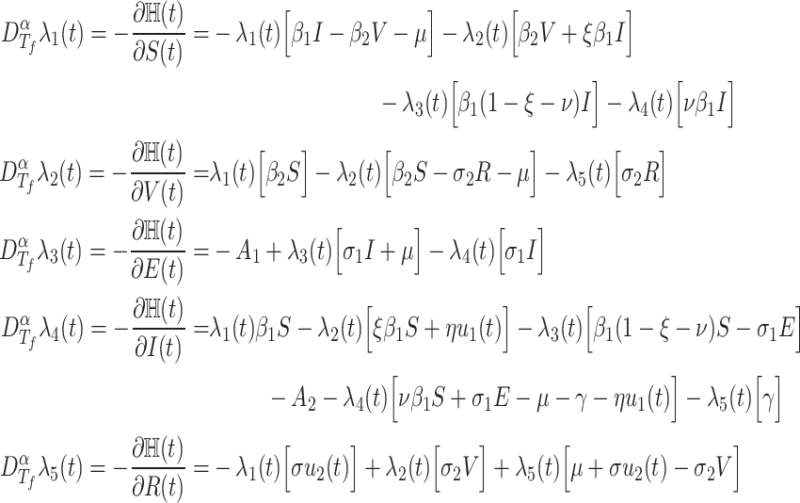 |
For  the transversality condition
  and
and  Further using Pontryagin’s maximum principle we obtain the optimality controls
  and
and 
 |
16 |
From the minimum of the cost functional  we obtain the optimal controls
  and
and  as follows
 |
This completes the proof. 
Numerical simulation results for SVEIR model
This section provides an overview of the numerical methods employed in our study. In subsection (9.1), we utilized the FRK4M to solve the discretized form of Caputo system (1) through numerical computation. Furthermore, in subsection (9.2), we apply the forward backward sweep method (FBSM) using the FRK4M to solve the optimality system (11). These methods provide precise numerical solutions over extended time intervals. MATLAB software is employed for simulations, utilizing the specified initial conditions and parameters.
Fractional Runge Kutta method of the fourth order
This FRK4M, an extension of the classical Runge-Kutta technique, is particularly adept at handling systems involving fractional differential equations65–68. To demonstrate the utilization of the FRK4M in solving the model presented in (1), we begin by considering the general form of the fractional differential equation (FDE),
 |
17 |
To formulate the numerical scheme for the FRK4M , we partition the interval [0, T] into n equal subintervals using points  , where
  for
for  and
and  with
with  representing the step size. The formulation of the FRK4M numerical scheme is represented as follows:
 |
Now, we observe the approximated solutions for S(t), V(t), E(t), I(t) and R(t) utilizing a step size of 0.01 for various values of the fractional order  The initial values are
  and
and  along with the parameter values utilized are as specified in Table 1.
Table 1.
Model parameter values.
| Parameter |  |
 |
 |
 |
 |
 |
 |
 |
 |
 |
 |
|---|---|---|---|---|---|---|---|---|---|---|---|
| Value | 1 | 0.26 | 0.2 | 0.9 | 0.09 | 0.2 | 0.2 | 0.1 | 0.3 | 0.4 | 0.1 |
We performed numerical simulations with initial values and specified parameters as in Table 1 for the system (1) using both classical and a range of fractional order values, encompassing  , and 1.
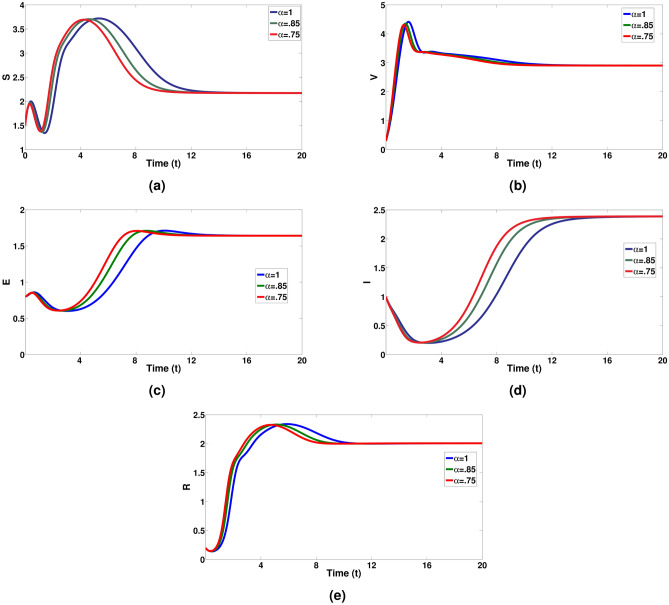
It’s great to see the different dynamics represented in the figures. The visual depiction in Fig. 3 effectively showcases how the fractional disease model provides a deeper understanding of the disease behaviour. In Fig. 3a, the evolution of susceptible pigs over time, varying both classical and different fractional orders of  , is presented, demonstrating the impact of varying fractional orders of
  on the proportion of susceptible pigs. Figure 3b illustrates the changes in vaccinated pigs over time, showing how they increase and then slowly decline due to the
  values. Figure 3c–e depict the dynamical behaviour of exposed pigs over time, confirming a significant increase in the proportion of exposed, infected, and recovered pigs.
Fig. 3.
Visualizes the dynamical behaviour of all pigs population with respect to days for a integer and non-integer values of  .
.
FBSM using FRK4M
FBSM represents a highly efficient iterative method for addressing optimality systems. Building upon the foundation of FRK4M, we have enhanced FBSM to tackle our FOCP. The procedure commences with an initial estimation of the control variable. Subsequently, the state equations are solved forward in time simultaneously, while the adjoint equations are solved backwards in time. The control variable is updated using the newly computed state and adjoint values, and this iterative process continues until convergence is achieved.
Next, we discuss the numerical simulations of FOCP of the mentioned system (1). We have acquired the solutions of the optimality system using the algorithm discussed, employing the state variables with in the initial values as  and the parameter values listed in Table 2.
Table 2.
Model parameter values.
| Parameter |  |
 |
 |
 |
 |
 |
 |
 |
 |
 |
 |
|---|---|---|---|---|---|---|---|---|---|---|---|
| Value | 1 | 0.42 | 0.2 | 0.2 | 0.2 | 0.1 | 0.2 | 0.1 | 0.3 | 0.1 | 0.7 |
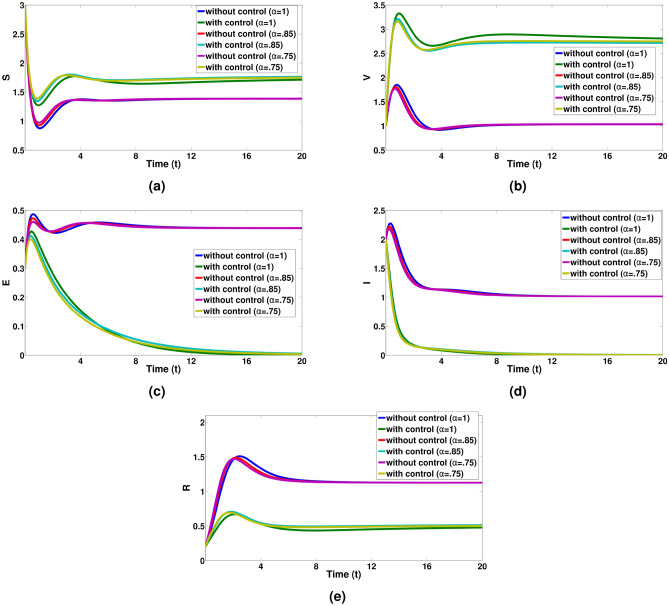
The numerical simulations are presented in the Fig. 4. In Fig. 4a–e, it is evident that the implementation of control measures leads to a greater increase in the number of susceptible pigs, vaccinated pigs, Exposed pigs, Infected pigs and recovered pigs compared to the scenario without any control measures. The profile of the control variables  and
and  are depicts in Fig. 5.
Fig. 4.
Graphical representation for S, V, E, I and R compartments with and without optimal controls for a integer and non-integer values of  .
.
Fig. 5.
Optimal control trajectory of  with integer and non-integer values of
  .
.
The following is the algorithm used for the numerical simulations to obtain the optimal solution for the proposed system:
Algorithm
-
Step 1:
Fix the model parameters and set h,
 , T and
  .
. -
Step 2:
Initialize the state variable g(t).
-
Step 3:
Set the
 value.
 -
Step 4:
Consider the initial condition
 . For each time step n = 0, 1, 2,…, N compute the next value of
  .
. -
Step 5:
Perform the Runge kutta method for the proposed state system to obtain the solution without control.
-
Step 6:
Initialize the co-state variables.
-
Step 7:
Perform the state system with control parameters in a forward time loop.
-
Step 8:
Perform the co-state system in the Runge-kutta method over a time backward loop.
-
Step 9:
Modify the control variable by the optimility condition.
-
Step 10:
Calculate the tolerance of error. Iterate until the error is less than prescribed value
-
Step 11:
If loop breaks, repeat from the step 3 for different

-
Step 12:
Plot the output.
-
Step 13:
End.
Figure 4a reveals that, under control measures, the susceptible pig population is elevated in comparison to the situation where no control measures are in place. The findings presented in Fig. 4b show that when implementing the control inputs  and
and  are put into action, the number of vaccinated pigs population is higher rate compared to the situation where no control measures are in respective places. The outcomes shown in Fig. 4c and d strongly indicate the impact of control measures on the populations of exposed and infected pigs. Implementing control parameters results in a substantial decrease in the populations of exposed and infected pigs. Consequently, this reduction in the population of exposed and infected pigs is associated with an increase in the population of recovered pigs as shown in Fig. 4e . Finally from Fig. 4a–e, we can see a notable decline in the populations of exposed and infected pigs when control strategies are put into effect, and by the end of the control period, there is a corresponding increase in the populations of vaccinated and recovered pigs. Therefore, optimal control proves its effectiveness in reducing the populations of exposed and infected pigs within the desired time frame. In Fig. 5, we can observe the control strategies represented by
  and
and  . As shown in Fig. 5a, there is an initial implementation of tightening biosecurity measures, aimed at isolating vaccinated pigs to prevent infections and minimize viral transmission within the farm. These measures are gradually relaxed as the intervention progresses towards its conclusion. In Fig. 5b, we see a different strategy where an effective disinfectant is initially administered to all pigs, with the possibility of increasing its usage over time as the number of recovered pigs rises. Timely vaccination efforts facilitate the transition of pigs from the susceptible (S) compartment to the vaccinated (V) compartment, thereby reducing the exposed and infected populations. If
  is applied consistently and effectively, the susceptible population will decrease rapidly, while the vaccinated population will grow, slowing the spread of the disease. Similarly, disinfection efforts governed by
  help to reduce virus transmission in the environment, lowering the numbers of exposed (E) and infected (I) pigs over time. Proper sanitation significantly curbs the spread of ASF, ensuring that fewer susceptible animals become exposed or infected.
Conclusions
In this research, we have developed a Caputo fractional order mathematical model to describe the transmission behaviours of the ASFV within the SVEIR framework. Our study encompasses an analysis of solution positivity and boundedness of the system. we computed the basic reproductive number  for our SVEIR model. Following that, we derive conditions that ensure the DFE point exhibits both local and global asymptotic stability. The sensitivity study was performed on this model by using
  . Furthermore, we introduced a FOCP and derived the necessary optimality conditions using the Pontryagin maximum principle. To gain insights into the system behaviour, we conducted numerical simulations employing the FRK4M method, and we solved the resulting optimality system numerically by developing the FBSM with FRK4M. Through the implementation of control variables such as enforced biosafety measures and the use of effective disinfectants, we can effectively manage and curb the spread of the African swine fever virus. Also, we conclude from the simulation results, the incorporation of vaccination compartments into our model represents a novel approach compared to existing ASFV models1,44–49. The important features of our work are as follows:
The proposed fractional-order model presents notable benefits by accounting for memory effects, enhancing flexibility and precision, capturing non-local dynamics, and offering improved tools for control and optimization.
Our findings demonstrate its remarkable effectiveness, highlighting it as the optimal strategy for disease eradication.
The graphical results demonstrate that the model yields greater adaptability and richer outcomes. These attributes make fractional-order models better suited for modeling complex, real-world systems compared to traditional integer-order models.
This approach enhances the accuracy of predictions regarding disease spread and control measures, allowing for more effective prevention and intervention strategies.
Limitations of the current work
Future studies employ actual ASFV case data to optimize parameter values in the model. Moreover, we aim to expand the model to incorporate a more complex and realistic network framework.
A stochastic modeling approach that accounts for uncertainty in the dynamics of ASFV could also be explored.
Time delays are a widely recognized feature of epidemic models. In our future research, we intend to broaden this study by including time delays.
Acknowledgements
The authors would like to thank for the facilities provided by Department of Mathematics, Vellore Institute of Technology, Chennai Campus and Department of Applied Sciences, National Institute of Technology Goa.
Author contributions
S.S and H.S: Conceptualization; methodology; writing – original draft; formal analysis; software. P.V and S.L: Methodology; investigation; visualization; validation; supervision; writing – review and editing; software
Funding
Open access funding provided by Vellore Institute of Technology. The authors declare that no funds, grants, or other support were received during the preparation of this manuscript.
Data availibility
The datasets used and/or analysed during the current study available from the corresponding author on reasonable request.
Declerations
Competing interests
The authors have no competing interests to declare that are relevant to the content of this article.
Ethical approval
Not applicable.
Footnotes
Publisher’s note
Springer Nature remains neutral with regard to jurisdictional claims in published maps and institutional affiliations.
These authors contributed equally to this work.
References
- 1.Kouidere, A., Balatif, O. & Rachik, M. Analysis and optimal control of a mathematical modeling of the spread of African swine fever virus with a case study of South Korea and cost-effectiveness. Chaos, Solitons Fractals146, 110867 (2021). [Google Scholar]
- 2.Mahroug, F. & Bentout, S. Dynamics of a diffusion dispersal viral epidemic model with age infection in a spatially heterogeneous environment with general nonlinear function. Math. Methods Appl. Sci.46, 14983–15010 (2023). [Google Scholar]
- 3.Djilali, S., Bentout, S. & Tridane, A. Dynamics of a generalized nonlocal dispersion SIS epidemic model. J. Evol. Equ.24, 1–24 (2024).38111514 [Google Scholar]
- 4.Soufiane, B. & Touaoula, T. M. Global analysis of an infection age model with a class of nonlinear incidence rates. J. Math. Anal. Appl.434, 1211–1239 (2016). [Google Scholar]
- 5.Djilali, S., Bentout, S., Kumar, S. & Touaoula, T. M. Approximating the asymptomatic infectious cases of the COVID-19 disease in Algeria and India using a mathematical model. Int. J. Model. Simul. Sci. Comput.13, 2250028 (2022). [Google Scholar]
- 6.Bentout, S. & Djilali, S. Asymptotic profiles of a nonlocal dispersal SIR epidemic model with treat-age in a heterogeneous environment. Math. Comput. Simul.203, 926–956 (2023). [Google Scholar]
- 7.Bentout, S. Analysis of global behavior in an age-structured epidemic model with nonlocal dispersal and distributed delay. Math. Methods Appl. Sci.47, 7219–7242 (2024). [Google Scholar]
- 8.Hariharan, S., Shangerganesh, L., Debbouche, A. & Antonov, V. Dynamic behaviors for fractional epidemiological model featuring vaccination and quarantine compartments. J. Appl. Math. Comput. 1–21 (2024).
- 9.Guo, Y. & Li, T. Fractional-order modeling and optimal control of a new online game addiction model based on real data. Commun. Nonlinear Sci. Numer. Simul.121, 107221 (2023). [Google Scholar]
- 10.Padder, A. et al. Dynamical analysis of generalized tumor model with Caputo fractional-order derivative. Fractal Fract.7, 258 (2023). [Google Scholar]
- 11.Vieira, L. C., Costa, R. S. & Valério, D. An overview of mathematical modelling in cancer research: Fractional Calculus as modelling tool. Fractal Fract.7, 595 (2023). [Google Scholar]
- 12.Baleanu, D., Diethelm, K., Scalas, E. & Trujillo, J. J. Fractional calculus: models and numerical methods (2012).
- 13.Kilbas, A., Srivastava, H. & Trujillo, J. Theory and applications of fractional differential equations (2006).
- 14.Djilali, S., Chen, Y. & Bentout, S. Dynamics of a delayed nonlocal reaction–diffusion heroin epidemic model in a heterogenous environment. Math. Methods Appl. Sci. (2024).
- 15.Djilali, S., Bentout, S., Zeb, A. & Saeed, T. Global stability of hybrid smoking model with nonlocal diffusion. Fractals30, 2240224 (2022). [Google Scholar]
- 16.Bentout, S., Djilali, S., Touaoula, T. M., Zeb, A. & Atangana, A. Bifurcation analysis for a double age dependence epidemic model with two delays. Nonlinear Dyn.108, 1821–1835 (2022). [Google Scholar]
- 17.Chen, W.-C. Nonlinear dynamics and chaos in a fractional-order financial system. Chaos Solitons Fractals36, 1305–1314 (2008). [Google Scholar]
- 18.Jiang, C., Zada, A., Şenel, M. T. & Li, T. Synchronization of bidirectional n-coupled fractional-order chaotic systems with ring connection based on antisymmetric structure. Adv. Differ. Equ.2019, 1–16 (2019). [Google Scholar]
- 19.Xua, C., Liaob, M., Farman, M. & Shehzade, A. Hydrogenolysis of glycerol by heterogeneous catalysis: A fractional order kinetic model with analysis. MATCH Commun. Math. Comput. Chem.91, 635–664 (2024). [Google Scholar]
- 20.Ahmad, S. et al. Fractional order mathematical modeling of COVID-19 transmission. Chaos Solitons Fractals139, 110256 (2020). [DOI] [PMC free article] [PubMed] [Google Scholar]
- 21.Hamdan, N. I. & Kilicman, A. A fractional order SIR epidemic model for dengue transmission. Chaos Solitons Fractals114, 55–62 (2018). [Google Scholar]
- 22.Ullah, I., Ahmad, S., ur Rahman, M. & Arfan, M. Investigation of fractional order tuberculosis (TB) model via Caputo derivative. Chaos Solitons Fractals142, 110479 (2021).
- 23.Jajarmi, A. & Baleanu, D. A new fractional analysis on the interaction of HIV with CD4+ T-cells. Chaos Solitons Fractals113, 221–229 (2018). [Google Scholar]
- 24.Ucar, E., Özdemir, N. & Altun, E. Fractional order model of immune cells influenced by cancer cells. Math. Model. Nat. Phenom.14, 308 (2019). [Google Scholar]
- 25.Evirgen, F. Transmission of Nipah virus dynamics under Caputo fractional derivative. J. Comput. Appl. Math.418, 114654 (2023). [Google Scholar]
- 26.Atangana, A. & Qureshi, S. Mathematical modeling of an autonomous nonlinear dynamical system for malaria transmission using Caputo derivative. Fract. Order Anal. Theory Methods Appl. 225–252 (2020).
- 27.Suganya, S. & Parthiban, V. A mathematical review on Caputo fractional derivative models for Covid-19. AIP Conf. Proc.2852, 110003 (2023). [Google Scholar]
- 28.Xu, C. et al. Theoretical exploration and controller design of bifurcation in a plankton population dynamical system accompanying delay. Discret. Contin. Dyn. Syst.-S (2024).
- 29.Xu, C. et al. Bifurcation investigation and control scheme of fractional neural networks owning multiple delays. Comput. Appl. Math.43, 1–33 (2024). [Google Scholar]
- 30.Xu, C., Farman, M. & Shehzad, A. Analysis and chaotic behavior of a fish farming model with singular and non-singular kernel. Int. J. Biomath. 2350105 (2023).
- 31.Xu, C. et al. New results on bifurcation for fractional-order octonion-valued neural networks involving delays. Netw.: Comput. Neural Syst. 1–53 (2024). [DOI] [PubMed]
- 32.Yang, Y., Qi, Q., Hu, J., Dai, J. & Yang, C. Adaptive fault-tolerant control for consensus of nonlinear fractional-order multi-agent systems with diffusion. Fractal Fract.7, 760 (2023). [Google Scholar]
- 33.Li, H. & Wu, Y. Dynamics of SCIR modeling for COVID-19 with immigration. Complexity2022, 9182830 (2022). [Google Scholar]
- 34.Zhao, Y., Sun, Y., Liu, Z. & Wang, Y. Solvability for boundary value problems of nonlinear fractional differential equations with mixed perturbations of the second type. AIMS Math.5, 557–567 (2020). [Google Scholar]
- 35.Wang, Y., Yang, J. & Zi, Y. Results of positive solutions for the fractional differential system on an infinite interval. J. Funct. Spaces2020, 5174529 (2020). [Google Scholar]
- 36.Zhang, B., Xia, Y., Zhu, L., Liu, H. & Gu, L. Global stability of fractional order coupled systems with impulses via a graphic approach. Mathematics7, 744 (2019). [Google Scholar]
- 37.Wang, J., Lang, J. & Li, F. Constructing Lyapunov functionals for a delayed viral infection model with multitarget cells, nonlinear incidence rate, state-dependent removal rate. J. Nonlinear Sci. Appl.9, 524–536 (2016). [Google Scholar]
- 38.Baleanu, D., Qureshi, S., Yusuf, A., Soomro, A. & Osman, M. Bi-modal COVID-19 transmission with Caputo fractional derivative using statistical epidemic cases. Part. Diff. Equ. Appl. Math. 100732 (2024).
- 39.Tassaddiq, A., Qureshi, S., Soomro, A., Arqub, O. A. & Senol, M. Comparative analysis of classical and Caputo models for COVID-19 spread: Vaccination and stability assessment. Fixed Point Theory Algorithms Sci. Eng.2024, 2 (2024). [Google Scholar]
- 40.Srivastava, H. M. & Saad, K. M. A comparative study of the fractional-order clock chemical model. Mathematics8, 1436 (2020). [Google Scholar]
- 41.Li, P., Shi, S., Xu, C. & Rahman, M. U. Bifurcations, chaotic behavior, sensitivity analysis and new optical solitons solutions of Sasa-Satsuma equation. Nonlinear Dyn.112, 7405–7415 (2024). [Google Scholar]
- 42.Suganya, S. & Parthiban, V. Optimal control analysis of fractional order delayed SIQR model for COVID-19. Eur. Phys. J. Spec. Top. 1–13 (2024).
- 43.Subramanian, S. et al. Fuzzy fractional Caputo derivative of susceptible-infectious-removed epidemic model for childhood diseases. Mathematics12, 466 (2024). [Google Scholar]
- 44.Barongo, M. B., Bishop, R. P., Fèvre, E. M., Knobel, D. L. & Ssematimba, A. A mathematical model that simulates control options for African swine fever virus (ASFV). PLoS ONE11, e0158658 (2016). [DOI] [PMC free article] [PubMed] [Google Scholar]
- 45.Shi, R., Li, Y. & Wang, C. Stability analysis and optimal control of a fractional-order model for African swine fever. Virus Res.288, 198111 (2020). [DOI] [PubMed] [Google Scholar]
- 46.Kouidere, A., Balatif, O. & Rachik, M. Fractional optimal control problem for a mathematical modeling of African swine fever virus transmission. Moroc. J. Pure Appl. Anal.9, 97–110 (2023). [Google Scholar]
- 47.Shi, R., Li, Y. & Wang, C. Analysis of a fractional-order model for African swine fever with effect of limited medical resources. Fractal Fract.7, 430 (2023). [Google Scholar]
- 48.Shi, R., Zhang, Y. & Wang, C. Dynamic analysis and optimal control of fractional order African swine fever models with media coverage. Animals13, 2252 (2023). [DOI] [PMC free article] [PubMed] [Google Scholar]
- 49.Shi, R. & Zhang, Y. Stability analysis of a fractional-order African swine fever model with saturation incidence. Animals14, 1929 (2024). [DOI] [PMC free article] [PubMed] [Google Scholar]
- 50.Ameen, I., Baleanu, D. & Ali, H. M. An efficient algorithm for solving the fractional optimal control of SIRV epidemic model with a combination of vaccination and treatment. Chaos Solitons Fractals137, 109892 (2020). [Google Scholar]
- 51.Mahata, A., Paul, S., Mukherjee, S., Das, M. & Roy, B. Dynamics of Caputo fractional order SEIRV epidemic model with optimal control and stability analysis. Int. J. Appl. Comput. Math.8, 28 (2022). [DOI] [PMC free article] [PubMed] [Google Scholar]
- 52.Vargas-De-León, C. Volterra-type Lyapunov functions for fractional-order epidemic systems. Commun. Nonlinear Sci. Numer. Simul.24, 75–85 (2015). [Google Scholar]
- 53.Verma, P., Tiwari, S. & Verma, A. Theoretical and numerical analysis of fractional order mathematical model on recent COVID-19 model using singular kernel. Proc. Natl. Acad. Sci., India, Sect. A93, 219–232 (2023). [Google Scholar]
- 54.van den Driessche, P. & Watmough, J. Reproduction numbers and sub-threshold endemic equilibria for compartmental models of disease transmission. Math. Biosci.180, 29–48 (2002). [DOI] [PubMed] [Google Scholar]
- 55.LaSalle, J. The stability of dynamical systems. in Regional conference series in applied mathematics, SIAM, Philadelphia, 1976. Khalid Hattaf Department of Mathematics and Computer Science, Faculty of Sciences Ben M’sik, Hassan II University, PO Box7955 (2012).
- 56.Sowndarrajan, P. T., Shangerganesh, L., Debbouche, A. & Torres, D. F. Optimal control of a heroin epidemic mathematical model. Optimization71, 3107–3131 (2022). [Google Scholar]
- 57.Hariharan, S. & Shangerganesh, L. Optimal control problem on cancer–obesity dynamics. Int. J. Biomath. 2450032 (2024).
- 58.Hussain, T. et al. Sensitivity analysis and optimal control of COVID-19 dynamics based on SEIQR model. Results Phys.22, 103956 (2021). [DOI] [PMC free article] [PubMed] [Google Scholar]
- 59.Kheiri, H. & Jafari, M. Optimal control of a fractional-order model for the HIV/AIDS epidemic. Int. J. Biomath. (2018).
- 60.Vellappandi, M., Kumar, P., Govindaraj, V. & Albalawi, W. An optimal control problem for mosaic disease via Caputo fractional derivative. Alex. Eng. J.61, 8027–8037 (2022). [Google Scholar]
- 61.Mohammadi, S. & Hejazi, R. Optimal fractional order PID controller performance in chaotic system of HIV disease: Particle swarm and genetic algorithms optimization method. Comput. Methods Differ. Equ.11, 207–224 (2023). [Google Scholar]
- 62.Agrawal, O. P. A general formulation and solution scheme for fractional optimal control problems. Nonlinear Dyn.38, 323–337 (2004). [Google Scholar]
- 63.Ding, Y., Wang, Z. & Ye, H. Optimal control of a fractional-order HIV-immune system with memory. IEEE Trans. Control Syst. Technol.20, 763–769 (2012). [Google Scholar]
- 64.Kamocki, R. Pontryagin maximum principle for fractional ordinary optimal control problems. Math. Methods Appl. Sci.37, 1668–1686 (2014). [Google Scholar]
- 65.Milici, C., Drăgănescu, G. & Machado, J. Introduction to fractional differential equations (2018).
- 66.Sweilam, N., AL-Mekhlafi, S., Almutairi, A. & Baleanu, D. A hybrid fractional COVID-19 model with general population mask use: Numerical treatments. Alex. Eng. J.60, 3219–3232 (2021). [Google Scholar]
- 67.Ibrahim, Y., Khader, M., Megahed, A., Abd El-Salam, F. & Adel, M. An efficient numerical simulation for the fractional COVID-19 model using the GRK4M together with the fractional FDM. Fractal Fract.6, 304 (2022). [Google Scholar]
- 68.Milici, C., Machado, J. T. & Draganescu, G. Application of the Euler and Runge-Kutta generalized methods for FDE and symbolic packages in the analysis of some fractional attractors. Int. J. Nonlinear Sci. Numer. Simul.21, 159–170 (2020). [Google Scholar]
Associated Data
This section collects any data citations, data availability statements, or supplementary materials included in this article.
Data Availability Statement
The datasets used and/or analysed during the current study available from the corresponding author on reasonable request.


