

Summary
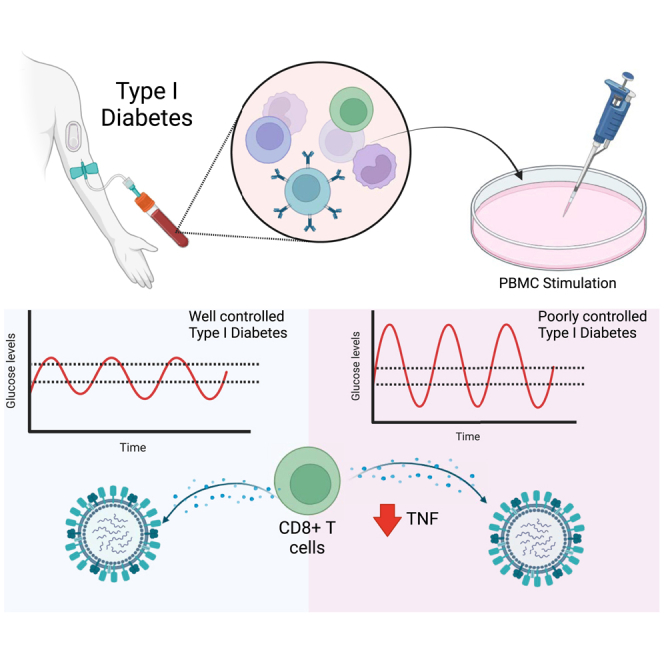
Diabetes mellitus significantly increases the risk of severe respiratory virus disease like influenza and COVID-19. Early evidence suggests that this susceptibility to respiratory viral disease is driven by glycemic variability, rather than average blood glucose levels. Here, we use blood samples and constant glucose monitoring (CGM) data obtained from people living with type 1 diabetes (T1D) to determine the effects of glycemic variability on the ex vivo T cell response to influenza virus. We show that high glycemic variability in participants living with T1D is associated with a reduced proportion of CD8+CD107a−IFNγ−MIP1β−TNF+ T cells in response to stimulation with influenza virus and an influenza virus peptide pool. Thus, this study provides evidence that glycemic variability affects the ex vivo T cell response to respiratory viruses. These data suggest that monitoring glycemic variability may have important implications in understanding the antiviral immune response in people with diabetes.
Subject areas: Endocrinology, Human metabolism
Graphical abstract
Highlights
-
•
Glycemic variability in diabetes can be assessed using continuous glucose monitoring
-
•
High glycemic variability is linked to fewer cytokine-producing T cells to flu
-
•
High glycemic variability is linked to more naive CD8+ T cells and fewer TEMRA CD8+ T cell
Endocrinology; Human metabolism
Introduction
Diabetes mellitus (both type 1 [T1D] and type 2 [T2D]) significantly increases the risk of severe respiratory virus infections.1,2,3,4 The mechanisms by which this occurs remain poorly defined. Hyperglycaemia (high blood glucose levels) is typical of both T1D and T2D and its persistence is indicated by elevated glycated hemoglobin (HbA1C) levels. Hyperglycaemia is associated with increased susceptibility to severe disease, including respiratory tract infections. A meta-analysis showed that chronic hyperglycaemia (HbAa1c levels ≥7.0%) is associated with at least a 2.5-fold increased risk of pulmonary tuberculosis relative to patients with lower (<7.0%) HbA1c levels.5 Hyperglycaemia (relative to in range blood glucose levels) also significantly increased the risk of mortality, ICU admission, and intubation for COVID-19 in patients with T2D.6 Similarly, in vitro high glucose levels increase pulmonary epithelial-endothelial damage from influenza virus infection.7 An elevated HbA1C in patients with diabetes is also associated with impaired TNF production to influenza virus by CD8+ T cells.8
In contrast to consistently high average blood glucose levels there is now a growing body of evidence that glycemic variability may also play a significant role in susceptibility to severe respiratory virus infections.4,9,10,11,12,13 Typically, in healthy individuals blood glucose levels remain relatively stable throughout the day except for small and short-lived post-prandial peaks. However, in individuals living with diabetes these postprandial glucose spikes are more frequent and higher in magnitude. This glycemic variability is not indicated in measurements of a patient’s HbA1c, which largely reflects a 3-month average of blood glucose levels in terms of the percentage of glycated hemoglobin. Instead, blood glucose variability can be detected using continuous glucose monitors (CGM). Indeed, CGM data have shown that both T1D patients and T2D patients experience significant fluctuations in blood glucose levels over time.14,15 In contrast, healthy individuals with CGM data display minimal, if any, out of range fluctuations.16 Several studies have shown that glycemic variability increases the severity of COVID-194,11,12,13 and there is evidence that a similar phenomenon occurs with influenza virus.9 However, such studies typically depend on successive measurements of an individual’s blood glucose levels (rather than CGM data) and the mechanisms underlying this association remain to be determined.
Here, we hypothesize that high glycemic variability (as determined by CGM data) reduces the anti-viral immune response to influenza virus.
Results
Patient characteristics
To investigate the effect of glycemic variability on anti-viral T cell populations, 32 participants with T1D were recruited. These participants all had at least two weeks of CGM data available for analysis. Using a CV threshold of 33%, participants were classified as having either low (n = 13) or high (n = 19) glycemic variability. Participants with low and high glycemic variability were of equivalent age, sex distribution, type of insulin treatment (injection/pump), body mass index (BMI), had a similar duration of diabetes (approximately 15 years; Table 1), and recent history of influenza virus infection. Importantly, participants with low and high glycemic variability had equivalent HbA1c levels and blood glucose levels at the time of sample collection (Table 1). The high glycemic variability group had a lower rate of influenza virus vaccination within the last 6 months (Table 1). Patients reported taking several other medications asides from those associated with diabetes management, the most common of which was some form of contraception (Table S1).
Table 1.
Participant characteristics using a threshold of 33% CV
| Low glycemic variability (n = 13)a |
High glycemic variability (n = 19) |
p valueb | |
|---|---|---|---|
| Mean (SD) | Mean (SD) | ||
| Age (years) | 29.88 (±11.69) | 26.49 (±6.67) | 0.6172 |
| Sex (male; female) | 4; 9 | 6; 13 | 0.5993 |
| BMI (kg/m2) | 26.33 (±4.79) | 26.45 (±4.94) | >0.9999 |
| HbA1c (%) | 7.92 (±1.75) | 7.75 (±1.42) | 0.5505 |
| Diabetes duration (years) | 14.54 (±9.12) | 15.15 (±5.24) | 0.6151 |
| Average blood glucose (mmol/L)c | 11.83 (±3.54) | 9.83 (±2.65) | 0.0823 |
| CV (%) | 27.01 (±4.32) | 39.15 (±3.25) | <0.0001 (∗) |
| Type of insulin treatment (injection; pump)d | 4; 9 | 9; 10 | 0.3477 |
| Time in range (%) | 38.38 (±28) | 56.95 (20.85) | 0.04 (∗) |
| Influenza virus vaccination (Y; N) | 10; 3 | 5; 14 | 0.0048 (∗) |
| Recent respiratory virus infection (Y; N) | 0; 13 | 0; 19 | – |
12/13 individuals received two vaccine doses; 1 individual only received one.
All individuals received two vaccine doses with the exception of one individual for whom data were not available.
BMI, body-mass index; HbA1c, glycated hemoglobin type A1C; CGM, continuous glucose monitor; CV, coefficient of variation. Participants were grouped based on their CV% from CGM data, threshold set at 33%.
p value was determined with either Mann-Whitney test (age, BMI, diabetes duration, and average glucose), a t test (time in range) or chi-square test at a 0.05 significance level (sex, type of insulin treatment, influenza virus vaccination history, and SARS-CoV-2 vaccination). Significant p values were denoted with an asterisk (∗).
Average blood glucose levels were recorded as an average of all glucose readings across time worn.
Insulin regime (basal vs. bolus, long lasting vs. fast acting insulin) was not recorded.
To demonstrate the glycemic profile in high and low glycemic variability, representative CGM data from each group is shown in Figure 1A. To evaluate the differences in glycemic profile between low glycemic variability and high glycemic variability with a CV threshold at 33%, the time glucose levels were above and below the healthy range (3.9 mmol/L–10.0 mmol/L) were assessed (Figure 1B). Participants with high glycemic variability had significantly lesser time spent with hyperglycemic levels, but significantly higher time spent with hypoglycaemic levels (Figure 1B).
Figure 1.

Higher time recorded with hypoglycaemic levels were observed in participants with high glycemic variability (GV)
(A) Representative CGM data for individuals with low glycemic variability and high glycemic variability.
(B) The difference in time glucose levels spent above and below the glycemic healthy range (3.9 mmol/L to 10.0 mmol/L) were analyzed between both groups. Statistical significance was assessed using a Mann-Whitney test or Student’s t test. p < 0.05 ∗; p < 0.001 ∗∗∗ Bars and error bars represent means (±SEM).
Ex vivo T cell responses
To characterize the T cell populations of both participant groups the percentage of circulating CD4+ and CD8+ T cells were assessed. There was no significant difference in the percentage of CD4+, CD8+, the ratio of CD4:CD8 cells or CD4−CD8− T cells between those with low glycemic variability and high glycemic variability (Figure 2A). To better define the subsets of CD4+ and CD8+ T cells the percentage of circulating naive T cells (Tnaive; CD27+CD45RA+CD95−), stem cell memory T cells (TSCM; CD27+CD45RA+CD95+), central memory T cells (TCM; CD27+CD45RA−), effector memory T cells (TEM; CD27−CD45RA−) and effector memory re-expressing CD45RA T cells (TEMRA; CD27−CD45RA+) of the total CD4+ and CD8+ T cell populations were established (Figure 2B). No significant differences were seen in the CD4+ T cell subsets between the two participant groups (Figure 2B). In contrast, patients with high glycemic variability had a significantly higher percentage of Tnaive CD8+ T cells but a significantly lower percentage of TEMRA CD8+ T cells compared to patients with low glycemic variability (Figure 2B).
Figure 2.

Participants with higher glycemic variability (GV) exhibit an altered T cell profile and proportion of TNFα+ cells in response to influenza virus stimulation
PBMC from participants were stained for CD4 and CD8. CD4+, CD4−CD8−, and CD8+ positive T cells (A) were stained for CD27, CD45RA, and CD95 to further define T cell subsets (B). To study T cell function, Boolean gating analysis was used. PBMC were stimulated with HKx31 (MOI10) (C), influenza virus peptide pool (D), Dynabeads (E), and PMA/I (F) for 18 h. PBMC were then stained for CD107a, IFNγ, MIP-1β, and TNF. Statistical significance was assessed using a Mann-Whitney test or Student’s t test. Bars and error bars represent means (±SEM). Gating was performed as previously described.10 ∗: p < 0.05.
Next, the cytokine response of T cells to ex vivo stimulation with infectious influenza virus was assessed (Figure 2C). In terms of CD4+ T cells, a lower proportion of CD107a+IFNγ−MIP1β+TNF+, CD107a+IFNγ−MIP1β−TNF+, and CD107a−IFNγ−MIP1β−TNF+ cells were observed in individuals with high GV. In terms of CD8+ T cells, a lower proportion of CD107a+IFNγ−MIP1β+TNF+, CD107a−IFNγ+MIP1β−TNF−, and CD107a−IFNγ−MIP1β−TNF+ cells were observed in individuals with high GV (Figure 2C). We then sought to validate these observations in CD8+ T cells stimulated with an influenza virus peptide pool (Figure 2D). Consistent with the observations using infectious virus, low glycemic variability samples treated with influenza virus peptide pool had a significantly higher proportion of CD8+CD107a+IFNγ−MIP1β+TNF+ relative to high glycemic variability samples (Figure 2D). Also consistent with our infectious influenza virus stimulations, high glycemic variability samples stimulated with influenza peptides had a significantly lower proportion of CD8+C107a−IFNγ−MIP1β−TNF+ T cells compared to low glycemic variability samples (Figure 2D). When the proportion of any CD8+TNF+ cell after IAV or IAV peptide pool stimulation was examined significantly higher proportions were still observed in low glycemic variability samples (Figure S1). Given that a decreased proportion of CD8+C107a−IFNγ−MIP1β−TNF+ cells in high glycemic variability samples were consistently observed between influenza virus and influenza peptide pool stimulations and showed the largest difference relative to low glycemic variability samples, we elected to focus on this population.
We next sought to determine if individuals with high glycemic variability continued to display a decreased proportion of CD8+CD107a−IFNγ−MIP1β−TNF+ cells in response to non-specific stimuli like PMA/I and Dynabeads (CD3/CD28) (Figures 2E and 2F). Interestingly, unlike influenza virus stimulations, there were several incidences of CD4+ and CD8+ T cell populations being higher in individuals with high glycemic variability following this non-specific stimulation (Figures 2E and 2F). Furthermore, unlike influenza virus stimulations, there was no significant difference in the proportion of CD8+CD107a−IFNγ−MIP1β−TNF+ between those with high glycemic variability and those with low glycemic variability in response to either PMA/I (Figure 2E) or Dynabeads (Figure 2F). Taken together, these data suggest that the observed phenotype may be specific to influenza virus or perhaps more broadly viral peptides.
One limitation of these analyses is that some of the observed changes to influenza virus stimulation may be the result of a differential influenza virus vaccination history between those with low and high glycemic variability (Table 1), although as an inactivated subunit, influenza vaccination does not typically induce strong cellular immunity. Nevertheless, we investigated the ex vivo CD8+ T cell response follow influenza virus stimulation exclusively in influenza vaccinated individuals. Consistent with our original observations influenza vaccinated individuals with low glycemic variability had a higher proportion of CD8+CD107a+IFNγ−MIP1β+TNF+ cells (Figure S2). Furthermore, those with low glycemic variability had a trend toward an increased percentage of CD8+ CD107a−IFNγ−MIP1β−TNF+ T cells (p = 0.05; Figure S2). This held true when the proportion of any CD8+TNF+ cell after IAV stimulation was examined (Figure S2). To further complement these results, we performed a multiple linear regression model looking at the relationship between glycemic variability, influenza vaccination status and the percentage of CD8+CD107a−IFNγ−MIP1β−TNF+ T cells. Importantly glycemic variability (high vs. low) had a significant relationship with the percentage of CD8+ CD107a−IFNγ−MIP1β−TNF+ (p = 0.04) T cells while influenza vaccination did not (p = 0.350).
Discussion
Individuals with diabetes can experience significant intra and inter-day fluctuations in blood glucose levels. To date, the effect of these fluctuations on the T cell response to influenza virus, or other viral diseases, has been undefined. Here, we show that this glycemic variability is associated with changes in the T cell population and reduced CD8+ T cell TNF production to ex vivo stimulation with influenza virus.
Patients with high glycemic variability had a significantly higher percentage of Tnaive CD8+ T cells compared to patients with low glycemic variability. Considering the clinical evidence that high glycemic variability is associated with more severe viral disease4,9,10,11,12,13 it is interesting to speculate what functional consequences increased Tnaive CD8+ T cell population may have. Whether this represents a population of T cells that is unable to differentiate into functional effector or memory cells (which would then likely be associated with an impaired immune response) remains to be determined. Therefore, the clinical consequences of these observations, if any, require further investigation.
In the present study we observed a reduced proportion of CD8+CD107a-IFNγ−MIP1β−TNF+ T cells in response to stimulation with influenza virus. This same phenomenon was not observed following stimulation with non-specific stimuli (such as PMA/I or Dynabeads). This suggests that high glycemic variability does not impair CD8+ T cell function per se rather more specifically the response to influenza virus or viral stimulation. The production of TNF by CD8+ T cells during a viral infection is essential for the induction of apoptosis, the recruitment and activation of other immune cells, CD8+ T cell function and the regulation of anti-viral immunity. However, TNF produced by CD8+ T cells during influenza virus infection can also cause “bystander damage” of pulmonary epithelial cells, resulting in immunopathology.17 Therefore, whether these observations contribute to the increased influenza severity in individuals with diabetes with high glycemic variability4,9,10,11,12,13 remains to be determined. Nevertheless, these data provide the evidence that assessing glycemic variability may provide an important insight into the anti-viral CD8+ T cell response of individuals living with diabetes.
The precise mechanism by which high glycemic variability may reduce the TNF response of CD8+ T cells and affect the proportion of Tnaive and TEMRA CD8+ T cells remains unclear. There is a growing body of evidence that glycemic variability is associated with increased oxidative stress and the production of radical oxygen species (ROS) relative to steady state hyperglycaemia.18 This may directly affect T cell function. For example, short pre-exposure of human PBMC to H2O2 reduces the ability of activated/memory CD3+ and CD8+ T cells (CD45RO+) to produce key effector cytokines such as IFNγ and TNF.19 This effect may be more pronounced in activated/memory T cells.19 Similarly, over production of ROS is known to drive naive T cell proliferation.20,21 Whether these changes in circulating T cell population were the result of oxidative stress or another biological system affected by glucose fluctuations in the blood remain to be determined.
In sum, this study has provided evidence that glycemic variability, rather than steady-state hyperglycaemia, effects T cell responses to influenza virus. These data have important implications for clinical practice. Specifically, these data suggest that glycemic variability provides a possible predicative approach to assess anti-viral immunity, thus providing better management of infectious diseases in this patient population. Indeed, these data represent a further impetus to make CGMs widely available to patients with both T1D and T2D.
Limitations of the study
Our study has some limitations that are important to acknowledge. Firstly, in the participant cohort the sample size was low and glycemic variability was categorized based on two weeks of CGM data. Whether additional effects would have been detected if a longer period of CGM data were available remain to be determined. It is also important to note that the participants recruited to this study all had T1D. This patient group was selected as CGMs are more common among those living with T1D. Interestingly, recent evidence suggests that in patients with T2D who did wear CGMs glycemic variability was associated with changes in the T cell population (namely an altered Th1/Th2 ratio and frequency of Tregs).22 These data suggest that the differences observed in T cell populations observed herein may not be restricted to patients with T1D.22 Finally, additional patient information such as GAD positivity or beta cell function was not recorded and may have influenced the results.
Resource availability
Lead contact
Further information and requests for resources and reagents should be directed to and will be fulfilled by the lead contact, A/Prof Kirsty R. Short (k.short@uq.net.au).
Materials availability
This study did not generate new unique reagents.
Data and code availability
-
•
All data reported in the paper are available from the lead contact upon request. This paper does not report any original code. Any additional information required to reanalyze the data reported in this paper is available from the lead contact upon request.
Acknowledgments
We would like to thank all individuals who participated in this study. This project was supported by the National Health and Medical Research Council (NHMRC; APP1159959). K.R.S. is supported by NHMRC investigator grant 2007919. C.E.v.d.S. is supported by the ARC-DECRA Fellowship (#DE220100185) and the University of Melbourne Establishment Grant. K.K. was supported by the NHMRC Leadership Investigator Grant (#1173871). E.J.G. was supported by an Australian Research Council DECRA Fellowship (DE210101479). S.G. was supported by an NHMRC Senior Research Fellowship (#1159272). L.C.R. is a recipient of an NHMRC EL1 Fellowship (#2026357).
Author contributions
Conceptualization: L.A.G., H.L.B., and K.R.S. Data curation: M.T.Z.W. and K.R.S. Formal analysis and investigation: M.T.Z.W., K.D.H., S.C.L., E.N., E.S.D., K.Y.C., F.A., J.-B.J., J.-P.R., K.L., C.S., S.G., E.J.G., and M.G. Methodology: L.C.R., K.D.H., C.E.v.d.S., K.K., E.J.G., and S.G. Resources: K.R., K.L., and C.S. Funding acquisition: L.A.G. and K.R.S. Writing – original draft preparation: M.T.Z.W. and K.R.S.
Declaration of interests
The authors declare no competing interest.
STAR★Methods
Key resources table
| REAGENT or RESOURCE | SOURCE | IDENTIFIER |
|---|---|---|
| Antibodies | ||
| Anti-CD3 (UCHT1) BV480 | BD Biosciences | Cat #566166; RRID: AB_2739563 |
| Anti-CD4 (SK3) BV650 | BD Biosciences | Cat #563875; RRID: AB_2744425 |
| Anti-CD8 (SK1) PerCP5.5 | BD Biosciences | Cat #565310; RRID: AB_2687497 |
| Anti-CD14 (MØP9) APC-Cy7 | BD Biosciences | Cat #560180; RRID: AB_1645464 |
| Anti-CD19 (HIB19) APC-Cy7 | BD Biosciences | Cat #560727; RRID: AB_1727437 |
| Anti-CD27 (M-T271) APC | BD Biosciences | Cat #558664; RRID: AB_1645457 |
| Anti-CD45RA (HI100) FITC | BD Biosciences | Cat #555488; RRID: AB_395879 |
| Anti-CD95 (DX2) BV421 | BD Biosciences | Cat #562616; RRID: AB_2737679 |
| Live/Dead stain Near Infrared | ThermoFisher Scientific | Cat #L34976 |
| Anti-CD3 (UCHT1) PE-Cy7 | BD Biosciences | Cat #563423; RRID: AB_2738196 |
| Anti-CD4 (RPA-T4) PE | BD Biosciences | Cat #555347; RRID: AB_395752 |
| Anti-CD8 (SK1) PerCP5.5 | BD Biosciences | Cat #565310; RRID: AB_2687497 |
| Anti-TNF (Mab11) AF700 | BD Biosciences | Cat #557996; RRID: AB_396978 |
| Anti-IFNγ (B27) V450 | BD Biosciences | Cat #560371; RRID: AB_1645594 |
| Anti-MIP-1β (D21-135) APC | BD Biosciences | Cat #560686; RRID: AB_1727565 |
| Anti-CD107a (H4A3) FITC | BD Biosciences | Cat #560949; RRID: AB_396134 |
| Live/Dead stain Near Infrared | ThermoFisher Scientific | Cat #L34976 |
| Chemicals, peptides, and recombinant proteins | ||
| phorbol myristate acetate | Sigma Aldrich | Cat #P8139 |
| Ionomycin | Sigma Aldrich | Cat #I0634 |
| CD3/CD28 magnetic beads | ThermoFisher Scientific | Cat #11161D |
| influenza virus peptide pool | AnaSpec | Cat #AS-62340 |
| Critical commercial assays | ||
| BD CytoFix/Cytoperm plus fixation/Permeabilization solution Kit with BD GolgiPlug | BD Biosciences | Cat #555028; RRID: AB_2869013 |
| Software and algorithms | ||
| Prism 7 | Graphpad | Version 7.0; RRID:SCR_002798 |
| FlowJo V10.8 | FlowJo | Version 10.0; RRID:SCR_008520 |
| R software v4.1.1 | R project | Version 4.1.1; RRID:SCR_001905 |
Experimental model and study participant details
Participant recruitment
A cohort of 32 people with clinically diagnosed T1D who were routinely using continuous, or flash glucose monitoring (CGM) devices were recruited in Brisbane, Australia between 8/6/21 and 11/11/21. These individuals were a subset of a previously described cohort of 72 patients with diabetes mellitus (T1D and T2D).18 Inclusion criteria were 18-60 years of age, not pregnant at the time of study, non-smokers of nicotine cigarettes, minimum diabetes mellitus duration of two years and no known immune disease requiring immunosuppressants. Blood, clinical data, and two weeks of prior CGM data from these participants were collected at the point of recruitment. To further establish the quality of CGM data, only samples with CGM time worn above 70% were included in the analysis. This study was approved by Mater Research Ethics Committee (HREC/MML/55151 V2) and the University of Queensland Ethics Committee (2019/HE002522). All methods were performed in accordance with institutional guidelines and regulations. Written consent was obtained from all study participants.
Glycaemic variability
Glycaemic variability was determined based on an individual’s coefficient of variation (CV; glucose SD expressed as a percentage of the mean glucose) reading from their CGM with the threshold set at 33.0% as described previously.19
Method details
Influenza virus culture
Virus stocks of HKx31 (H3N2) were prepared in embryonated chicken eggs and titers of infectious virus were determined by plaque assays on MDCK cells as previously described.23 The use of embryonated chicken eggs was approved by the University of Queensland Animal Ethics Committee (AE000089).
Human PBMC isolation
10 mL of whole peripheral blood was collected in BD Vacutainer EDTA tubes (BD Biosciences). Peripheral blood mononuclear cells (PBMC) were isolated with Lymphoprep (STEMCELL, Canada) according to manufacturer’s instructions. Isolated PBMC were subsequently frozen down in Fetal Calf Serum (FCS) (Gibco) containing 10% DMSO (Sigma-Aldrich) at −80°C until analysis.
Human T cell phenotype characterization
To study the effects of glycemic variability on CD8+ T cell phenotypic markers, PBMCs isolated from participants were stained as previously described.24 Briefly, T-cells were washed and stained for lymphocyte (anti-CD3; anti-CD4 anti-CD8) and differentiation markers (anti-CD27, anti-CD45RA and anti-CD95) (key resources table). T-cells were subsequently washed and fixed. All samples were analyzed on LSRFortessa (BD Biosciences) and analyzed using FlowJo v10.8 (BD Biosciences). Gating was performed as previously described10
T cell stimulation and intracellular cytokine staining (ICS) on human PBMC
To investigate the effect of glycemic variability on the cytokine response of T-cells ex vivo, PBMCs from each donor were stimulated with either i) HKx31 (multiplicity of infection 10), ii) 5 ng/mL phorbol myristate acetate and 1 μg/mL Ionomycin (PMA/I Sigma Aldrich) iii) CD3/CD28 magnetic beads (Thermo Fisher; Dynabeads) or iii) influenza virus peptide pool (4 μg/mL; AnaSpec) (Table S1) in RPMI1640 (Gibco) with 10% FCS (Gibco). Stimulations were performed for 18 h (influenza virus, influenza virus peptide pool) in the presence of anti-CD107a (0.4 μg/mL; BioLegend; H4A3), BD GolgiStop and BD GolgiPlug (BD Biosciences). T-cells were subsequently washed and stained for anti-CD3, CD4 and CD8 (key resources table). T-cells were then washed, fixed, and permeabilized using the BD Cytofix/Cytoperm Fixation/Permeabilization kit (BD Biosciences) and stained with anti-MIP1β, anti-IFNγ and anti-TNF (key resources table). Cells were analyzed on the LSRFortessa (BD Biosciences) and analyzed using FlowJo v10.8 (BD Biosciences). To assess the functionality of these T-cells, the number of MIP-1β+, IFNγ+, TNF+ and CD107a+ cells were assessed according to our previously described gating strategy.10
Quantification and statistical analysis
Statistical analysis
Statistical analyses were performed with GraphPad Prism software (version 9.3.1) (Dotmatics, CA, USA). After determining the normality of distribution with Shapiro-Wilk normality test, outliers within datasets were removed according to the ROUT (1%) test. Continuous data were tested for statistical significance with a Mann-Whitney test, a Kruskal-Wallis test or t-test as appropriate. Categorical data were tested for statistical significance with a chi-square test. Multiple linear regression was performed with R software version 4.1.1 (The R Project).
Published: October 11, 2024
Footnotes
Supplemental information can be found online at https://doi.org/10.1016/j.isci.2024.111166.
Supplemental information
References
- 1.Mertz D., Kim T.H., Johnstone J., Lam P.P., Science M., Kuster S.P., Fadel S.A., Tran D., Fernandez E., Bhatnagar N., Loeb M. Populations at risk for severe or complicated influenza illness: systematic review and meta-analysis. BMJ. 2013;347 doi: 10.1136/bmj.f5061. [DOI] [PMC free article] [PubMed] [Google Scholar]
- 2.Allard R., Leclerc P., Tremblay C., Tannenbaum T.-N. Diabetes and the severity of pandemic influenza A (H1N1) infection. Diabetes Care. 2010;33:1491–1493. doi: 10.2337/dc09-2215. [DOI] [PMC free article] [PubMed] [Google Scholar]
- 3.Longmore D.K., Miller J.E., Bekkering S., Saner C., Mifsud E., Zhu Y., Saffery R., Nichol A., Colditz G., Short K.R., et al. Diabetes and overweight/obesity are independent, nonadditive risk factors for in-hospital severity of COVID-19: an international, multicenter retrospective meta-analysis. Diabetes Care. 2021;44:1281–1290. doi: 10.2337/dc20-2676. [DOI] [PMC free article] [PubMed] [Google Scholar]
- 4.Zhu L., She Z.-G., Cheng X., Qin J.J., Zhang X.J., Cai J., Lei F., Wang H., Xie J., Wang W., et al. Association of blood glucose control and outcomes in patients with COVID-19 and pre-existing type 2 diabetes. Cell Metab. 2020;31:1068–1077.e3. doi: 10.1016/j.cmet.2020.04.021. [DOI] [PMC free article] [PubMed] [Google Scholar]
- 5.Chen Z., Liu Q., Song R., Zhang W., Wang T., Lian Z., Sun X., Liu Y. The association of glycemic level and prevalence of tuberculosis: a meta-analysis. BMC Endo. Dis. 2021;21:123. doi: 10.1186/s12902-021-00779-6. [DOI] [PMC free article] [PubMed] [Google Scholar]
- 6.Charoenngam N., Alexanian S.M., Apovian C.M., Holick M.F. Association between Hyperglycemia at Hospital Presentation and Hospital Outcomes in COVID-19 Patients with and without Type 2 Diabetes: A Retrospective Cohort Study of Hospitalized Inner-City COVID-19 Patients. Nutrients. 2021;13:2199. doi: 10.3390/nu13072199. [DOI] [PMC free article] [PubMed] [Google Scholar]
- 7.Hulme K.D., Yan L., Marshall R.J., Bloxham C.J., Upton K.R., Hasnain S.Z., Bielefeldt-Ohmann H., Loh Z., Ronacher K., Chew K.Y., et al. High glucose levels increase influenza-associated damage to the pulmonary epithelial-endothelial barrier. Elife. 2020;9 doi: 10.7554/eLife.56907. [DOI] [PMC free article] [PubMed] [Google Scholar]
- 8.Hulme K.D., Tong Z.W.M., Rowntree L.C., van de Sandt C.E., Ronacher K., Grant E.J., Dorey E.S., Gallo L.A., Gras S., Kedzierska K., et al. Increasing HbA1c is associated with reduced CD8(+) T cell functionality in response to influenza virus in a TCR-dependent manner in individuals with diabetes mellitus. Cell. Mol. Life Sci. 2024;81:35. doi: 10.1007/s00018-023-05010-4. [DOI] [PMC free article] [PubMed] [Google Scholar]
- 9.Marshall R.J., Armart P., Hulme K.D., Chew K.Y., Brown A.C., Hansbro P.M., Bloxham C.J., Flint M., Ronacher K., Bielefeldt-Ohmann H., et al. Glycemic variability in diabetes increases the severity of influenza. mBio. 2020;11 doi: 10.1128/mbio.02841-19. [DOI] [PMC free article] [PubMed] [Google Scholar]
- 10.Hulme K.D., Gallo L.A., Short K.R. Influenza virus and glycemic variability in diabetes: a killer combination? Front. Microbiol. 2017;8 doi: 10.3389/fmicb.2017.00861. [DOI] [PMC free article] [PubMed] [Google Scholar]
- 11.Hartmann B., Verket M., Balfanz P., Hartmann N.U., Jacobsen M., Brandts J., Dreher M., Kossack N., Häckl D., Marx N., Müller-Wieland D. Glycaemic variability is associated with all-cause mortality in COVID-19 patients with ARDS, a retrospective subcohort study. Sci. Rep. 2022;12:9862. doi: 10.1038/s41598-022-13816-8. [DOI] [PMC free article] [PubMed] [Google Scholar]
- 12.Ali El Chab Parolin S., Benicio Stocco R., Kneipp Lopes J.C., Curcio Pereira M.R., Massae Yamashita M., Domareski Goulart M.E., Demeneck H., Olandoski M., Hermann de Souza Nunes L., Keniche Morisawa V., et al. Association between inpatient glycemic variability and COVID-19 mortality: a prospective study. Diabetol. Metab. Syndr. 2023;15:185. doi: 10.1186/s13098-023-01157-z. [DOI] [PMC free article] [PubMed] [Google Scholar]
- 13.Hoong C.W.S., Yeo X.E., Lin Y., Ooi S.T., Yeoh E. High glycaemic variability is associated with progression of COVID-19. Acta Diabetol. 2021;58:1701–1704. doi: 10.1007/s00592-021-01779-7. [DOI] [PMC free article] [PubMed] [Google Scholar]
- 14.Piona C., Marigliano M., Mozzillo E., Rosanio F., Zanfardino A., Iafusco D., Maltoni G., Zucchini S., Piccinno E., Delvecchio M., Maffeis C. Relationships between HbA1c and continuous glucose monitoring metrics of glycaemic control and glucose variability in a large cohort of children and adolescents with type 1 diabetes. Diabetes Res. Clin. Pract. 2021;177 doi: 10.1016/j.diabres.2021.108933. [DOI] [PubMed] [Google Scholar]
- 15.Rama Chandran S., Tay W.L., Lye W.K., Lim L.L., Ratnasingam J., Tan A.T.B., Gardner D.S.L. Beyond HbA1c: Comparing Glycemic Variability and Glycemic Indices in Predicting Hypoglycemia in Type 1 and Type 2 Diabetes. Diabetes Technol. Ther. 2018;20:353–362. doi: 10.1089/dia.2017.0388. [DOI] [PubMed] [Google Scholar]
- 16.Van Dalem A., Demeester S., Balti E.V., Decochez K., Weets I., Vandemeulebroucke E., Van de Velde U., Walgraeve A., Seret N., De Block C., et al. Relationship between glycaemic variability and hyperglycaemic clamp-derived functional variables in (impending) type 1 diabetes. Diabetologia. 2015;58:2753–2764. doi: 10.1007/s00125-015-3761-y. [DOI] [PubMed] [Google Scholar]
- 17.Van De Sandt C.E., Bárcena M., Koster A.J., Kasper J., Kirkpatrick C.J., Scott D.P., de Vries R.D., Herold S., Rimmelzwaan G.F., Kuiken T., Short K.R. Human CD8+ T cells damage noninfected epithelial cells during influenza virus infection in vitro. Am. J. Respir. Cell Mol. Biol. 2017;57:536–546. doi: 10.1165/rcmb.2016-0377OC. [DOI] [PubMed] [Google Scholar]
- 18.Papachristoforou E., Lambadiari V., Maratou E., Makrilakis K. Association of Glycemic Indices (Hyperglycemia, Glucose Variability, and Hypoglycemia) with Oxidative Stress and Diabetic Complications. J. Diabetes Res. 2020;2020 doi: 10.1155/2020/7489795. [DOI] [PMC free article] [PubMed] [Google Scholar]
- 19.Malmberg K.J., Arulampalam V., Ichihara F., Petersson M., Seki K., Andersson T., Lenkei R., Masucci G., Pettersson S., Kiessling R. Inhibition of activated/memory (CD45RO(+)) T cells by oxidative stress associated with block of NF-kappaB activation. J. Immunol. 2001;167:2595–2601. doi: 10.4049/jimmunol.167.5.2595. [DOI] [PubMed] [Google Scholar]
- 20.Yarosz E.L., Chang C.-H. The Role of Reactive Oxygen Species in Regulating T Cell-mediated Immunity and Disease. Immune Netw. 2018;18 doi: 10.4110/in.2018.18.e14. [DOI] [PMC free article] [PubMed] [Google Scholar]
- 21.Rashida Gnanaprakasam J.N., Wu R., Wang R. Metabolic Reprogramming in Modulating T Cell Reactive Oxygen Species Generation and Antioxidant Capacity. Front. Immunol. 2018;9:1075. doi: 10.3389/fimmu.2018.01075. [DOI] [PMC free article] [PubMed] [Google Scholar]
- 22.Sun Q., Yang P., Gu Q.-W., Gu W.S., Wang W., Wang J., Mao X.M. Increased glycemic variability results in abnormal differentiation of T cell subpopulation in type 2 diabetes patients. J. Diabetes Complications. 2024;38 doi: 10.1016/j.jdiacomp.2024.108738. [DOI] [PubMed] [Google Scholar]
- 23.Short K.R., Diavatopoulos D.A., Reading P.C., Brown L.E., Rogers K.L., Strugnell R.A., Wijburg O.L. Using bioluminescent imaging to investigate synergism between Streptococcus pneumoniae and influenza A virus in infant mice. J. Vis. Exp. 2011;1:2357. doi: 10.3791/2357. [DOI] [PMC free article] [PubMed] [Google Scholar]
- 24.Hensen L., Illing P., Clemens E.B., Nguyen T.H.O., Koutsakos M., van de Sandt C.E., Mifsud N.A., Nguyen A.T., Szeto C., Chua B.Y., et al. CD8+ T cell landscape in Indigenous and non-Indigenous people restricted by influenza mortality-associated HLA-A∗24:02 allomorph. Nat. Commun. 2021;12:2931. doi: 10.1038/s41467-021-23212-x. [DOI] [PMC free article] [PubMed] [Google Scholar]
Associated Data
This section collects any data citations, data availability statements, or supplementary materials included in this article.
Supplementary Materials
Data Availability Statement
-
•
All data reported in the paper are available from the lead contact upon request. This paper does not report any original code. Any additional information required to reanalyze the data reported in this paper is available from the lead contact upon request.