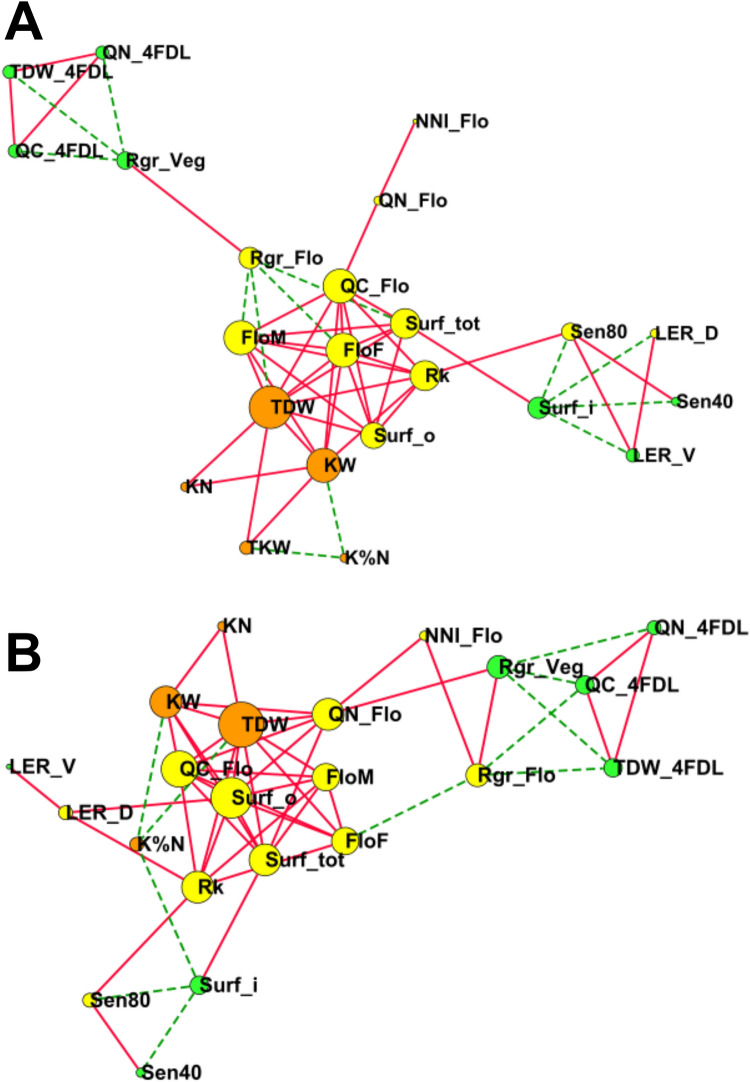
Fig. 1.
Network diagram showing the main correlations between the different eco-physiological, developmental and yield-related traits. Traits were measured in the panel of 29 maize hybrids grown under reduced (LN) and non-limiting (HN) fertilization conditions. Network diagrams show significant correlations with FDR correction (P < 0.05) between trait LSmeans (n = 29) based on positive and negative Pearson coefficients in HN A and LN B. Traits with a larger number of significant correlations are represented by larger dots. Traits with a smaller number of significant correlations are represented by smaller dots. Green dots correspond to the vegetative stage, yellow dots to the flowering stage and orange dots to plant maturity at harvest. Lines represent a significant correlation between two traits. Full red lines represent positive correlations. Dashed green lines represent negative correlations. See Table 1 for definitions of abbreviations and Table S2d for Pearson coefficients and corresponding statistical analyses

